Is XAGUSD poised for a significant breakout, or will the resistance at $67.91 hold firm? The precious metals market is currently at a critical juncture, with Silver (XAGUSD) trading precariously close to a key resistance level. The recent sharp decline in oil prices, coupled with a notable weakening of the US Dollar Index (DXY) following de-escalation optimism in the Middle East, has created a complex backdrop. While these factors might typically support silver, the technical indicators present a mixed picture, demanding a closer look at the underlying dynamics and potential trading scenarios. This analysis delves into the intricate dance between macro forces and chart patterns to decipher the immediate future for XAGUSD.
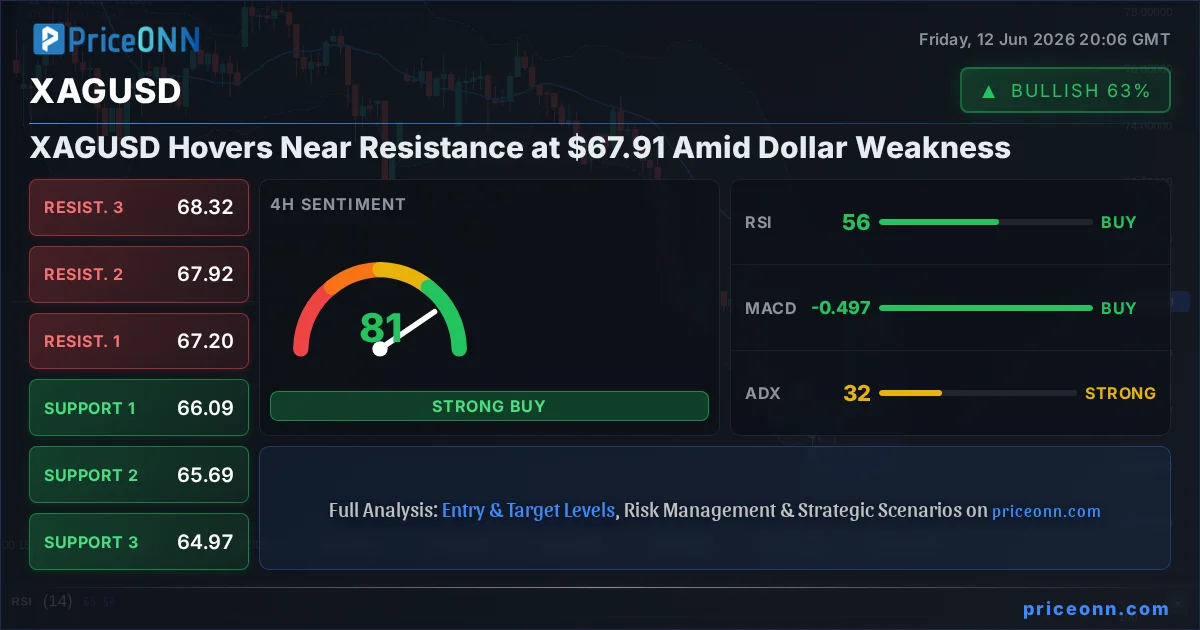
- XAGUSD is currently trading near resistance at $67.91, with the 4-hour chart showing a strong trend (ADX: 32.46) and the 1-hour chart showing a bullish signal (Al: 7, Sat: 1).
- The US Dollar Index (DXY) shows a strong upward trend on the daily chart (ADX: 25.61) but mixed signals on shorter timeframes, creating conflicting pressures.
- RSI readings for XAGUSD are mixed across timeframes (1H: 63.43, 4H: 55.79, 1D: 40.6), indicating a lack of clear overbought or oversold conditions and highlighting market indecision.
- Geopolitical de-escalation news has weakened the dollar, a key driver for metals, creating a potential tailwind for XAGUSD, but strong daily trend signals suggest caution.
The narrative surrounding XAGUSD is currently dominated by a tug-of-war between bullish macroeconomic catalysts and the cautionary signals flashing across various technical timeframes. On the daily chart, silver presents a compelling picture of a market attempting to recover, with the price currently at $67.91, significantly up from its lower range. However, this upward momentum is being tested as it approaches established resistance levels. The ADX on the 1-day timeframe stands at 34.06, indicating a strong downtrend, yet the 1-hour ADX at 18.85 suggests a weak trend, implying a potential for a shift. This divergence highlights the internal conflict within the market sentiment for silver. The recent sharp 7.15% surge on the day, pushing the price from its low of $61.47 to the current $67.91, demonstrates significant buying interest, but the proximity to resistance means traders are on high alert for any signs of reversal or continuation.
The Bull Case: Riding the Dollar's Downward Wave
The primary argument for a continued bullish trajectory in XAGUSD stems from the weakening US Dollar Index (DXY). Recent news regarding de-escalation in the Middle East has sent shockwaves through currency markets, causing the DXY to tumble. While the DXY shows a strong upward trend on the daily chart with an ADX of 25.61 and RSI at 64.78 indicating bullish momentum, shorter timeframes present a more neutral to cautious picture. The 1-hour DXY shows a mixed signal with RSI at 52.71 and MACD negative momentum. This weakening dollar environment typically acts as a tailwind for precious metals like silver, as they become relatively cheaper for holders of other currencies, potentially increasing demand. Furthermore, the sharp 8.45% drop in Brent crude oil prices, down to $88.72, suggests easing inflation expectations. While lower oil prices can sometimes dampen inflation hedges, the immediate impact on the dollar’s weakness is more pronounced for silver's short-term prospects. The strong intraday surge in XAGUSD itself, reflecting robust buying pressure, cannot be ignored. The 1-hour technicals are predominantly bullish, with a strong 'AL' signal (Al: 7, Sat: 1) and Stochastic oscillator indicating further upside potential.
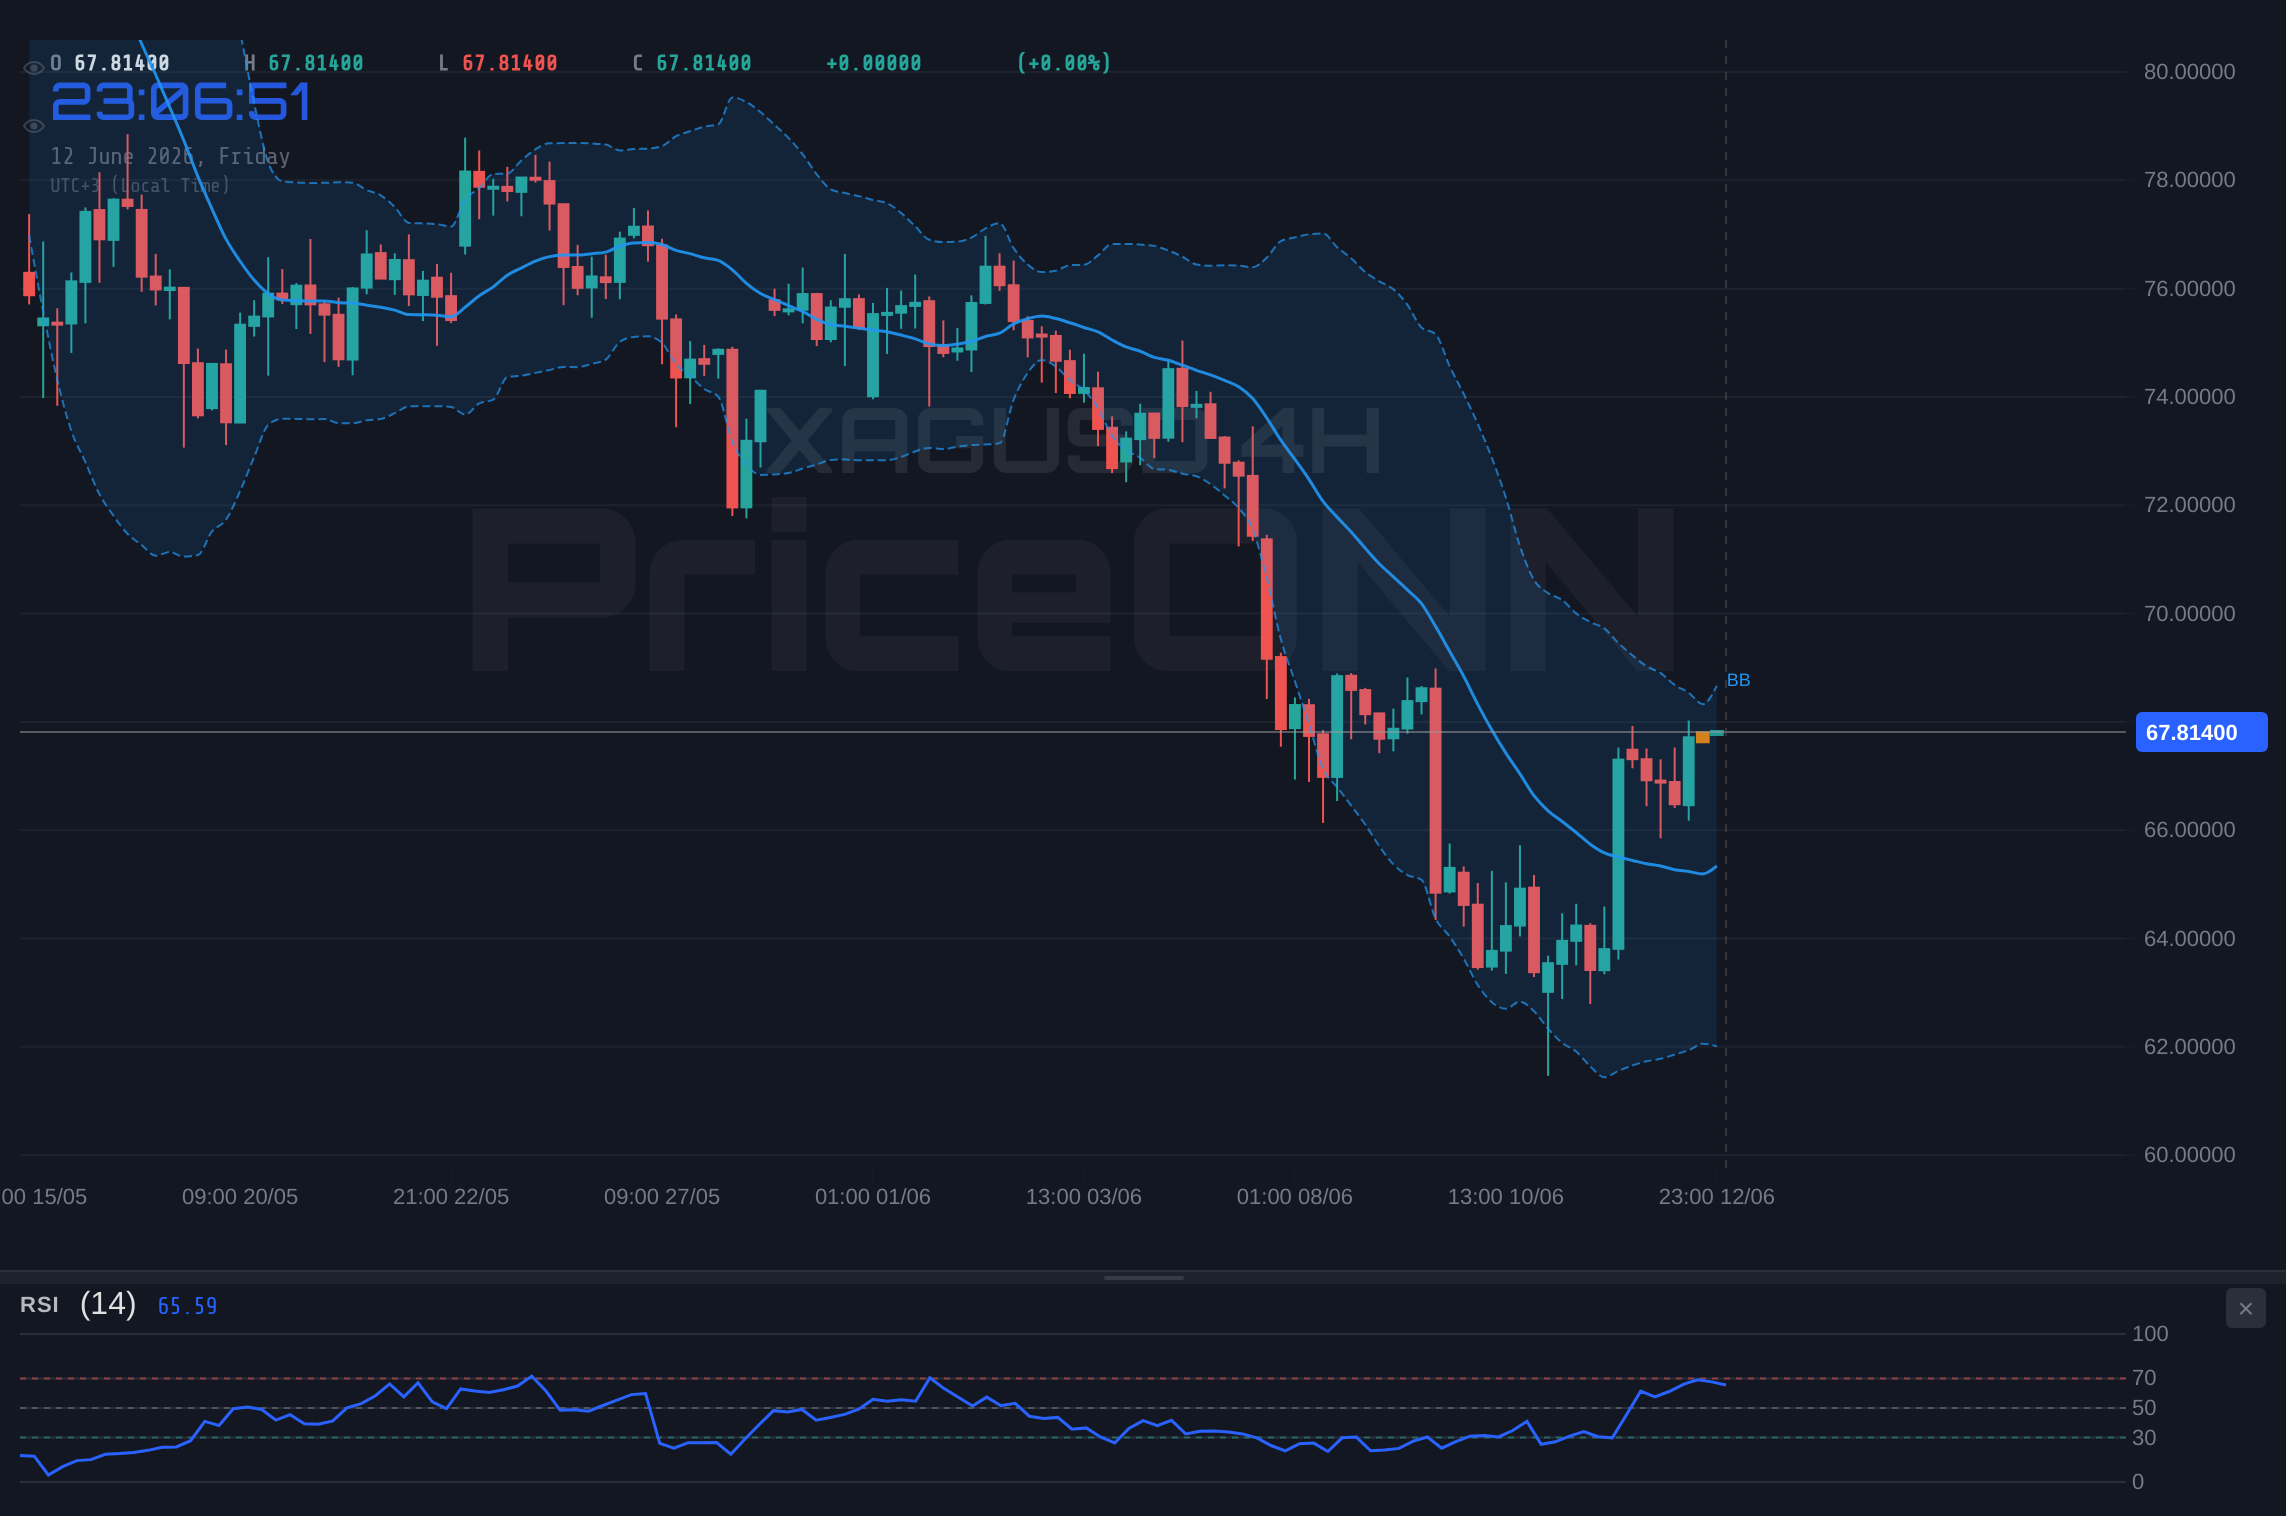
Delving deeper into the technicals supporting the bullish case, the 1-hour chart for XAGUSD paints an encouraging picture for buyers. The RSI, while in the neutral zone at 63.43, is trending upwards, suggesting that momentum is building on the buy side. The MACD, despite showing negative momentum on some longer timeframes, is above its signal line on the 1-hour chart, which can be interpreted as a short-term bullish signal. The Stochastic oscillator, with %K at 84.6 and %D at 71.04, is firmly in bullish territory and trending upwards, reinforcing the idea of continued buying pressure. The Bollinger Bands on the 1-hour chart are also supporting an upward move, with the price trading above the middle band, indicating a bullish bias. Even on the 4-hour chart, where the overall trend is classified as neutral, the signals are leaning bullish with a general 'AL' (Al: 5, Sat: 3). The RSI at 55.79 and Stochastic in the overbought zone (K=84.49, D=84.49) coupled with MACD positive momentum suggest that buyers are in control, pushing the price higher. This confluence of short-to-medium term bullish indicators provides a solid foundation for the argument that XAGUSD is poised to challenge higher resistance levels.
The Dollar's Role: A Shifting Tide
The recent geopolitical developments, particularly the perceived de-escalation in the Middle East, have significantly impacted the US Dollar Index (DXY). News suggesting progress towards a peace deal has led to a sharp sell-off in the dollar, with the DXY experiencing a noticeable decline. This is a critical factor for silver, as the dollar and precious metals often move inversely. When the dollar weakens, assets priced in dollars, like silver, become more attractive to international buyers, boosting demand. The DXY's current struggle to capitalize on any perceived favour, as noted in recent analyses, further supports the bullish outlook for XAGUSD. While the daily DXY chart still shows strength, the intraday charts are revealing cracks in its armor. This dollar weakness, driven by a reduction in perceived global risk, is a fundamental driver that could propel silver prices higher. The market's reaction to this news is a clear signal that traders are pricing in a lower-risk environment, which historically benefits non-yielding assets like silver.
The impact of oil prices cannot be understated either. The substantial 8.45% drop in Brent crude to $88.72 suggests that inflationary pressures might be easing. While this could theoretically reduce the appeal of gold and silver as inflation hedges, the immediate effect of easing geopolitical tensions is a reduction in safe-haven demand for the dollar. This complex interplay means that while inflation fears might be subsiding, the dollar's weakness driven by reduced geopolitical risk is currently the dominant factor supporting silver. The market is clearly reacting to the narrative of de-escalation, and this sentiment shift is likely to continue influencing currency and commodity markets in the short term. Therefore, the bullish case for XAGUSD is significantly bolstered by these macro-economic and geopolitical shifts, even if some underlying inflation concerns remain.
The Bear Case: Resistance Holds, Trend Prevails
Despite the positive macroeconomic backdrop, a strong bear case for XAGUSD can be constructed by focusing on the persistent downtrend indicated by longer-term technicals and the stubbornness of key resistance levels. The daily chart paints a starkly different picture from the shorter timeframes. Here, the ADX is a robust 34.06, clearly defining a strong downtrend. The RSI is at 35.57, firmly in oversold territory but indicating bearish momentum, and the MACD is negative with the histogram below the signal line. This suggests that the recent rally might be a mere retracement within a larger bearish trend, rather than the start of a new bull market. The current price of $67.91 is hovering near significant resistance levels, particularly the 4-hour resistance at $67.92 and the daily resistance at $67.95 (derived from R1: 67.92, R2: 68.18). A failure to decisively break through these levels could lead to a sharp reversal as sellers step in to defend these price points. The historical context also matters; significant rallies within downtrends can often be followed by sharp sell-offs if the underlying bearish structure remains intact.
Furthermore, the conflicting signals across different timeframes warrant extreme caution. While the 1-hour chart is screaming 'buy,' the daily chart is firmly in 'sell' territory. This technical divergence implies that the current bullish momentum might not have enough conviction to sustain a breakout. The Stochastic oscillator on the daily chart is at 14.31, indicating oversold conditions, but this can persist in a strong downtrend. The Bollinger Bands on the daily chart are below the middle band, confirming the bearish bias. The fact that the overall signal on the daily timeframe is a strong 'SAT' (Al: 0, Sat: 8, Nötr: 0) cannot be overlooked. This suggests that the larger trend is against the bulls, and any short-term gains are susceptible to being wiped out quickly. The ADX on the 4-hour chart, at 32.46, also points to a strong trend, albeit a downtrend, indicating that underlying forces are pushing prices lower. Traders adhering to trend-following strategies would be looking for opportunities to short XAGUSD on any signs of weakness near the current resistance.
The Power of the Daily Trend
The daily timeframe analysis is often the most critical for understanding the long-term direction of an asset. In the case of XAGUSD, the daily indicators are overwhelmingly bearish. The RSI at 35.57 suggests that while oversold, there's significant room for further downside before any meaningful recovery is indicated. The MACD's position below the signal line and negative histogram reinforce the bearish momentum. The Bollinger Bands remaining below the middle band are a classic sign of a downtrend. This consistent bearish signal across multiple daily indicators suggests that the prevailing trend is down, and any current price action should be viewed within this context. The strength of the downtrend, as indicated by the ADX at 34.06, means that breaking above significant resistance levels will require substantial buying pressure and sustained conviction, which is currently lacking on this longer timeframe.
The support levels on the daily chart at $62.54, $61.70, and $60.10 represent significant levels where the price has found footing in the past. If the current price action fails to break the resistance at $67.91 and reverses, these lower support levels become the next logical targets. The sheer magnitude of the recent daily gain (7.15%) also raises questions about its sustainability, especially when contrasted with the daily trend's bearish disposition. It could be interpreted as a 'bear market rally' – a sharp, temporary upswing within a larger downtrend, often driven by short-covering or speculative buying that eventually fizzles out. For bears, this is precisely the kind of setup they look for: an asset rallying into a resistance zone while its longer-term trend remains firmly down.
The Verdict: Navigating the Crossroads
The current market for XAGUSD presents a classic bull vs. bear scenario, with conflicting signals across different timeframes. The bullish case is supported by a weakening dollar, de-escalation news leading to reduced safe-haven demand, and strong short-term technical buy signals. The bearish case, however, rests on the powerful downtrend indicated by daily technicals and the proximity to significant resistance. The ADX readings are particularly telling: while the 1-hour shows a weak trend, the 4-hour and daily charts indicate stronger directional movement, albeit a downtrend. The contradiction between the 1-hour 'AL' signal and the daily 'SAT' signal is the crux of the current indecision.
Given the strong daily downtrend (ADX 34.06, RSI 35.57, MACD negative) and the proximity to resistance levels ($67.91, $68.18), the bearish scenario appears to have a higher probability of playing out in the medium term, despite the short-term bullish surge. The recent rally might be a 'dead cat bounce' within the larger downtrend. However, the strength of the intraday move and the clear dollar weakness cannot be entirely dismissed. A decisive break above $68.18 on significant volume, accompanied by sustained dollar weakness and positive daily indicators, could invalidate the bearish thesis. Until then, caution is advised. The risk/reward for a short position entering near current resistance seems more favorable than chasing the current rally without confirmation of a trend reversal.
Trade Scenarios and Probabilities
Bearish Scenario: Resistance Holds Firm
65% ProbabilityNeutral Scenario: Consolidation Near Resistance
25% ProbabilityBullish Scenario: Breakout Confirmation
10% ProbabilityThe current technical setup for XAGUSD is a testament to the dynamic nature of financial markets. While the short-term technicals and macro news offer a glimmer of hope for the bulls, the persistent bearish undertones on the daily chart, coupled with the immediate resistance, suggest that caution is the prudent approach. A decisive move above $68.18 would be required to shift the medium-term outlook. Until then, traders should monitor the price action closely around the current levels, manage risk diligently, and wait for clearer signals. The market always provides opportunities, but patience and discipline are key to navigating these choppy waters. The potential for a reversal at resistance is significant, making a short-term bearish outlook the more probable scenario, especially if the dollar finds its footing again.
Frequently Asked Questions: XAGUSD Analysis
What happens if XAGUSD fails to break above the $68.18 resistance level?
If XAGUSD fails to break above $68.18, the bearish scenario becomes more likely. We could see a retracement towards the 1-hour support at $67.26, followed by a potential test of the 4-hour support at $66.09. This would align with the strong daily downtrend indicated by the ADX at 34.06.
Is the RSI at 63.43 on the 1-hour chart a buy signal for XAGUSD at current levels?
An RSI of 63.43 on the 1-hour chart suggests upward momentum but is not yet in overbought territory. While it supports the short-term bullish view, it needs to be considered alongside the daily RSI of 40.6, which indicates a broader bearish trend. Therefore, it's not a standalone buy signal and requires confirmation of a sustained breakout.
How is the US Dollar Index (DXY) at 99.8 impacting XAGUSD today?
The DXY trading around 99.8, with mixed signals across timeframes despite a daily uptrend, is creating pressure on XAGUSD. News of Middle East de-escalation has weakened the dollar intraday, which is a tailwind for silver. However, any resurgence in dollar strength could quickly reverse silver's gains, highlighting the importance of monitoring DXY's trend.
How will the upcoming UK April GDP release potentially affect XAGUSD?
While the UK April GDP release is not directly tied to XAGUSD, it can influence global risk sentiment and indirectly affect currency markets, including the DXY. Stronger-than-expected GDP might boost the pound and potentially weaken the dollar, offering some support to silver. Conversely, a weak GDP could increase risk aversion, benefiting the dollar and pressuring XAGUSD.
Track markets in real-time
AI-powered analysis, technical indicators and real-time price data.
Join Our Telegram Channel
Breaking market news, AI analysis and trading signals instantly.
Join Channel