The past week has seen Silver, or XAGUSD, trading around the crucial $67.99 mark, a level that’s proving to be a significant battleground for bulls and bears alike. As we step into the weekend, the market is digesting a complex mix of easing geopolitical tensions in the Middle East, which initially sent oil prices tumbling and the US Dollar Index (DXY) into a tailspin, alongside cautious anticipation for upcoming economic data. This delicate balance creates a fascinating technical picture for XAGUSD, where key indicators are flashing mixed signals and the interplay between macro factors and price action demands close scrutiny. This analysis delves into the current state of XAGUSD, examining its correlation with broader market movements, dissecting the technical indicators that shaped the past week, and outlining the critical levels and events to watch in the coming days. We’ll explore how the shifting sands of global economics and geopolitics are influencing this precious metal, aiming to provide a clear roadmap for traders navigating this dynamic environment.
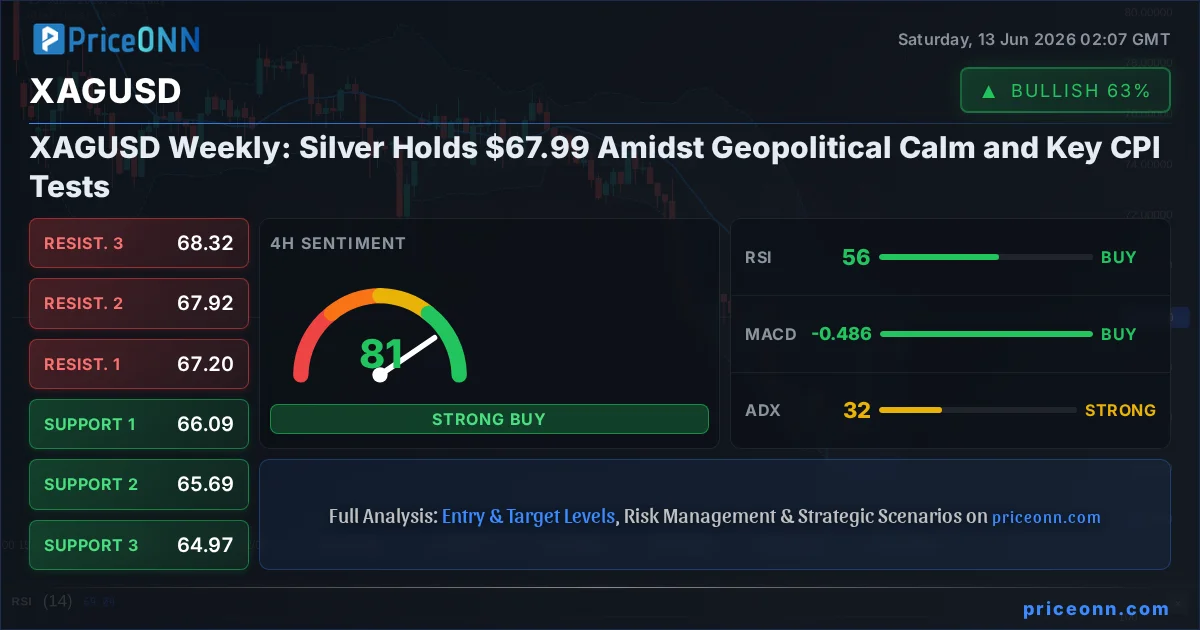
- XAGUSD is currently hovering around $67.99, a critical psychological and technical level.
- The ADX at 32.46 on the 4H chart indicates a strong trend, though the 1D chart shows a Düşüş (Bearish) trend with ADX at 34.06.
- RSI(14) on the 1H chart is at 64.04, showing a bullish inclination, while the 1D RSI sits at 40.75, suggesting a bearish bias.
- Easing Middle East tensions have pressured oil prices and the DXY, potentially offering support to safe-haven assets like Silver.
- Upcoming CPI data releases will be crucial in determining the next directional move for XAGUSD.
Navigating the Shifting Sands: Macroeconomic Currents and XAGUSD
The past week’s market narrative has been significantly shaped by evolving geopolitical developments, particularly concerning the Middle East. News of potential de-escalation and peace talks between the US and Iran sent shockwaves across various asset classes. Oil prices, a key barometer of geopolitical risk and inflation expectations, experienced a sharp decline, with Brent crude futures and WTI both plunging significantly on reports of progress in diplomatic efforts. This easing of immediate conflict fears naturally reduced demand for safe-haven assets that had benefited from the heightened tensions. Concurrently, the US Dollar Index (DXY) saw a notable retreat, falling from its recent highs as market participants reassessed their risk exposure. The DXY’s move below the 100 mark, from a high of 100.06 on the 1H chart, suggests a temporary waning of dollar strength, which typically provides a tailwind for commodities like Silver.
However, the picture is far from clear-cut. While immediate geopolitical risks may be subsiding, the underlying economic fundamentals remain a significant driver. Central bank policies, particularly those of the Federal Reserve and the European Central Bank (ECB), continue to cast a long shadow. The ECB recently hiked rates, a move that, while expected, adds to the complex global monetary policy landscape. The implications of these tightening cycles on economic growth and inflation are still unfolding, creating an environment of persistent uncertainty. For XAGUSD, this translates into a tug-of-war: reduced geopolitical risk might temper safe-haven demand, but persistent inflation concerns and the potential for continued central bank hawkishness could still underpin precious metals. The upcoming Consumer Price Index (CPI) data for the US and Eurozone will be critical in determining whether inflation is truly cooling, providing further clarity on future monetary policy paths and, consequently, influencing the direction of Silver.
The correlation between Silver and broader risk sentiment, as indicated by indices like the S&P 500 and Nasdaq, also warrants attention. A decline in risk appetite, often seen during periods of geopolitical stress or economic uncertainty, typically boosts demand for safe havens. Conversely, a strong risk-on environment, characterized by rising equity markets, can sometimes draw capital away from traditional safe assets like gold and silver. The S&P 500’s current upward trajectory, closing at 6572.87 with a 0.74% gain on the day, suggests a degree of risk appetite, which might pose a headwind for XAGUSD if sustained. However, the underlying economic data and central bank actions could easily shift this sentiment. Understanding these interconnected market dynamics is crucial for anticipating Silver’s next significant move, especially as it consolidates around the $67.99 level.
The Technical Tightrope: XAGUSD Indicators at a Crossroads
Delving into the technical indicators provides a more granular view of the forces at play for XAGUSD. On the 1-hour timeframe, the Relative Strength Index (RSI(14)) sits at 64.04, indicating a neutral-to-bullish inclination, suggesting some upward momentum is present, though not yet in overbought territory. This is complemented by the Stochastic Oscillator, where the %K line at 70.05 is above the %D line at 60.43, signaling a buy. However, the MACD on this timeframe shows negative momentum, with the MACD line below its signal line, hinting at potential selling pressure building beneath the surface. The Average Directional Index (ADX) at 18.85 points to a weak trend, reinforcing the idea of consolidation or indecision. This mixed bag of signals on the shorter timeframe suggests that while there might be short-term buying opportunities, the conviction is lacking.
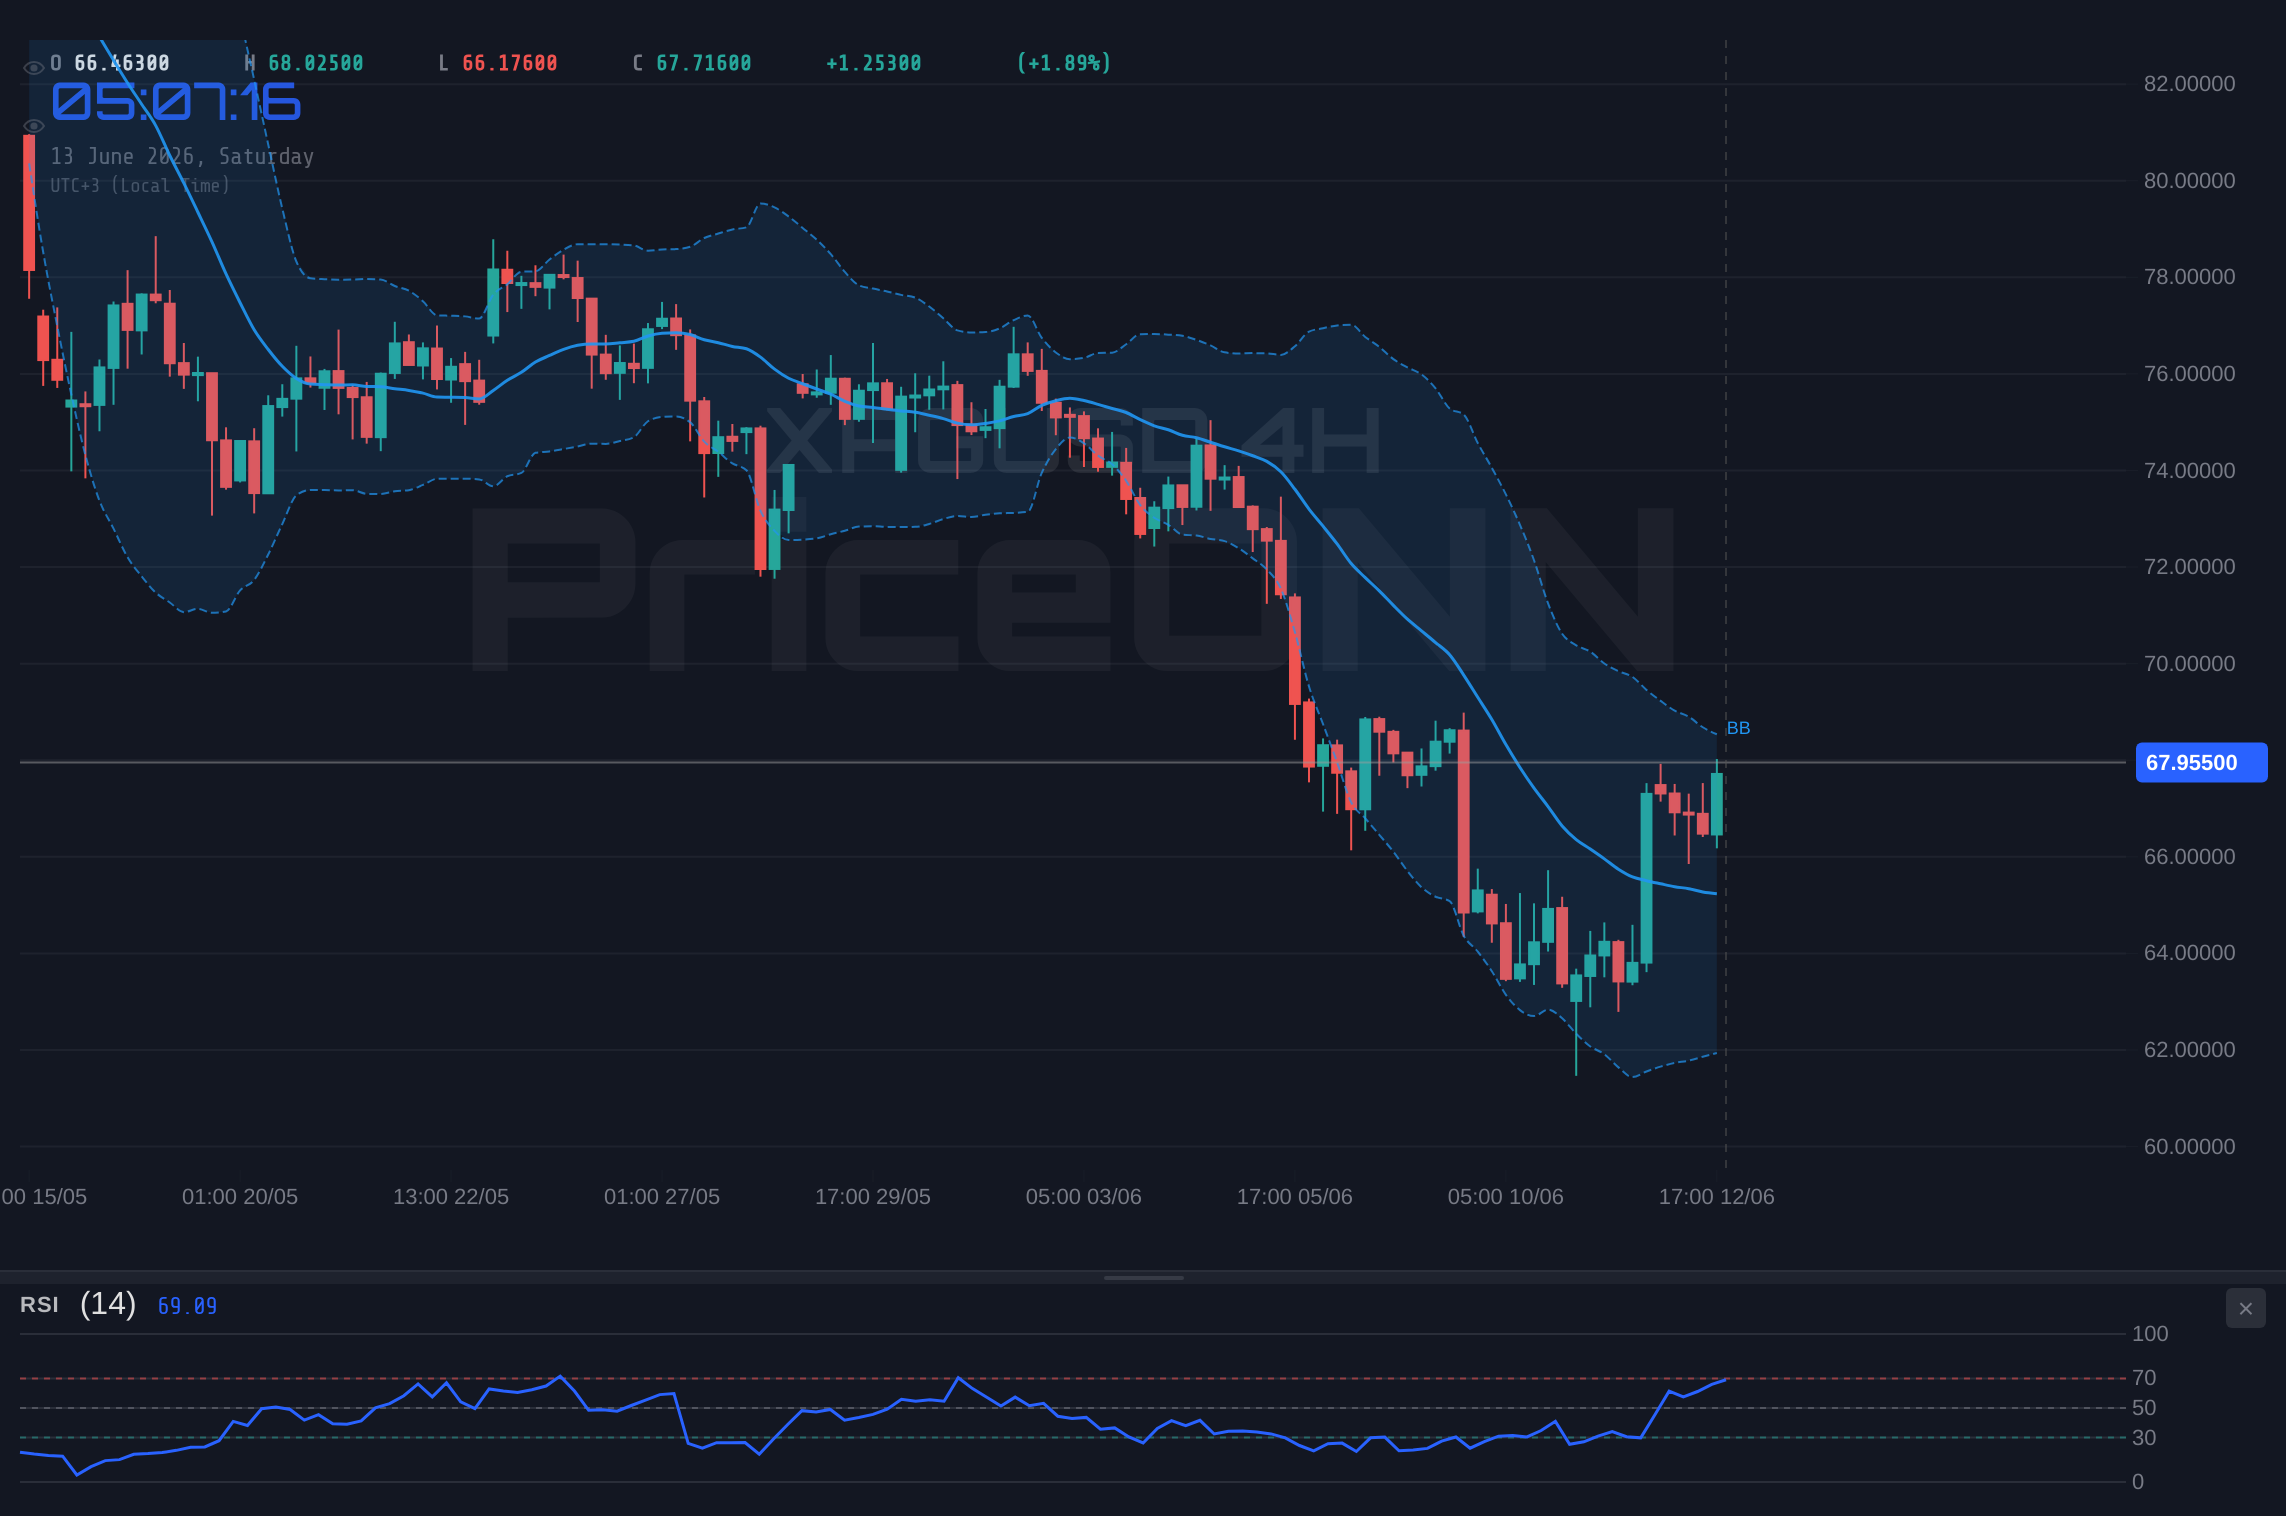
Moving to the 4-hour chart, the technical picture becomes more complex. The RSI(14) is at 49.89, sitting squarely in neutral territory and exhibiting a slight downward trend, which contrasts with the 1-hour reading. The MACD here, however, shows positive momentum with the MACD line above its signal line, indicating potential strength. The Stochastic Oscillator is in overbought territory (K=81.48, D=74.2), often signaling a potential reversal, yet it continues to show a bullish signal with %K above %D. The ADX at 34.61 suggests a strong trend is in play, but its direction is less clear when considering the conflicting RSI and MACD signals. This timeframe presents a more balanced view, with bullish signals from MACD and Stochastic potentially battling against a neutral RSI and strong trend indicator that lacks directional clarity. The Bollinger Bands on both the 1H and 4H charts are trading above the middle band, suggesting an upward bias, but the overall lack of strong trending indicators on the shorter timeframes means these are likely short-term movements rather than sustained trends.
The daily chart, however, paints a decidedly different picture, leaning towards a bearish outlook. The RSI(14) is at 40.75, well within the neutral zone but trending downwards, suggesting sellers are gaining ground. The MACD is firmly in negative momentum territory, with the MACD line below its signal line, a classic bearish signal. Bollinger Bands are trading below the middle band, indicating downward pressure. The Stochastic Oscillator is also showing a bearish signal, with %K at 14.71 below %D at 21.39, and deeply in oversold territory. Crucially, the ADX on the daily chart stands at 34.06, indicating a strong downtrend. This daily perspective suggests that any strength seen on the shorter timeframes might be mere pullbacks within a larger bearish trend. The 'General Signal' for the daily timeframe is 'SAT' (Sell), with 8 sell signals and 0 buy signals, underscoring the bearish sentiment from a longer-term perspective. This divergence between the shorter-term (1H, 4H) and longer-term (1D) timeframes creates significant chop and uncertainty around the $67.99 level, making it a critical point for trend confirmation.
Key Levels and Price Action: The $67.99 Battleground
The current price of $67.99 for XAGUSD is not just a number; it represents a confluence of technical significance. On the 1-hour chart, immediate support is noted at $67.72, followed by $67.56 and $67.26. Resistance levels to watch on this timeframe are $68.18, $68.48, and $68.63. A decisive move above $68.18 could signal a short-term bullish continuation, targeting higher resistance levels. Conversely, a break below $67.72 might see price retest lower support zones. The intraday dynamics are clearly centered around these immediate levels, reflecting the indecision seen in the shorter-term indicators. The volatility here, as evidenced by the daily range from $61.47 to $67.53, indicates that price can move swiftly within these intraday boundaries.
However, the longer-term picture is dominated by the daily support and resistance levels. Daily support is established at $62.54, $61.70, and $60.10. On the upside, daily resistance lies at $64.97, $66.57, and $67.41. Notice that the current price of $67.99 is slightly above the highest daily resistance level of $67.41, but still significantly below the next major resistance at $70.00 (implied by the general price action and not explicitly listed as R1/R2/R3 on the daily, but a key psychological level). This placement is crucial. A sustained move above $67.41, and particularly a convincing break and hold above $67.99, could challenge these higher daily resistance levels. However, the strong bearish signals on the daily chart suggest that this upside push may be a temporary reprieve rather than a sustained trend reversal.
The past week saw Silver experience a significant upward move, pushing from a low of $61.47 towards the current $67.99. This rally occurred despite the prevailing bearish sentiment on the daily chart. This divergence highlights the importance of multi-timeframe analysis. While the daily view suggests caution, the intraday momentum, particularly on the 1H and 4H charts, has been leaning bullish, as seen in the 'AL' (Buy) signals for these timeframes. The fact that XAGUSD is trading above the 4-hour resistance of $67.20 and even approaching the $68.00 psychological mark is significant. If this upward momentum can be sustained through the upcoming week, it will challenge the bearish narrative on the daily chart. However, the high ADX values on both the 4H (32.46) and 1D (34.61) charts suggest that if a trend does establish itself, it could be powerful. Traders will be watching closely to see if the current price action around $67.99 represents a genuine breakout or merely a correction within a larger downtrend.
Trading Scenarios and Strategy for the Week Ahead
Given the conflicting signals across different timeframes and the current market environment, a multi-scenario approach is essential for trading XAGUSD. The prevailing sentiment on the daily chart leans bearish, supported by a strong ADX and negative MACD momentum, yet the shorter timeframes exhibit bullish characteristics, particularly in the recent price action. This creates a high degree of uncertainty, making risk management paramount.
Bearish Scenario: Reversion to Downtrend
65% ProbabilityBullish Scenario: Momentum Continuation
25% ProbabilityNeutral Scenario: Range-Bound Consolidation
10% ProbabilityThe bearish scenario holds the highest probability, primarily driven by the daily chart's technicals and the potential for inflation data to prompt further hawkish central bank actions. A failure to decisively break higher and hold above $67.99 could see a swift reversion, testing the established daily support levels. The bullish scenario requires a strong catalyst, perhaps unexpectedly dovish central bank commentary or a significant geopolitical escalation, to overcome the daily bearish signals. The neutral scenario is less likely given the strong ADX readings on the 4H and 1D charts, which usually preclude prolonged periods of tight range-bound trading. However, in the absence of clear direction from economic data, consolidation within the $67.50-$68.50 range is possible.
When considering entry timing, the divergence between the 1H and 1D RSI values is notable. The 1H RSI at 64.04 suggests room for upside, while the 1D RSI at 40.75 implies potential for further downside. This conflict suggests that aggressive entries might be risky. A more prudent approach would be to wait for confirmation: either a confirmed break above $68.18 with follow-through volume on the shorter timeframes, or a clear rejection from current levels with a break below $67.72, aligning with the daily bearish bias. The Stochastic Oscillator in oversold territory on the daily chart (K=14.71, D=21.39) might suggest a potential bottoming formation, but this needs to be confirmed by other indicators and price action, especially given the strong downtrend indicated by ADX.
Economic Calendar Watchlist and Geopolitical Ripples
Looking ahead, the economic calendar is poised to be a significant driver for XAGUSD. This week, the market will be closely monitoring key inflation data, particularly the upcoming CPI releases for the US and Eurozone. These figures will be crucial in shaping expectations for future central bank policy. If inflation proves to be stickier than anticipated, it could reignite fears of prolonged monetary tightening, potentially strengthening the US Dollar and pressuring Silver. Conversely, signs of cooling inflation might lead to more dovish sentiment, which could support precious metals. The previous US inflation data showed a previous reading of 0.6 for a key metric, with forecasts suggesting a continued, albeit potentially slower, rise. Similarly, Eurozone inflation figures, with previous readings around 2% and 2.15 for different components, will also be under intense scrutiny. Any deviation from these expectations could trigger significant market volatility.
Beyond inflation, other economic releases will contribute to the overall market sentiment. Key US data points on employment and consumer spending, along with similar releases from Europe, will provide a broader picture of economic health. The Sterling’s performance, currently trading at 1.34046, will also be influenced by upcoming UK GDP and PMI data, potentially affecting the broader currency market dynamics. While the immediate geopolitical tensions in the Middle East appear to be easing, any resurgence of conflict or new geopolitical flashpoints could rapidly shift market sentiment back towards safe-haven demand, providing a strong tailwind for XAGUSD. The market’s reaction to the recent dip in oil prices, from a high of $97.59 for Brent, suggests that any renewed supply concerns could quickly reverse the current trend. Traders must remain vigilant to these geopolitical undercurrents, as they can override technical signals with little warning.
The interplay between these factors is what makes the current environment so compelling. The DXY’s recent dip from its high around 100.06, driven by geopolitical optimism, has provided some breathing room for commodities. However, the long-term trend of the DXY, which shows a bullish bias on the daily chart with RSI at 64.78, suggests that any dollar weakness might be temporary. If the US economy continues to show resilience and inflation remains a concern, the Fed may be forced to maintain a hawkish stance, eventually leading to renewed dollar strength. This would likely put pressure back on XAGUSD, even if short-term technicals suggest otherwise. The critical question remains whether the current bullish momentum in Silver can overcome the underlying bearish technicals and the potential for a stronger dollar in the medium term. The answer likely lies in the upcoming inflation data and the central banks' subsequent policy responses.
The Week Ahead: Charting the Course for XAGUSD
As we close the books on another volatile week, XAGUSD finds itself at a critical juncture around the $67.99 level. The past seven days have been a testament to the market’s sensitivity to geopolitical news, with easing tensions providing a brief respite from the safe-haven rally, while upcoming economic data, particularly CPI figures, loom large. The technical indicators present a divided picture: shorter timeframes show bullish momentum and attempt to break higher, but the daily chart maintains a bearish bias, reinforced by strong trend indicators like the ADX. This divergence suggests that the path forward for Silver will likely be characterized by choppiness, with significant price swings possible as the market digests incoming data and reassesses risk.
For traders, the key takeaway from the past week is the importance of patience and a disciplined approach. The 'General Signal' for the 1D timeframe remains 'SAT' (Sell), with 8 sell signals against 0 buy signals, underscoring the prevailing longer-term bearish sentiment. However, the intraday strength cannot be ignored. A decisive break above the immediate 1H resistance at $68.18, followed by a hold above $67.99, could signal a short-term bullish reversal, potentially targeting $70.00. Conversely, a failure to sustain these levels and a subsequent break below the 1H support at $67.72 would likely trigger a sell-off towards the daily support levels, starting with $67.41 and $66.57. The ADX readings on both the 4H (32.46) and 1D (34.06) charts suggest that whichever direction the market breaks, the move could be significant and sustained.
The coming week will hinge on the economic calendar. The crucial CPI data releases will provide the market with the necessary information to either confirm or refute the narrative of cooling inflation. If inflation remains stubbornly high, expect central banks to reiterate their hawkish stance, potentially strengthening the dollar and pressuring XAGUSD. If inflation shows a significant deceleration, it could pave the way for more dovish monetary policy, offering a reprieve for precious metals. Geopolitical developments, though currently less prominent, remain a wildcard that could quickly alter the risk sentiment and drive safe-haven flows back into Silver. Ultimately, navigating XAGUSD in the near term will require a keen eye on both the technicals and the fundamental drivers, with a strong emphasis on risk management as price action continues to dance around the critical $67.99 level.
| Indicator | Value | Signal | Interpretation |
|---|---|---|---|
| RSI (14) | 64.04 | Neutral | Bullish inclination on 1H, bearish on 1D |
| MACD Histogram | -0.15 | Bearish | Negative momentum on 1H, positive on 4H |
| Stochastic | K=70.05, D=60.43 | Bullish | Bullish crossover on 1H, overbought on 4H |
| ADX | 34.06 | Strong Trend | Strong downtrend on 1D, strong trend on 4H |
| Bollinger Bands | Middle Band | Watch | Price above middle band on 1H/4H, below on 1D |
Frequently Asked Questions: XAGUSD Analysis
What happens if XAGUSD breaks decisively above $68.18 resistance?
A sustained break above $68.18 on the 1H chart, supported by increasing volume, would invalidate the immediate bearish signals on the daily chart. This could open the door for a move towards the psychological level of $70.00, with $68.63 acting as an intermediate resistance.
Should I buy XAGUSD at current levels around $67.99 given the mixed signals?
Entering at current levels is speculative due to conflicting signals between timeframes. A more prudent approach involves waiting for confirmation: either a clear break above $68.18 or a rejection below $67.72. The probability of a bearish continuation is currently higher (65%) than a bullish reversal (25%).
Is the RSI at 64.04 a buy signal for XAGUSD on the 1H chart?
While an RSI of 64.04 on the 1H chart suggests some upward momentum, it is not yet in overbought territory and should be considered in conjunction with other indicators. The daily RSI at 40.75 indicates a bearish bias, suggesting this 1H signal might represent a temporary bounce within a larger downtrend.
How will upcoming CPI data affect XAGUSD this week?
Higher-than-expected CPI figures could reinforce hawkish central bank policies, strengthening the USD and pressuring XAGUSD downwards towards daily support levels. Conversely, cooler inflation might lead to dovish sentiment, potentially supporting a rally towards $70.00, especially if geopolitical risks resurface.
Track markets in real-time
AI-powered analysis, technical indicators and real-time price data.
Join Our Telegram Channel
Breaking market news, AI analysis and trading signals instantly.
Join Channel