Time Horizon: This analysis covers intraday through swing trading perspectives across 1H, 4H, and Daily timeframes.
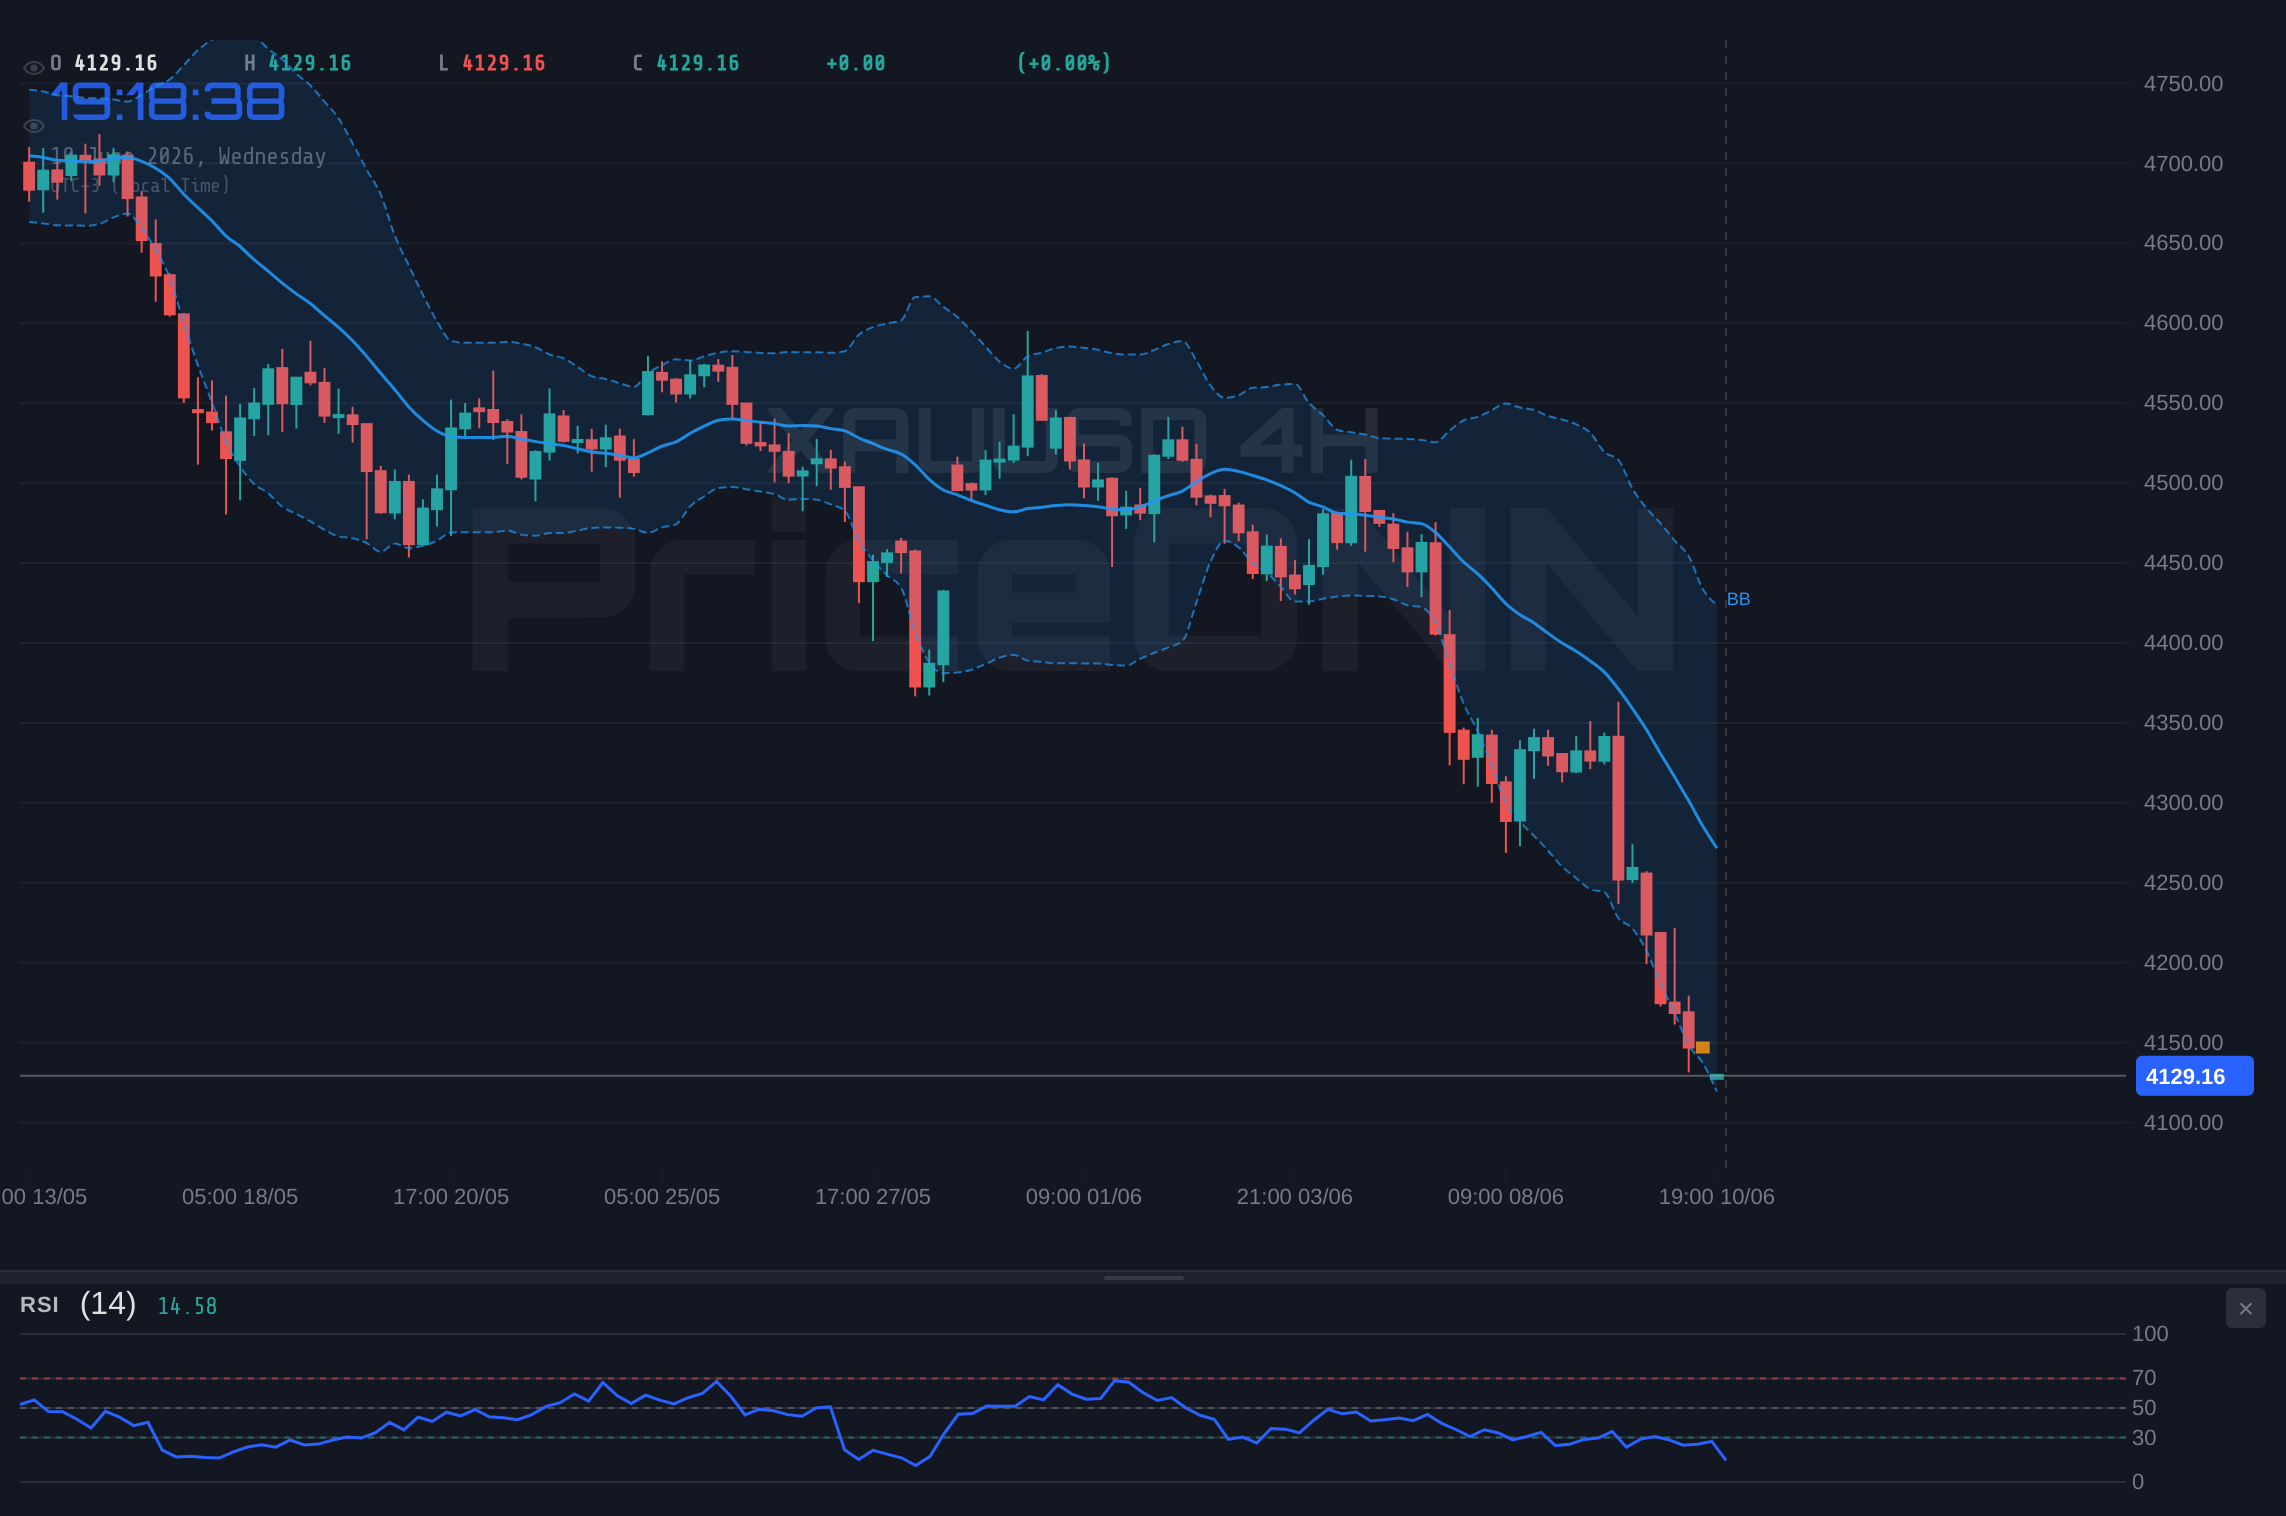
When the Bureau of Labor Statistics confirmed on Wednesday that US headline inflation climbed to a three-year high in May, gold markets did not wait for the dust to settle. The precious metal shed close to $200 in a single session - a brutal 4.62% collapse that dragged XAUUSD to $4,129.75 and obliterated every significant support level on the daily chart. XAUUSD today analysis tells a story of forced selling, macro repricing, and a market now sitting in deeply oversold territory. The question is not whether this selloff was justified - it clearly was. The real question is whether gold has found its floor, or whether there is more pain ahead.
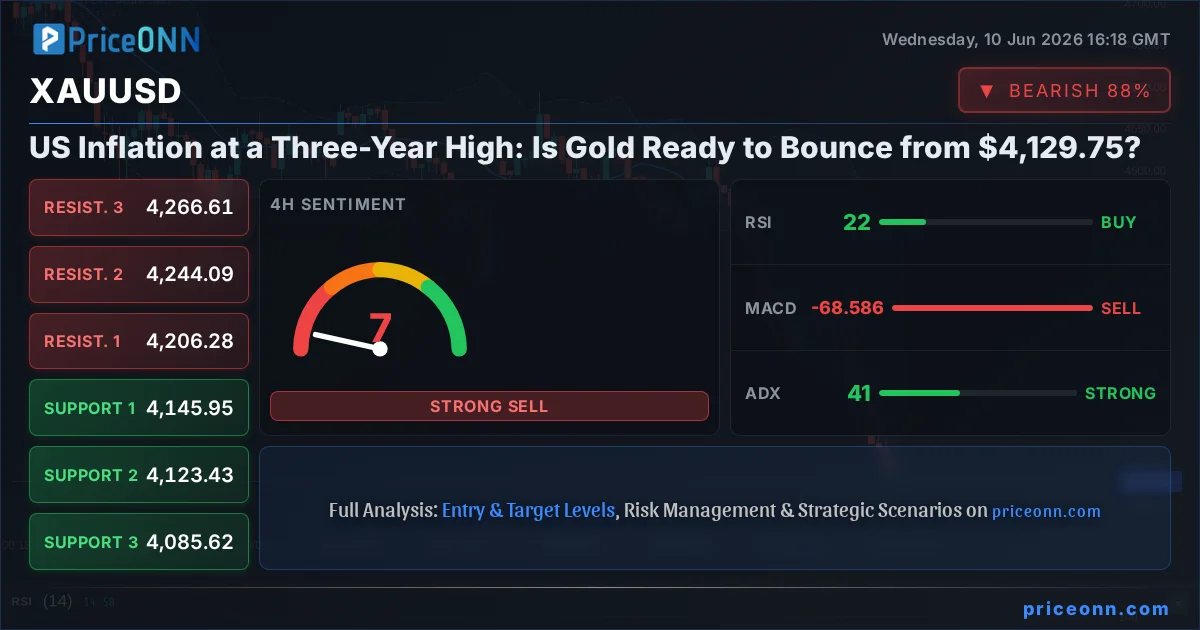
- XAUUSD collapsed 4.62% to $4,129.75 after US May CPI rose 0.5% m/m, hitting a three-year high and reinforcing a hawkish Federal Reserve narrative.
- 4H RSI at 21.5 and daily RSI at 26.34 signal deeply oversold conditions - but ADX at 40.83 on the 4H confirms the bearish trend is dominant and intact.
- Gold has broken below all three daily support levels (4,196.59, 4,232.59, and 4,281.11), leaving the 1H support at $4,101.56 as the next critical structural line.
- With DXY holding near 99.65 and SP500 gaining 0.74% to 6,572.87, safe-haven flows are not rushing back to gold - the macro environment remains hostile for the near term.
When Inflation Wins, Gold Loses - Except When It Does Not
There is a persistent myth in financial markets that gold always rises when inflation rises. That narrative plays out over decades - but in the shorter run, what drives gold is not inflation itself but the Federal Reserve's response to it. And Wednesday's CPI print just handed the Fed every reason to stay hawkish.
The Consumer Price Index rose 0.5% month-on-month in May, matching the Bloomberg consensus forecast but confirming what markets had been fearing: inflation is not cooling on schedule. On a year-over-year basis, this represents a three-year high - a level that all but eliminates any near-term case for Fed rate cuts. According to coverage from Bloomberg and Reuters this morning, the data lands just as multiple central bank meetings are approaching in the calendar, with inflation releases from the US, Norway, and Denmark all taking center stage simultaneously.
Here is the mechanism that drove gold lower today. When CPI confirms elevated levels, real interest rates - the nominal Fed Funds Rate adjusted for inflation expectations - remain restrictive. High real rates increase the opportunity cost of holding gold, which generates no yield. Institutional money rotates out of non-yielding assets and into Treasuries. The dollar strengthens relative to yield-bearing alternatives. And gold, denominated in dollars, faces a double headwind: rising opportunity cost and a stronger currency working against it in tandem.
Today, that mechanism played out in real time. Gold had been trading between 4,236 and 4,363 in the earlier part of the Wednesday session. After the CPI release hit screens, the precious metal cratered in a directional, high-conviction move - eventually landing at $4,129.75 by the afternoon session. The selloff was clean, sustained, and carried by genuine macro conviction, not noise or thin liquidity.
What DXY at 99.65 Reveals About Gold's Next Move
The Dollar Index is sitting at 99.65 with a daily decline of just 0.07%, and this is one of the more interesting data points in the session. If today's hot inflation print was fully interpreted as a dollar-bullish catalyst, DXY should have surged aggressively. Instead it moved only marginally, suggesting that markets have already priced in a significant portion of the hawkish Fed narrative - or that competing currency dynamics are capping dollar upside at current levels.
For XAUUSD support and resistance analysis, this DXY behavior matters considerably. A dollar index that fails to push convincingly above 100 could provide a technical floor for gold sooner than pure bear momentum would suggest. The 1D chart for DXY shows an RSI at 62.38 with positive daily bias and an ADX at 23.43, indicating moderate upside potential - but 99.65 is not yet confirming the kind of breakout that would signal a sustained second leg lower for gold.
Meanwhile, the SP500 gained 0.74% to 6,572.87, which deserves attention. Risk assets rallying while gold sells off reflects a specific macro narrative: institutional money is not fleeing to safe havens - it is rotating toward equities on the view that strong economic data supports corporate earnings even if it delays rate cuts. This context reinforces the argument that gold's selloff is driven by rising rate expectations, not by genuine systemic risk aversion. Paradoxically, that characteristic makes the move more likely to be reversible once rate expectations stabilize around a new equilibrium.
Bank of Canada held its policy rate at 2.25% earlier today, noting that maintaining the current setting balances competing risks from oil prices and trade uncertainty. The BoC's cautious tone is a reminder that central banks globally are still in a data-dependent, wait-and-see mode that leaves little room for the kind of dovish pivot that would send gold sharply higher.
Bears Are in Charge - But Stretched Across Every Timeframe
The XAUUSD multi-timeframe analysis reveals a picture that is more nuanced than a simple sell-everything signal, and understanding this nuance is exactly what separates disciplined traders from those who chase momentum at the worst possible moments.
On the 1-hour chart, the trend is unambiguously bearish with 100% strength reading. The ADX at 43.38 is a strong-trend signal - when ADX climbs this high on the 1H, it means the directional move is not a quick spike but a sustained, institutional-driven flow. Mean-reversion plays in environments like this tend to fail unless a genuine catalyst emerges to shift the macro narrative. That catalyst - a dovish Fed signal, cooling secondary inflation data, or a risk-off event - is simply not present in today's session.
However, look at the Stochastic on the 1H: K at 27.53 has crossed above D at 20.89. That is a bullish divergence signal on the oscillator - a tiny flicker suggesting that hourly selling pressure is beginning to show the earliest signs of exhaustion. On its own, this is not a buy signal. In the context of a 43.38 ADX reading, it is a caution flag for bears, nothing more.
Step up to the 4-hour chart and the story becomes more compelling for contrarian thinking. RSI on the 4H sits at 21.5 - deep inside oversold territory. Historically, when gold's 4H RSI dips to these levels after the macro catalyst is already fully digested, the risk/reward for initiating new short positions deteriorates rapidly. The Bollinger Bands on the 4H show price below the lower band - a condition that signals either a clean breakdown or an oversold extreme depending on what comes next from the fundamental side.
The daily timeframe confirms the bear case in terms of medium-term direction but raises the oversold flag most loudly. Daily RSI at 26.34 is rare territory for gold. The daily MACD remains negative, and the Stochastic at K=8.1 with D=34.62 confirms persistent downward momentum that has not found a natural anchor yet. The daily ADX at 30.15 shows a strong trend - not at the extreme readings of the shorter timeframes, suggesting the daily trend may continue but potentially at a slower, more grinding pace from here.
Oversold does not mean reversal is imminent. With daily RSI at 26.34 and ADX at 30.15, gold is both deeply oversold AND in a confirmed strong trend. Catching falling knives in dominant downtrends is one of the most common and costly mistakes traders make. Wait for price-action confirmation before assuming any bounce is sustainable.
The Floor Gold Needs to Hold at $4,101
With all three daily support levels - 4,196.59, 4,232.59, and 4,281.11 - now sitting above the current price as overhead resistance, the market has effectively reset its structural roadmap from scratch. These former daily supports now represent trapped longs who bought higher and will look to exit or hedge on any recovery attempt, creating natural supply that will cap bounces.
The next critical support for XAUUSD sits at $4,101.56 on the 1H chart. This is the S1 level that needs to hold for any meaningful bounce attempt to develop. A clean close below this level - particularly on sustained volume - would signal that sellers remain in full control and are not yet finished with this leg lower.
Below $4,101.56, the next structural support comes in at $4,078.44, followed by $4,038.89. A break below $4,038 would represent approximately 2.2% of additional downside from current levels and would likely trigger a fresh wave of momentum selling from algorithmic systems that monitor these pivot levels with precision.
On the upside, gold faces immediate resistance at $4,164.23 (1H R1). This is the first key level bulls need to reclaim to even begin talking about recovery. The former daily support at 4,196.59 now sits close to the 1H R2 at $4,203.78 and the 1H R3 at $4,226.90, creating a dense resistance cluster between those levels that will not be easy to pierce without a genuine shift in the macro narrative.
How Bad Is Today's Damage; A Snapshot
Three Scenarios for XAUUSD from $4,129
Given the collision between a dominant bearish trend and deeply oversold readings, three distinct price paths exist from here. The following XAUUSD market sentiment scenarios carry probability weightings based on the combined technical and fundamental picture.
The Inflation Hammer Keeps Falling
60% ProbabilityDigestion and Range Compression
25% ProbabilityOversold RSI Fires a Mean Reversion Bounce
15% ProbabilityWhat Every Trader Type Should Watch Right Now
The XAUUSD trading signals picture looks different depending on your time horizon, and this distinction is worth being explicit about rather than offering a one-size-fits-all view.
Scalpers and intraday traders operating on the 1H chart face a sell-the-rally environment until further notice. Any attempted bounce toward $4,164.23 should be treated with suspicion while the ADX holds above 40. The hourly Stochastic crossover at K=27.53 above D=20.89 may offer brief long scalp opportunities, but these are countertrend trades in a dominant downtrend - tight stops and quick exits are not optional. The moment a scalper gets emotionally attached to a long in this environment, the ADX will remind them why they should not be.
Swing traders operating on the 4H frame face a genuine dilemma today. The RSI at 21.5 is the kind of reading that has historically preceded multi-day bounces in gold. However, swing entries against a 95% strength bearish trend with ADX at 40.83 are high-risk propositions that require exceptional timing. The safest play for swing traders is to wait for a confirmed 4H close above the resistance at $4,164.23 before initiating any long with conviction - and even then, to keep initial position sizes modest given the macro backdrop.
Long-term investors and position traders are seeing something distinctly different from their longer vantage point. The daily RSI at 26.34 places gold in the most oversold territory it has occupied in a significant period. The daily Bollinger Bands show price below the lower band - a condition that rarely sustains for more than a few sessions before at minimum a technical rebound of some magnitude occurs. For longer-term holders, this zone may represent a level worth monitoring for staged accumulation - but only with the explicit understanding that further downside toward $4,038.89 remains firmly on the table, and position sizing should reflect that uncertainty.
The most dangerous trade right now is a premature long. RSI is screaming oversold across multiple timeframes. But ADX at 40.83 on the 4H is screaming respect the trend. The professional approach waits for the ADX to roll over below 35 before seriously playing the RSI signal. Until then, this is a market that charges tuition from the impatient.
Gold's Inflation Paradox; Why the Rate Mechanism Overrides the Hedge Narrative
It is worth stepping back to understand why gold falls on a hot inflation print when conventional wisdom says it should rise. The answer lies in the real interest rate framework that has dominated gold pricing in recent years.
When nominal rates rise faster than inflation expectations, real rates push higher. Gold, with no yield, becomes less attractive relative to Treasuries. This relationship was demonstrated powerfully during the aggressive rate hike cycles of recent years: as central banks raised rates sharply from near zero, gold moved broadly sideways or lower even as inflation ran at elevated levels. The market was telling a clear story - nominal rate increases exceeded inflation's own rise, making real rates increasingly positive and structurally unfavorable for non-yielding assets.
Today's CPI print at a three-year high lands in a context where the market had been cautiously pricing in the possibility of rate easing later in 2026. That hope has now been significantly weakened. Bloomberg's coverage of the release noted the 0.5% monthly gain meets consensus, but the year-over-year three-year high reading does not give the Fed any political or economic runway to cut rates in the near term. The XAUUSD key levels analysis must therefore account not just for price technicals but for this fundamental repricing of the rate timeline.
Traders who have been following gold closely will also note that this selloff accelerated through prior zones of buying interest without pause - a sign that institutional stop-loss orders were being triggered and that the move carried significant forced liquidation alongside directional selling. When a market moves this cleanly through technical levels on a macro catalyst, the trend tends to find its natural equilibrium only after the initial panic flow fully washes out.
Frequently Asked Questions: XAUUSD Analysis
What happens if XAUUSD breaks below the $4,101.56 support level?
A confirmed break below $4,101.56 (the 1H S1 support level) would open the path to the next structural cluster at $4,078.44 and $4,038.89. Given the ADX at 40.83 confirming a dominant bearish trend, such a break on volume would likely attract algorithmic momentum sellers and could result in a relatively swift extension toward those deeper levels without much meaningful support in between.
Should traders buy gold at $4,129.75 given the 4H RSI sitting at 21.5?
While a 4H RSI of 21.5 represents deep oversold territory that has historically preceded bounces, the ADX at 40.83 signals a dominant trend that oversold indicators frequently fail to reverse quickly. The safer approach is to wait for a confirmed hourly close above $4,164.23 (1H R1) before initiating long positions - this provides price-action confirmation that selling pressure is genuinely exhausting rather than simply pausing before another leg lower.
Is the daily RSI at 26.34 a reliable buy signal for gold right now?
Daily RSI at 26.34 marks rare oversold territory that has historically been associated with at least short-term reversal zones for gold. However, with the daily ADX at 30.15 confirming a strong ongoing trend, oversold conditions can persist longer than expected. The RSI signal becomes more actionable when combined with a price confirmation - specifically a close back above the 1H resistance at $4,164.23 - which would indicate that sellers are losing control rather than just taking a breath.
How will the US three-year high CPI data affect gold's trajectory this week?
Today's 0.5% m/m CPI print reaching a three-year high has sharply repriced Fed rate cut expectations lower, maintaining the hawkish rate narrative that structurally pressures gold in the near term. Unless upcoming Fed communication softens - or secondary data such as consumer confidence or labor market figures weakens unexpectedly - the bias remains bearish toward $4,038.89, with any technical bounce toward $4,164 to $4,203 likely to encounter selling from trapped longs seeking to exit.
Volatility creates opportunity - but only for traders who respect what the trend is saying and wait for the market to signal a genuine shift before acting. Gold at $4,129.75 is wounded, technically oversold on multiple timeframes, and confirmed in a dominant downtrend by ADX readings above 40 on both the 1H and 4H charts. The RSI and Bollinger signals say a bounce could arrive at any session; the ADX says that bounce should initially be treated as a selling opportunity until $4,164.23 is reclaimed with conviction. Patient traders who wait for that confirmation will be in a far stronger position than those chasing the first green candle off a deeply oversold floor. Manage risk, wait for the setup - the market always offers a second chance to those prepared to receive it.
Track markets in real-time
AI-powered analysis, technical indicators and real-time price data.
Join Our Telegram Channel
Breaking market news, AI analysis and trading signals instantly.
Join Channel