Something has shifted in the silver market today, and it demands attention. XAGUSD has dropped sharply to $65.22, shedding nearly 4% in a single session as metals traders take profits ahead of a potentially pivotal US CPI release. The 4-hour RSI has collapsed to 26.61, pushing into genuinely oversold territory. The 1-hour stochastic is firing a bullish crossover in deeply depressed conditions. But the ADX tells a competing story: at 33.02 on the 1-hour chart and 35.83 on the 4-hour chart, downtrend momentum remains substantial. That conflict between exhausted sellers and a trend not yet ready to reverse is exactly where the XAGUSD today analysis gets interesting.
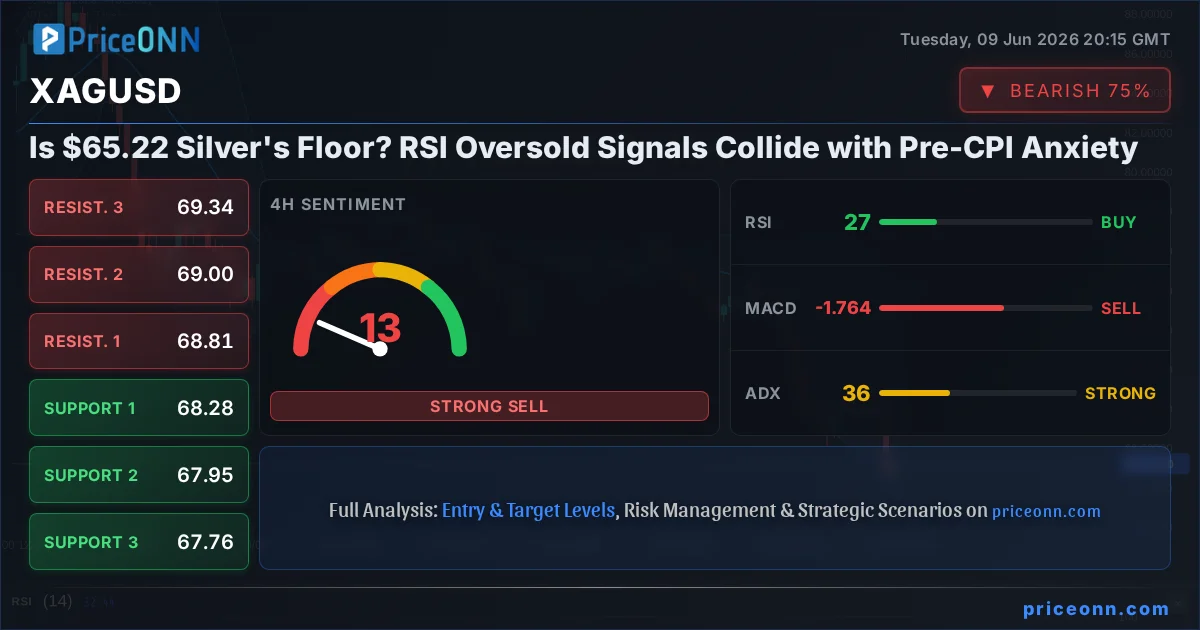
- XAGUSD is at $65.22, down 3.9% (-$2.65) on the session, with an intraday range of $66.14 to $68.90
- 4-hour RSI at 26.61 is well into oversold territory; 1-hour RSI at 30.61 confirms the same across timeframes
- ADX at 33.02 (1H) and 35.83 (4H) confirms the downtrend carries significant momentum, not mere drift
- US CPI data this week is the decisive macro catalyst: a hot print extends the sell-off, a soft read sparks a sharp short-covering rally from oversold levels
Time Horizon: This analysis covers the intraday to 5-day swing window, with reference to the broader daily structure for context.
When RSI Screams Oversold but the Trend Disagrees
The XAGUSD RSI signal right now is one of the sharpest oversold readings this pair has registered in recent sessions. A 4-hour RSI at 26.61 is not a minor dip below the 30 line; it is a genuinely depressed reading that suggests sellers have been relentless and the short-term move is stretched. When XAGUSD multi-timeframe RSI analysis shows sub-30 readings across both 1-hour and 4-hour simultaneously, the probability of a near-term technical bounce rises considerably. Markets rarely move in straight lines indefinitely.
But oversold markets can stay oversold far longer than most traders expect, especially when the trend carries real conviction. The ADX at 33.02 on the 1-hour chart is the critical counterweight here. ADX above 30 means the prevailing trend has genuine directional energy behind it. The 4-hour ADX at 35.83 reinforces this view: selling pressure is not fading; it has simply pushed price to a level where further immediate downside requires fresh catalysts to maintain momentum. Sellers need a new reason, not just inertia, to push lower from here.
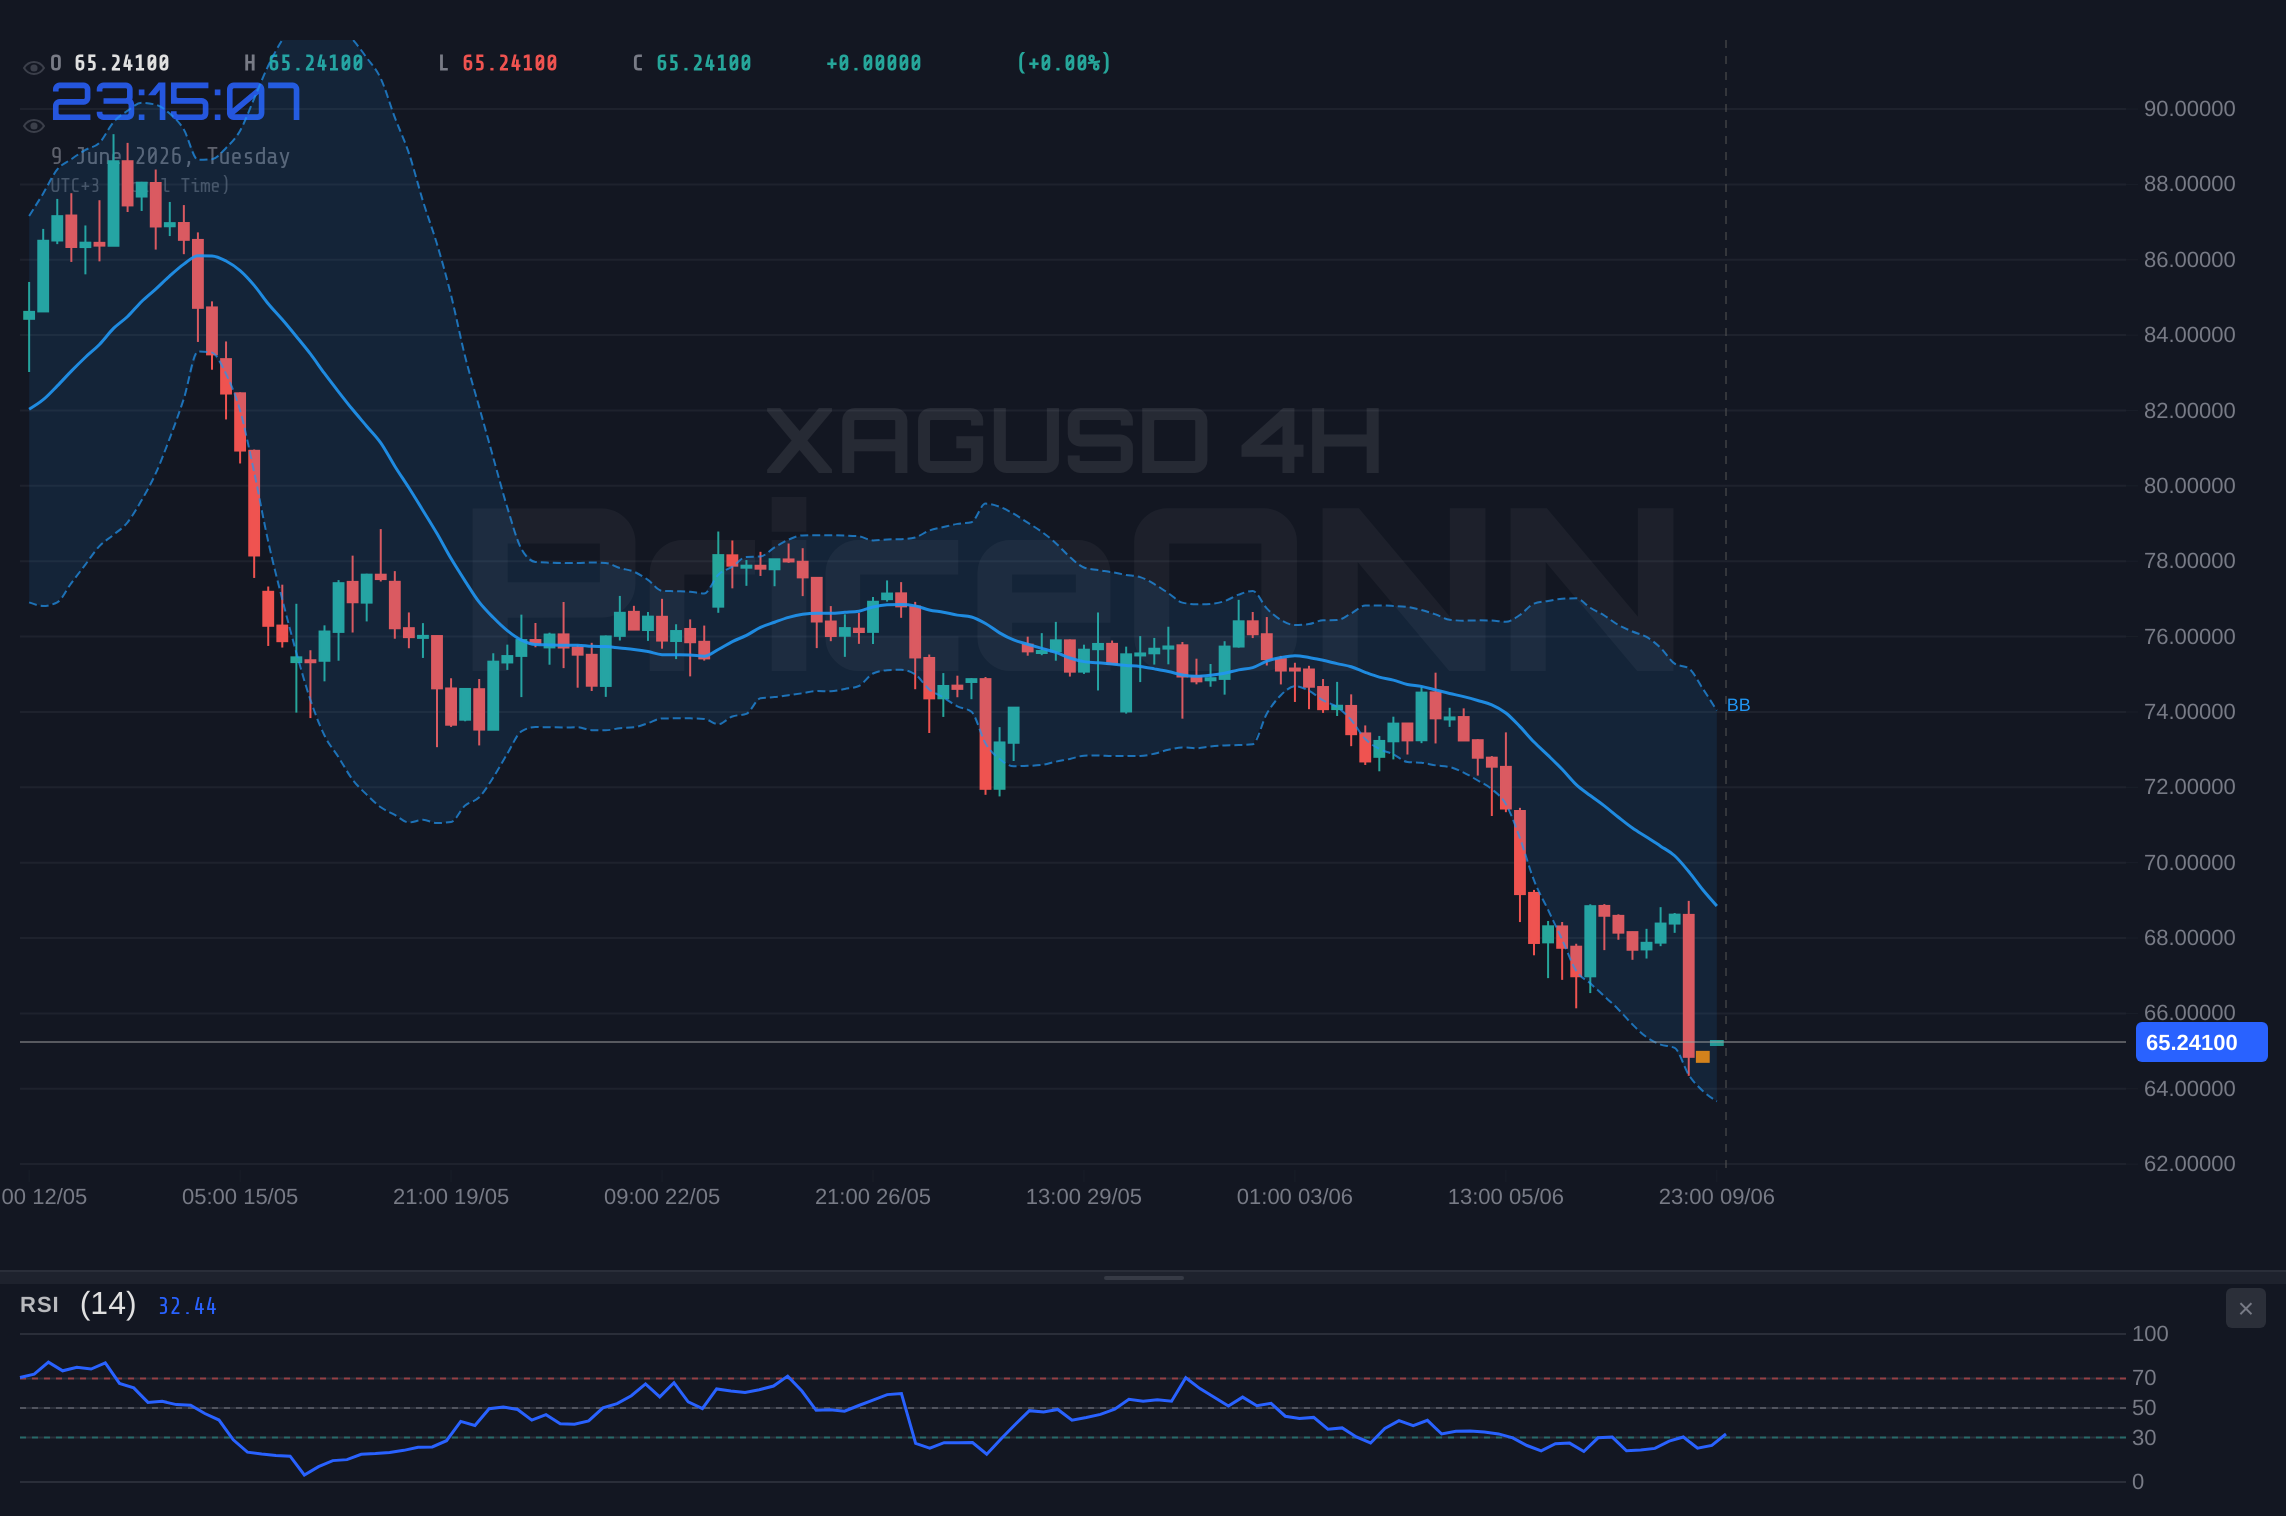
The MACD across all timeframes remains firmly negative, with the signal line above the histogram, pointing downward. The daily Bollinger Bands show price has sliced below the lower band, a configuration that typically indicates one of two things: extreme oversold exhaustion approaching a reversal, or a genuine breakdown into a new lower range. Until a higher timeframe close reverses the picture, the trend deserves the benefit of the doubt.
RSI oversold in a strong downtrend (ADX above 30) is not a buy signal in isolation. Silver needs a macro catalyst to reverse, not just technical exhaustion. Wait for price confirmation before acting against a trend of this strength.
The Macro Backdrop: NFP, CPI, and a Stubborn Fed
Silver's drop today did not happen in a vacuum. The broader metals selloff is being driven by a clear macro narrative: strong US labor market data has reinforced the Federal Reserve's case for keeping rates elevated, and markets are repricing assets accordingly. According to Reuters, the dollar gained fresh momentum after a robust non-farm payrolls report, with employment data reinforcing the Fed's ability to maintain restrictive policy. For silver, yield-bearing assets are the competition, and right now that competition is winning.
The DXY is holding near 99.71, down marginally on the session but structurally bullish at the daily level. The daily DXY trend shows 91% bullish strength, with the daily RSI at 63.62. That reading suggests the dollar has not reached overbought levels where it typically exhausts. If DXY pushes toward the 100.13 to 100.47 resistance zone, silver faces additional compression. Watch this level closely as a leading indicator for metals direction.
Gold (XAUUSD) has dropped 1.63% today to $4,257, pulling silver lower in sympathy. Silver's near-4% decline versus gold's 1.63% drop reveals the metal's higher beta in action: XAGUSD amplifies gold's moves in both directions. If gold finds structural support at current levels, silver is the higher-beta recovery play. If gold continues sliding, silver's selloff deepens disproportionately.
The upcoming US CPI release is the week's dominant catalyst. Bloomberg and Reuters coverage from Tuesday confirms that traders are actively repositioning ahead of the data. According to one report, markets showed "signs of stabilization but conviction remained notably absent as investors positioned cautiously" ahead of the inflation print. If CPI prints hot, Fed rate expectations firm further, the dollar rallies, and metals face another leg lower. If CPI surprises to the downside, the narrative flips fast and short-covering from oversold conditions can generate moves that look disproportionate to the fundamental shift.
The Bull's Roadmap Back Toward $65.89
For bulls, the setup is uncomfortable but not without technical merit. The argument starts with the RSI. A 4-hour reading of 26.61 is the kind of level that has historically preceded short-term bounces in silver, even in downtrending markets. The 1-hour stochastic has already fired a bullish crossover, with K at 20.98 crossing above D at 19.26 in deeply depressed territory. This is a short-term momentum signal suggesting selling pressure may be losing its immediate edge.
The bull's roadmap requires price to hold above the $65.20 support level (1H S1) as the initial base. A clear 4-hour candle close above $65.89 (1H R1) would be the first meaningful confirmation that buyers are stepping in with conviction. From there, the XAGUSD breakout sequence targets $66.14 (1H R2) and $66.58 (1H R3), representing a full recovery toward the session's opening range.
The macro trigger for this scenario is a softer-than-expected CPI reading. A CPI miss weakens the dollar narrative, releases pressure on all metals simultaneously, and forces short-covering from deeply oversold positions. Industrial demand adds a structural dimension to the bullish case: silver's role in solar panel manufacturing, electric vehicle components, and semiconductor production provides demand support that pure financial metals like gold do not always enjoy. Any evidence of global manufacturing resilience would reinforce this fundamental floor under the technical oversold setup.
A triple-oversold condition across 1H, 4H, and 1D RSI simultaneously in silver is relatively rare. While it does not guarantee a bounce, it does suggest the aggressive selling phase is approaching exhaustion. Patient traders watch for confirmation, not anticipation.
Where Bears Take the Wheel
The bearish continuation case carries the most technical weight right now. Every general signal across the 1-hour, 4-hour, and 1-day charts reads SELL. The 1-day trend strength is assessed at 99% bearish. The daily MACD is firmly negative across all timeframes. The daily Bollinger Bands confirm price has broken below the lower band, a configuration that often signals a genuine breakdown rather than a simple overshoot requiring immediate mean reversion.
The critical level for bears is the $65.20 support (1H S1), sitting just cents below the current $65.22 quote. A confirmed 1-hour close below this level would open the door to $64.76 (1H S2), and then $64.51 (1H S3) as momentum accelerates on stop-loss triggered selling. The daily chart's next meaningful support sits significantly lower at $63.28, representing a material step down from current levels if the daily breakdown gains traction.
The ADX readings are the bears' strongest structural ally. At 33.02 on the 1-hour chart, this is not a slow, leaderless drift. The downtrend has genuine energy. The daily stochastic at K=10.94, D=31.18 with a deeply bearish crossover (K well below D) confirms the daily timeframe has not yet established a floor. The XAGUSD price forecast under continued bearish conditions targets sub-$64.76 before any meaningful structural relief arrives.
The macro bear case: if this week's CPI data confirms persistent inflation, the Fed's restrictive stance is reinforced. DXY could challenge the 100 level, which historically creates significant headwinds for dollar-denominated commodities. WTI crude dropping 2.54% to $89.34 today adds complexity; falling oil reduces near-term inflation expectations, which paradoxically works against silver's inflation-hedge narrative even as the broader selloff in risk assets could theoretically support safe-haven demand.
The Consolidation Case: Stuck Between Key Levels
The third scenario is the most frustrating for directional traders. If CPI lands in line with consensus, silver could enter a period of directionless chop between $64.76 and $65.89, offering neither the continuation bears want nor the reversal bulls need. This neutral scenario carries approximately 15% probability, conditional on data that produces no new directional impulse.
The early warning indicator for this outcome is ADX direction. If the 1-hour ADX, currently at 33.02, begins declining toward the 20-25 range without a corresponding price move, it signals momentum is fading without a new catalyst arriving to replace it. The 4-hour stochastic's current position (K at 63.36 above D at 49.03) creates a short-term upward pull that, when set against the longer-term bearish trend and RSI, produces exactly the kind of internal technical tug-of-war that generates choppy, whipsaw price action. Tight stops and reduced sizing become the primary risk management tools in this environment.
Probability Assessment: Where the Edge Lies
Given the totality of the data, the bearish continuation scenario holds approximately 55% probability. The confluence of strong trend readings across multiple timeframes, a firmly negative MACD, the pre-CPI profit-taking narrative, and the broader macro backdrop of Fed rate hike expectations all favor continued downside pressure in the near term. The bullish bounce scenario carries roughly 30% probability, supported by extreme oversold RSI conditions and the potential for a CPI downside surprise. The neutral consolidation scenario holds approximately 15% probability.
Bears Hold the Line: Continuation Below $65.20
55% ProbabilityOversold RSI Fires Back: The Short-Cover Setup
30% ProbabilityWaiting for the CPI Catalyst: Pre-Data Range Play
15% ProbabilityWhat I Am Watching This Week
Three specific triggers will determine which scenario plays out in XAGUSD over the next five sessions. These are the levels and events that the XAGUSD market sentiment analysis flags as decisive.
First and most critical: the US CPI release. Multiple financial news sources from Tuesday confirm that markets are actively repositioning ahead of this data point. According to reporting from this week, "US CPI leads a high-stakes week as Fed rate hike expectations build." A CPI above consensus reinforces the dollar bull thesis and extends the metals selloff. A CPI miss creates the conditions for an oversold snap-back rally. This is the single event with the power to change silver's entire narrative in one session, overriding any technical setup on either side.
Second: DXY's behavior around 99.71 and whether it can sustain a push toward the 100.13 to 100.47 resistance zone. The daily DXY ADX at 22.48 indicates an established but not extreme uptrend. If dollar bulls fail to build on today's ground and DXY pulls back toward 99.17 to 99.36 support, metals find breathing room. Watch DXY price action as the leading macro indicator for XAGUSD direction throughout the week.
Third: gold's performance in the $4,253 to $4,265 support zone. Silver historically amplifies gold's moves. If XAUUSD stabilizes and builds a base near current levels, silver can follow and frequently outperforms on the recovery given its higher beta. If gold loses this support and slides toward $4,203, XAGUSD's $65.20 floor will be severely tested and likely broken with acceleration toward $64.76.
| Indicator | 1H Value | 4H Value | Signal | Interpretation |
|---|---|---|---|---|
| RSI (14) | 30.61 | 26.61 | Oversold | Multi-timeframe oversold: bounce potential elevated, but no reversal confirmed |
| MACD | Negative | Negative | Sell | Momentum firmly bearish across all timeframes; signal line above histogram |
| Stochastic | K=20.98 D=19.26 | K=63.36 D=49.03 | Mixed | 1H bullish crossover in oversold zone; 4H also bullish. Short-term recovery signal forming |
| ADX | 33.02 | 35.83 | Strong Trend | Downtrend has significant energy; do not fade blindly against this reading |
| Bollinger Bands | Below Mid | Below Mid | Bearish | Daily: price below lower band, extreme conditions or genuine breakdown in progress |
Frequently Asked Questions: XAGUSD Analysis
What happens if XAGUSD breaks below the $65.20 support level?
A confirmed break below $65.20 (1H S1) would likely trigger stop-loss orders and accelerate selling toward $64.76 (S2) and potentially $64.51 (S3). With ADX at 33.02 confirming strong downtrend momentum, a support break historically sees follow-through rather than an immediate snap-back, making this the single most important technical level to monitor on a 1-hour or 4-hour closing basis right now.
Is the 4H RSI at 26.61 a reliable buy signal for XAGUSD right now?
A 4H RSI at 26.61 indicates deeply oversold conditions and raises the probability of a near-term bounce, but it is not a standalone buy signal in a trending market. With ADX at 35.83 and MACD negative across all timeframes, oversold RSI can persist for multiple sessions before resolving. A more reliable confirmation trigger is a 4-hour close above $65.89 resistance, which would represent price action validating the oversold signal rather than preceding it.
How will the upcoming US CPI release affect XAGUSD prices this week?
A CPI print above consensus would reinforce the Fed's restrictive stance, push DXY higher from 99.71, and add fresh pressure on silver below the current $65.22 level toward $64.76 or lower. A softer CPI result would weaken the dollar narrative, releasing pressure on deeply oversold metals and potentially triggering a short-covering rally toward the $65.89 to $66.58 resistance zone within one to two sessions.
What is the XAGUSD outlook if gold (XAUUSD) continues falling from $4,257?
If gold extends its 1.63% daily decline and breaks below the $4,253 support area, silver historically amplifies gold's moves by a factor of 1.5 to 2x due to its higher beta characteristics. That correlation implies XAGUSD could accelerate toward $64.76 or $64.51 if gold loses its near-term floor, making XAUUSD price action the most important leading indicator for silver's next directional move this week.
Track markets in real-time
AI-powered analysis, technical indicators and real-time price data.
Join Our Telegram Channel
Breaking market news, AI analysis and trading signals instantly.
Join Channel