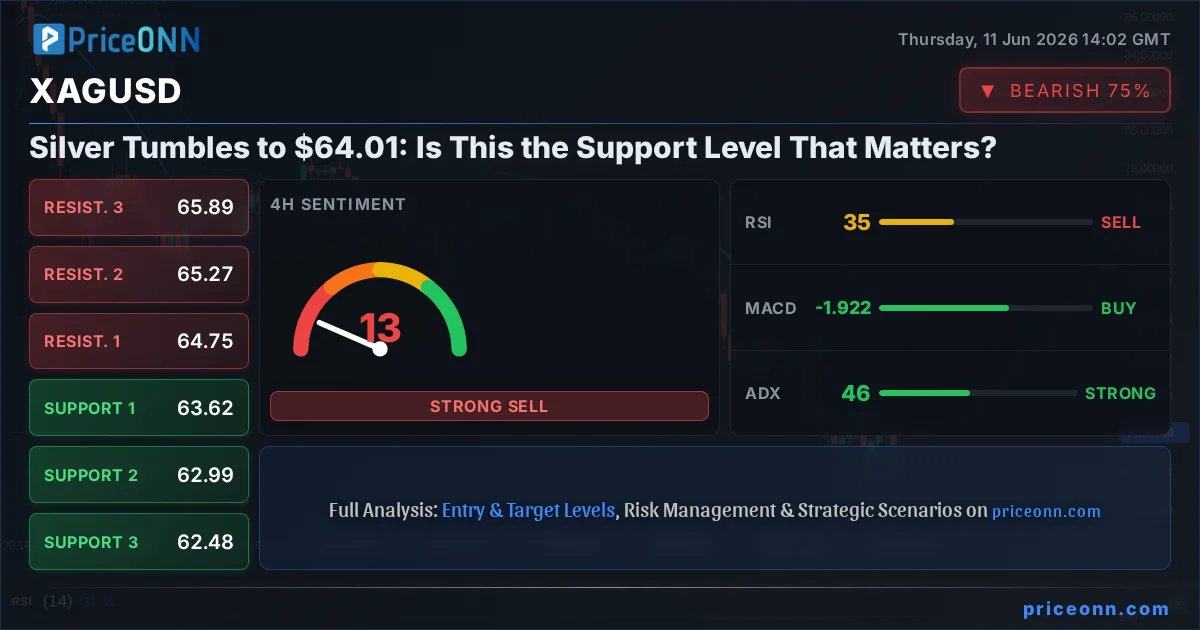
Silver just did something the bears have been waiting months for: it’s sinking, and fast. At $64.01, the precious metal is showing a clear bearish trend across multiple timeframes, with the 1-hour chart flashing a strong 'SELL' signal. This isn't just a minor dip; we're talking about a significant move that has traders glued to their screens, wondering if the critical support level at $63.44 will hold or crumble under the pressure of a relentless data deluge. The question on everyone's mind is not just where silver is going, but *why* it’s moving so dramatically right now. The confluence of a strengthening dollar and a risk-off sentiment in broader markets is painting a grim picture for bulls, but is there a glimmer of hope lurking in the oversold indicators?
- XAGUSD is currently trading at $64.01, with a strong bearish trend indicated on the 1-hour and 4-hour charts.
- The critical support level to watch is $63.44, with further levels at $61.57 and $58.79 if the downtrend accelerates.
- RSI on the 1-hour chart is at 49.15, showing a slight bearish lean, while the 4-hour RSI is at 34.35, nearing oversold territory.
- The US Dollar Index (DXY) is at 99.88, showing a strengthening trend, which typically exerts downward pressure on silver prices.
The sheer velocity of silver's decline is striking. Over the past 24 hours, XAGUSD has shed nearly 2%, a significant move for the typically more stable of the precious metals. This isn't happening in a vacuum; the broader market sentiment is decidedly risk-averse. The DXY, or Dollar Index, is firming up, currently trading at 99.88 and showing a clear upward trajectory on the 1-hour chart. This often spells trouble for commodities priced in dollars, like silver. When the dollar strengthens, it becomes more expensive for holders of other currencies to buy silver, thus dampening demand. Furthermore, the correlation analysis suggests that as the dollar index climbs, precious metals like gold and silver tend to face headwinds. Right now, the dollar is showing strength, and it’s no coincidence that gold is also showing weakness, trading at $4081.9 and down 4.16% on the day. This broad-based commodity weakness is a red flag for investors.
The Data Deluge: What's Really Driving the Price Action?
We're drowning in economic data this week, and it’s creating a volatile environment for assets like silver. While the specific economic calendar details provided are sparse on actual released numbers for today, the *implication* of upcoming data, especially from the US and Europe, is weighing heavily. Recent news indicates that US headline inflation climbed to a three-year high in May, hitting 0.5% month-on-month, meeting forecasts. This is crucial. Higher inflation often fuels demand for gold and silver as inflation hedges, but the market's reaction is complex. If inflation is perceived as 'sticky' and prompts fears of aggressive central bank tightening, it can paradoxically hurt commodities by strengthening the dollar and increasing borrowing costs. The European Central Bank (ECB) meeting, which just hiked rates by 25bps, also added to the uncertainty, delivering higher inflation forecasts alongside a cut to growth outlook. This mixed economic picture, coupled with ongoing geopolitical tensions that historically boost safe-haven assets, creates a confusing signal for silver. The market is trying to digest whether the inflation narrative will lead to a goldilocks scenario for metals or a credit crunch that crushes demand.
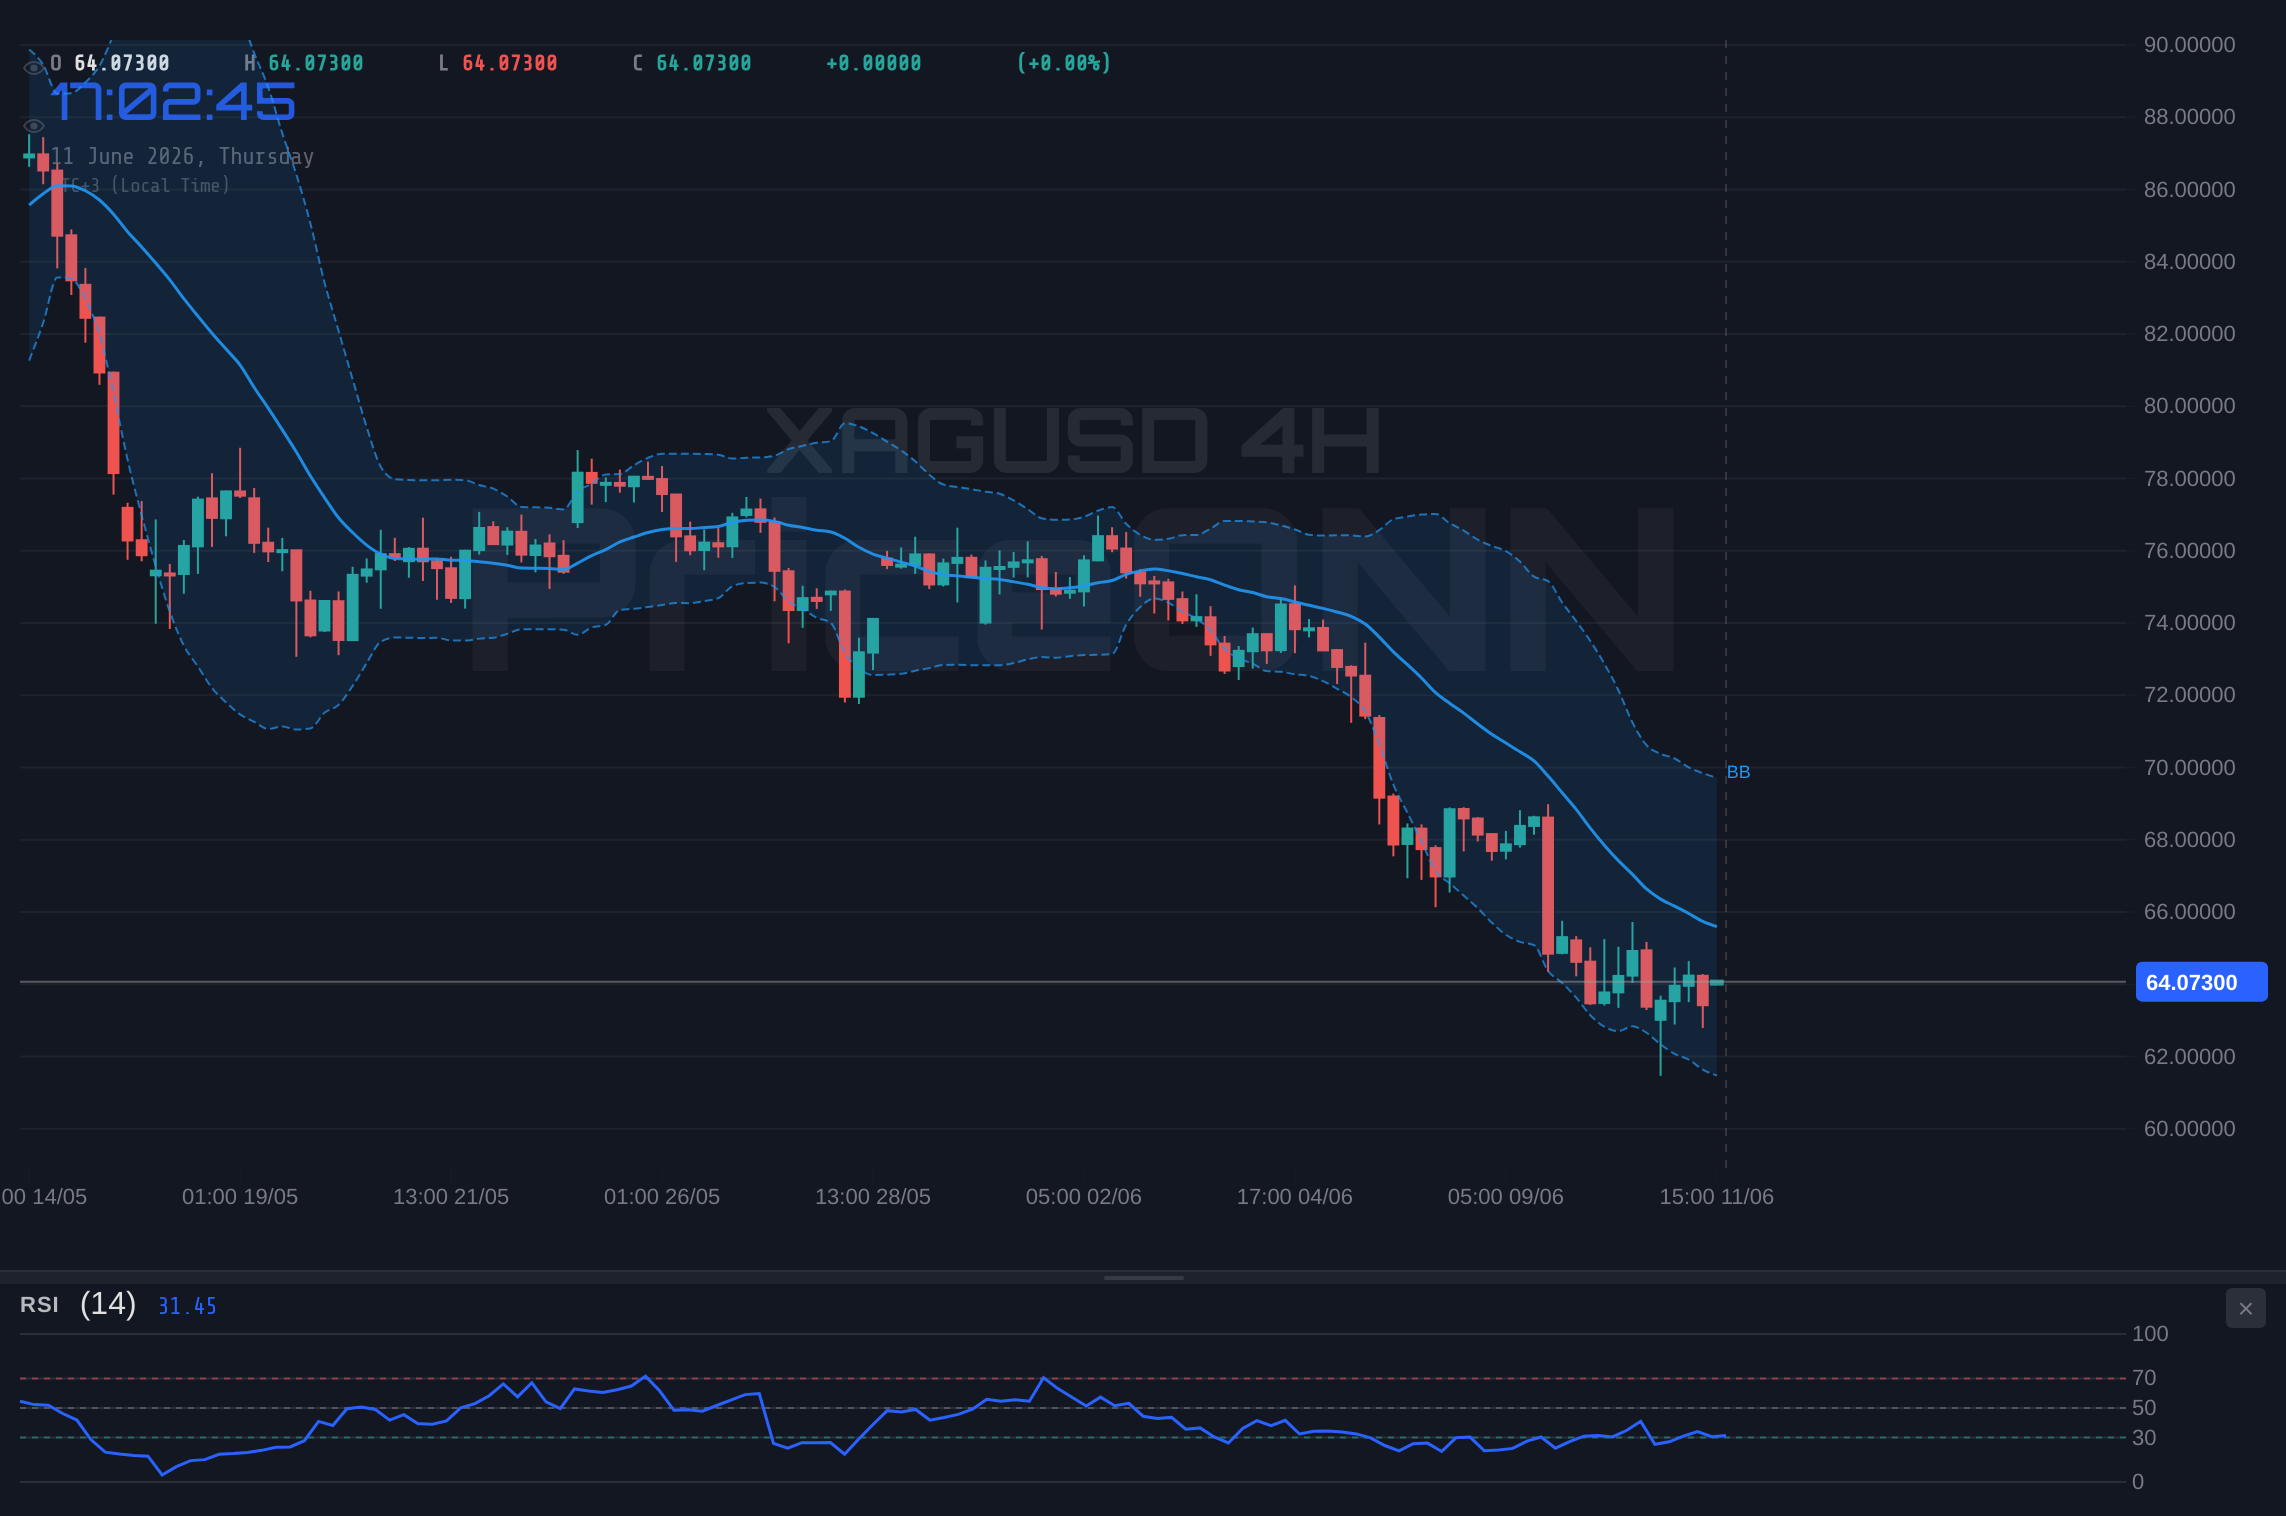
The technical indicators on the 1-hour chart for XAGUSD paint a picture of cautious pessimism. The RSI is hovering around 49.15, right in that neutral territory but showing a slight downward inclination. This means neither buyers nor sellers are fully in control, but the momentum is leaning towards the downside. The MACD is showing positive momentum with the MACD line above the signal line, which might seem like a buy signal in isolation, but it's occurring within a broader bearish context. More telling is the Bollinger Bands, which show the price below the middle band, indicating a bearish trend. The Stochastic oscillator, with %K at 48.78 and %D at 65.46, is giving a clear sell signal as %K dips below %D. However, the ADX at 32.43 is the real standout here; it signifies a strong, established downtrend. When ADX is this high, it means the prevailing trend has significant conviction behind it, making it difficult for counter-trend moves to gain traction. The overall signal aggregation on this timeframe leans heavily towards 'SELL'.
The ADX value of 32.43 on the 1-hour chart for XAGUSD is a significant warning. This indicates a strong prevailing trend, and attempting to fight it by buying into this weakness is a high-risk strategy. The current price action suggests sellers are in command, and any minor bounces are likely opportunities for them to add to positions.
Diving deeper into the 4-hour timeframe, the trend picture for XAGUSD becomes even more bearish, with a 100% strength rating. The support levels are identified at $63.62, $62.99, and $62.48. Resistance is stacked up at $64.75, $65.27, and $65.89. The RSI here is at 34.35, which is firmly in the neutral-to-oversold territory. While an RSI below 30 is typically considered oversold, a reading in the mid-30s can still indicate significant selling pressure without necessarily being an immediate buy signal. The MACD remains negative, below its signal line, reinforcing the bearish momentum. Bollinger Bands are again below the middle band, confirming the downward pressure. Interestingly, the Stochastic here is showing a potential buy signal (%K at 61.05, %D at 31.88, with %K crossing above %D), but this is often a lagging indicator in a strong trend and can generate false signals. The ADX at 49.83 is exceptionally high, confirming a very strong downtrend. This ADX reading reinforces the bearish sentiment seen on the 1-hour chart, suggesting that the current downward move has substantial power and is unlikely to reverse without significant fundamental or technical catalysts.
The daily chart offers a longer-term perspective, and it’s not much rosier for silver. The trend is unequivocally bearish, with 100% strength. Key support levels are marked at $63.44, $61.57, and $58.79, while resistance looms at $68.08, $70.85, and $72.72. The RSI is sitting at 24.56, firmly in the oversold region. Historically, RSI values this low on a daily chart often precede a bounce or consolidation, presenting a potential risk for short-sellers. However, oversold conditions don't automatically equate to a buy signal; price action and confirmation are key. The MACD is deeply negative, further below its signal line, and the Bollinger Bands are hugging the lower band, signaling extreme selling pressure. The Stochastic oscillator on the daily chart is showing a sell signal (%K at 9.27, %D at 26.5), which is somewhat aligned with the overall bearish momentum, though it is nearing extreme oversold levels. The ADX here is at 31.83, indicating a strong downtrend, though less aggressive than the 4-hour reading. The sheer number of 'SELL' signals across all timeframes, despite the oversold RSI on the daily chart, suggests that the path of least resistance for XAGUSD remains downwards in the immediate future. The aggregate signal across all analyzed timeframes is a resounding 'SELL'.
Correlations and Macroeconomic Crosswinds
The narrative surrounding silver cannot be told without considering its relationship with gold, the US Dollar Index (DXY), and broader equity markets like the S&P 500. As mentioned, the DXY is currently at 99.88 and trending upwards on the hourly chart, which is a significant headwind for silver. This strengthening dollar narrative is likely fueled by a combination of factors, including persistent inflation data and potential policy divergence among major central banks. The recent ECB rate hike, while expected, was accompanied by a less dovish outlook than some anticipated, potentially strengthening the Euro in the short term but adding to global economic uncertainty. Meanwhile, US equity markets are showing mixed signals. The S&P 500 is up 0.74% today, trading at 6572.87, indicating some resilience. However, the Nasdaq 100 has slipped 0.77% to 28873.24, and the Dow Jones Industrial Average is down 1.05% to 50280.5. This divergence suggests that while large-cap tech might be facing pressure, the broader market is still attempting to find its footing. A sustained risk-off move in equities would typically benefit safe-haven assets like gold, but the current dollar strength seems to be overriding that effect, pulling silver down with it.
The price action in oil also plays a crucial role in the inflation narrative that underpins precious metal demand. Brent crude is trading at $94.25, up 0.23% today, while WTI is at $90.12, up 0.57%. While oil prices are showing some upside, they are not currently in a runaway bull market that would typically signal rampant inflation fears. This suggests that the market is pricing in a more moderate inflation outlook, or perhaps focusing more on the demand-side risks from a slowing global economy. If oil prices were surging dramatically, it would likely provide a stronger fundamental tailwind for silver as an inflation hedge. However, the current levels suggest that while geopolitical risks related to energy supply are present, they are not the dominant driver of silver's price action at this exact moment. The market seems more focused on interest rate expectations and the strength of the US dollar.
The dichotomy between the daily chart's oversold RSI (24.56) and the persistent bearish signals across all timeframes is where the real trading dilemma lies. This is a classic case of indicators flashing conflicting messages, a situation that demands extreme caution. While the daily RSI screams 'oversold, potential bounce incoming,' the strong ADX readings (32.43 on 1H, 49.83 on 4H, 31.83 on 1D) and the overwhelming 'SELL' signals on shorter timeframes suggest that the downtrend has significant momentum. It’s entirely possible for markets to remain oversold for extended periods, especially in strong trending environments. Therefore, traders should be wary of prematurely calling a bottom. The current price of $64.01 is hovering precariously close to the $63.44 support. A break below this level would invalidate any short-term bullish divergence and likely accelerate the sell-off towards the next significant support at $61.57. Conversely, if silver can manage to bounce and hold above the $65.00 psychological level, it might signal a temporary reprieve, but significant upside would require breaking through the immediate resistance at $64.75 and then the more critical $65.89 level.
The current market environment for XAGUSD is characterized by a strong bearish trend on shorter timeframes, despite daily oversold conditions. This divergence means that while a bounce is statistically possible, the risk of further downside is higher. Traders should look for confirmation signals, such as a decisive break above the 4-hour middle Bollinger Band or a cross above the $65.00 psychological level, before considering any long positions. Conversely, a break and hold below $63.44 support would confirm the bearish thesis and open the door for further declines.
Scenario Analysis: Navigating the Path Forward
Given the current technical setup and fundamental crosscurrents, several scenarios could unfold for XAGUSD. The prevailing bearish sentiment, supported by strong trend indicators and a strengthening dollar, suggests that the downside remains the more probable path in the short to medium term. However, the oversold conditions on the daily RSI cannot be ignored entirely, hinting at potential for a sharp reversal or at least a consolidation phase if key levels are defended.
Bearish Scenario: Sellers Maintain Control
70% ProbabilityNeutral Scenario: Consolidation and Observation
20% ProbabilityBullish Scenario: Oversold Bounce
10% ProbabilityThe path forward for silver hinges on several key factors. Firstly, the continued strength or weakness of the US dollar will be paramount. If the DXY continues its upward march, silver will likely remain under pressure. Secondly, upcoming economic data, particularly inflation and employment figures from the US, will dictate the Federal Reserve's policy path and, consequently, market sentiment. Any indication of sticky inflation or a less dovish Fed could further bolster the dollar and suppress commodity prices. Geopolitical tensions, while a background constant, could provide a sudden boost to safe-haven demand for silver if they escalate significantly. However, based on the current confluence of technical signals and macro correlations, the bears appear to have the upper hand. The $63.44 support level is the immediate battleground. A decisive break below it would open up significant downside potential, aligning with the strong bearish trend indicated across multiple timeframes.
Frequently Asked Questions: XAGUSD Analysis
What happens if XAGUSD breaks below the $63.44 support level?
A decisive break below $63.44 would confirm the strong bearish trend indicated by the ADX at 49.83 on the 4-hour chart. This would likely trigger further selling pressure, potentially targeting the next significant support level at $61.57.
Should I buy XAGUSD at current levels of $64.01, given the daily RSI is at 24.56?
Buying solely based on the daily oversold RSI of 24.56 at $64.01 is risky. While oversold conditions suggest a potential bounce, the strong bearish trend on shorter timeframes (ADX 32.43+) and the $63.44 support being tested indicate higher probability for further downside. Wait for confirmation, such as a break above $65.00 or a clear reversal pattern, before considering long positions.
Is the RSI at 49.15 on the 1-hour chart a sell signal for XAGUSD?
An RSI of 49.15 is not a definitive sell signal in itself, as it sits in neutral territory. However, its slight downward inclination combined with the strong bearish ADX of 32.43 and the price trading below the middle Bollinger Band on the 1-hour chart does lean towards bearish momentum. It reinforces the overall cautious sentiment rather than being a standalone sell trigger.
How will the ECB rate hike and upcoming US data affect XAGUSD this week?
The ECB's 25bps hike and higher inflation forecasts add to global economic uncertainty, potentially strengthening the dollar and pressuring silver. Upcoming US inflation and employment data will be critical; if they signal sticky inflation and hawkish Fed expectations, the dollar's strength could intensify, pushing XAGUSD lower towards the $63.44 support.
Track markets in real-time
AI-powered analysis, technical indicators and real-time price data.
Join Our Telegram Channel
Breaking market news, AI analysis and trading signals instantly.
Join Channel