The Nasdaq100, a benchmark for the technology-heavy segment of the US stock market, is currently trading at a pivotal $29,644.55. This level represents a significant juncture, with the index exhibiting strong bullish momentum that is now confronting formidable resistance. The question on every trader's mind is whether this upward trajectory can be sustained or if the overhead supply will trigger a correction. Understanding the interplay between technical indicators, macroeconomic factors, and market sentiment is crucial for navigating this complex landscape.
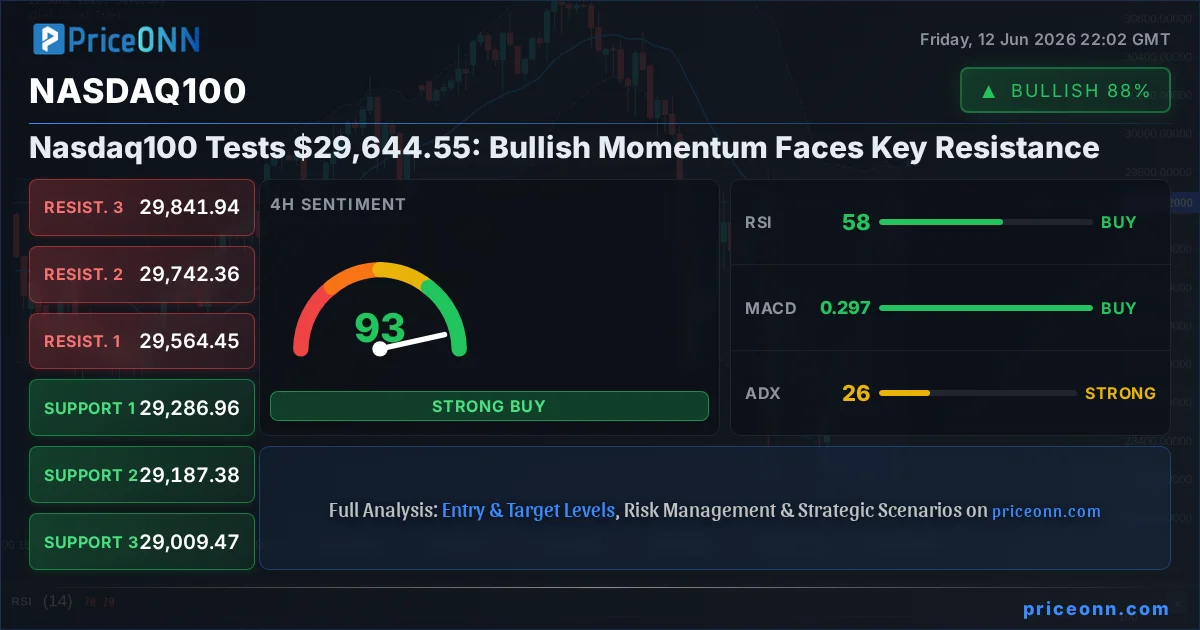
- Nasdaq100's RSI at 58.97 on the 1H chart signals neutral momentum with an upward lean, while the 4H RSI at 62.83 suggests continued bullish sentiment.
- Key resistance levels are identified at $29,680.64 (R1), $29,740.55 (R2), and $29,788.55 (R3) on the 1H timeframe.
- The ADX at 49.72 on the 1H chart indicates a strong uptrend, but a reading of 25.69 on the daily timeframe suggests a more established, albeit potentially slower, trend.
- The US Dollar Index (DXY) is trading at 99.8, which typically exerts downward pressure on risk assets like the Nasdaq100, creating a potential headwind.
- Upcoming economic data releases, particularly those related to inflation and employment, will be critical in shaping the Federal Reserve's policy outlook and, consequently, the Nasdaq100's direction.
The Nasdaq100's current position near $29,644.55 is a testament to the resilience of the tech sector, even as broader market correlations suggest potential headwinds. On the 1-hour chart, the trend is firmly bullish with a power rating of 100%, indicating strong conviction behind the recent upward move. This is supported by the MACD, which, despite showing negative momentum on this timeframe, is positioned above its signal line, hinting at a potential shift. The Stochastic oscillator, with %K at 81.98 and %D at 68.42, further reinforces this bullish sentiment, signaling an upward trend and suggesting that buyers are in control, pushing the index towards higher grounds. The ADX reading of 17.57, however, points to a weaker trend on this shorter timeframe, implying that while the direction is up, the conviction might not be as solid as the price action suggests.
Delving deeper into the 4-hour timeframe, the picture becomes more nuanced. The trend is categorized as neutral with a power rating of 50%, suggesting a period of consolidation or indecision after the recent rally. Here, the RSI sits at 57.67, comfortably in neutral territory but with a slight upward lean, indicating that the buying pressure is still present but not overwhelming. The MACD, in contrast to the 1H, shows positive momentum, with the MACD line above its signal line, indicating strengthening upward pressure. This is further corroborated by the Stochastic oscillator, where %K at 86.08 and %D at 84.05 are in overbought territory, suggesting that while the uptrend is strong, the index might be due for a pause or a minor pullback. The ADX at 25.69 indicates a moderately strong trend, a significant increase from the 1H reading, implying that the bullish move has some underlying strength.
The daily perspective for the Nasdaq100 presents a more complex scenario, highlighting the importance of multi-timeframe analysis. While the overall trend is classified as bullish with a power rating of 91%, the ADX at 32.48 indicates a strong downward trend on this longer timeframe. This apparent contradiction underscores the recent volatility and the potential for shifts in market sentiment. The RSI at 54.74 remains in neutral territory, offering little clarity on the immediate direction. However, the MACD histogram is negative, and the MACD line is below its signal line, suggesting that the longer-term momentum might be waning, despite the recent price action. The Stochastic oscillator, with %K at 33.78 and %D at 40.27, is in oversold territory and showing a potential upward signal, but its position relative to the %D line indicates that the bearish momentum might still be dominant in the short term. This divergence between shorter-term bullish signals and longer-term bearish indicators is where significant trading opportunities, and risks, lie.
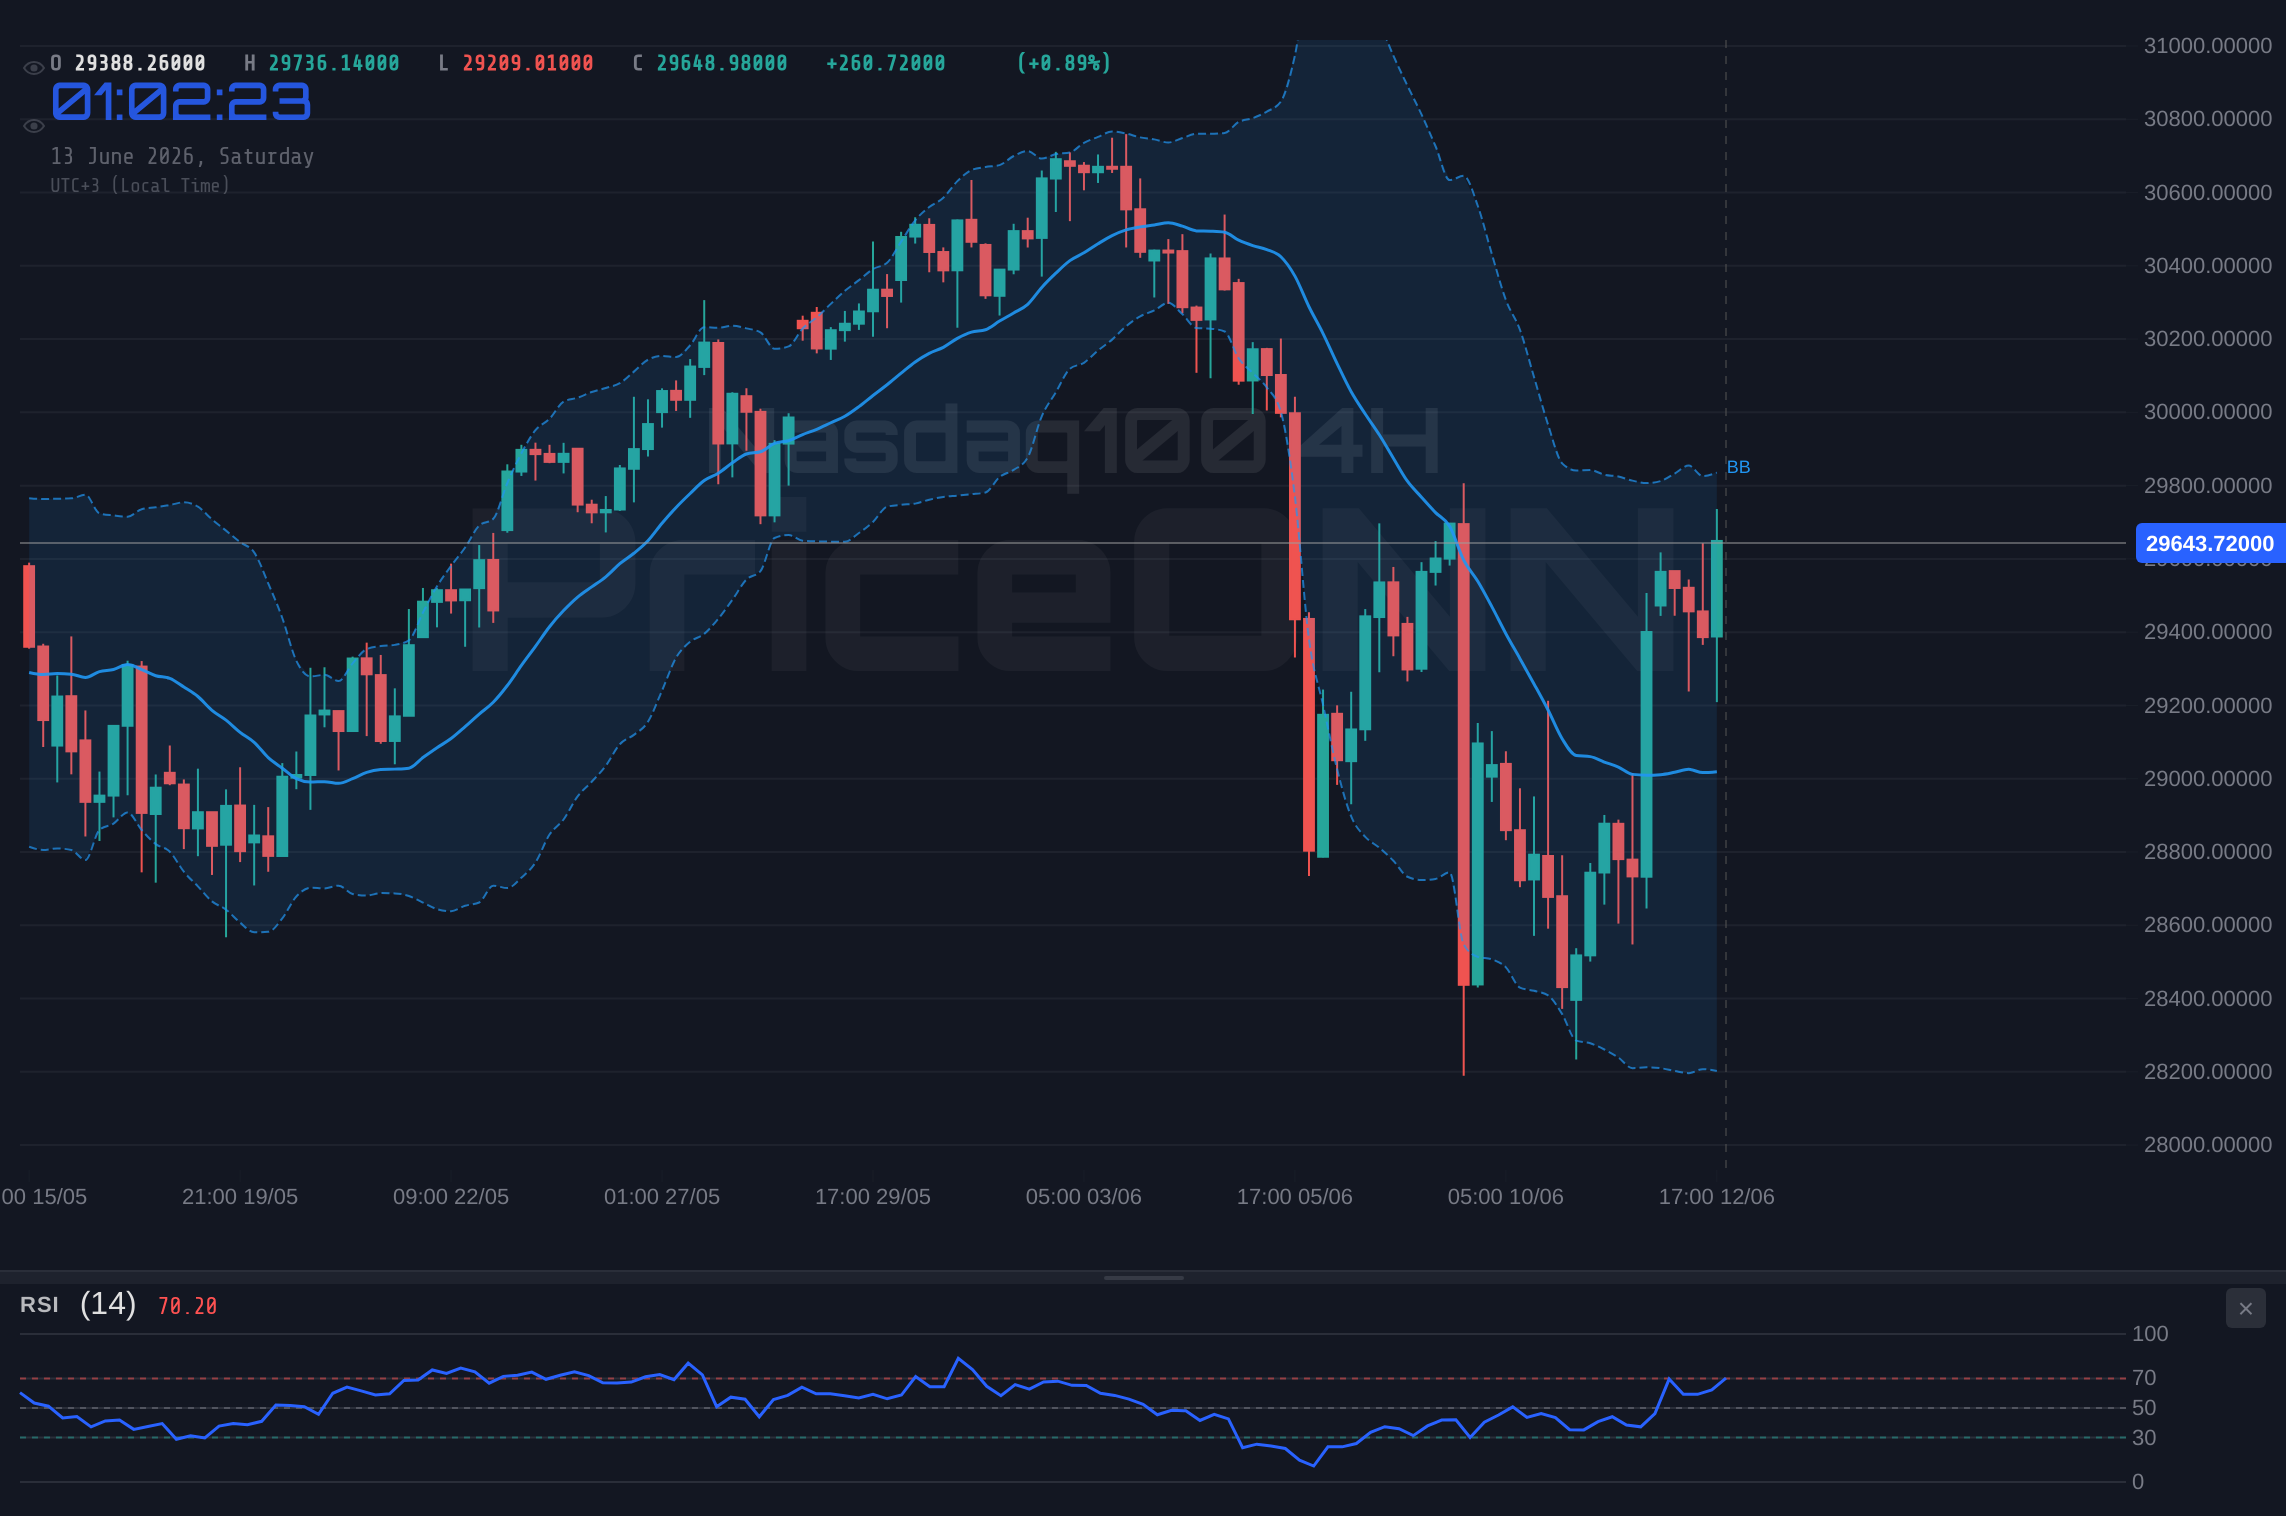
The current price of $29,644.55 is approaching the first significant resistance level at $29,680.64 on the 1-hour chart. A decisive break above this level, supported by increased volume and sustained buying pressure, could pave the way for further upside towards $29,740.55 and potentially $29,788.55. However, the confluence of technical signals, particularly the overbought Stochastic on the 4H and the weakening MACD on the daily, suggests that this resistance zone could prove challenging. The ADX readings across different timeframes also paint a mixed picture: strong on the 1H, moderate on the 4H, and indicating a downward trend on the daily. This suggests that while the immediate impulse is upward, the broader trend might not fully support a sustained rally without further fundamental catalysts.
Correlation analysis reveals that the US Dollar Index (DXY) is currently trading at 99.8, exhibiting a slight upward trend. Historically, a stronger dollar tends to put pressure on risk assets like the Nasdaq100, as it makes dollar-denominated assets more expensive for foreign investors. This presents a potential headwind for the index. If the DXY continues to climb towards the 100.04 resistance level, it could exacerbate the selling pressure on the Nasdaq100, especially if it breaks below its immediate support levels. Conversely, any weakness in the dollar could provide additional fuel for the current bullish sentiment in the tech index.
Geopolitical developments also play a crucial role in shaping market sentiment. Recent news suggests a de-escalation in Middle Eastern tensions, which initially sent the US Dollar Index tumbling. However, the dollar has since recovered, indicating a complex risk environment. While optimism about peace deals can reduce safe-haven demand, underlying economic concerns and central bank policies remain dominant drivers. The report that oil prices plunged on Hormuz optimism suggests a shift in risk appetite, potentially favoring riskier assets like equities. However, the same reports also note that the US Dollar Index has recovered, highlighting the ongoing uncertainty and the market's tendency to react to multiple, sometimes conflicting, signals.
The economic calendar is packed with high-impact events that will undoubtedly influence the Nasdaq100's trajectory. With the Federal Reserve's policy stance being a major driver of equity markets, upcoming US economic data releases will be closely scrutinized. While specific data points like CPI, NFP, and PMI were not provided in the immediate market data snapshot, their general importance is undeniable. For instance, a stronger-than-expected inflation report could reignite fears of tighter monetary policy, potentially leading to a pullback in the Nasdaq100. Conversely, robust employment figures or signs of economic cooling could be interpreted as positive for equities if they increase the likelihood of Fed rate cuts.
Looking at the broader equity market context, the S&P 500 is trading at $6,572.87, showing a strong upward move with a 0.74% daily gain. This positive correlation suggests that the strength in the broader market is supporting the Nasdaq100. However, the S&P 500's daily RSI at 45.35 indicates a downward trend, and its ADX at 47.51 points to a strong downward trend on the daily timeframe, which contrasts with the shorter-term bullish signals. This divergence is a critical point to watch; if the broader market sentiment shifts bearish, the Nasdaq100 could face significant headwinds, regardless of its internal strength.
The Dow Jones Industrial Average is also showing strength, trading at $51,184.5 with a 2.65% daily gain. This broad-based strength across major US indices reinforces the current bullish sentiment. The ADX on the 1H and 4H charts for the Dow also indicates strong upward trends, aligning with the Nasdaq100's shorter-term bullish signals. This synchronicity across the major indices suggests that the current market environment is characterized by broad risk appetite, at least on the surface. However, the daily view for both the S&P 500 and the Dow presents a more cautious outlook, emphasizing the need for traders to remain vigilant.
When considering the technical indicators for the Nasdaq100, the 1-hour chart shows a mixed bag. The RSI at 58.97 is in neutral territory with a slight upward bias, suggesting room for further gains. However, the MACD histogram is negative, indicating waning bullish momentum, and the Stochastic oscillator is showing a strong bullish signal with %K above %D in overbought conditions. The ADX at 17.57 points to a weak trend, suggesting that the current move might lack conviction. This combination implies that while there's upward pressure, the move might be susceptible to a reversal if key resistance levels are not breached decisively.
On the 4-hour chart, the RSI at 62.83 is still in neutral territory, but the MACD is positive, signaling stronger upward momentum. The Stochastic is also in overbought conditions, but with %K above %D, it continues to suggest bullishness, albeit with a warning of potential exhaustion. The ADX at 25.69 indicates a stronger trend than on the 1H chart, suggesting more conviction behind the move. This timeframe provides a slightly more optimistic view than the 1H, but the overbought Stochastic remains a point of caution.
The daily chart, however, is where the most significant divergence appears. The RSI at 54.74 is neutral, but the MACD histogram is negative and the MACD line is below its signal line, indicating bearish momentum on the longer-term view. The Stochastic is in oversold territory with a potential upward signal, but the ADX at 32.48 points to a strong downward trend. This daily picture is crucial; it suggests that the recent rally might be a counter-trend move within a larger bearish structure, or that the market is at a critical inflection point where a trend change could occur. The strength of the daily ADX suggests that if a downtrend is re-established, it could be powerful.
The confluence of these factors presents a challenging trading environment. The immediate upward momentum on shorter timeframes clashes with the more cautious signals on the daily chart and the potential headwinds from a strengthening dollar and a mixed broader equity market. The critical resistance zone between $29,680.64 and $29,788.55 on the 1H chart will be the immediate battleground. A failure to break through this zone could lead to a sharp correction, with support levels around $29,572.63, $29,524.73, and $29,464.82 coming into play. These levels will be critical for determining the short-to-medium term direction of the Nasdaq100.
From a fundamental perspective, the market's reaction to upcoming economic data will be paramount. If inflation proves stickier than expected, it could force the Federal Reserve to maintain a hawkish stance, or even consider further rate hikes, which would be a significant negative for growth stocks like those in the Nasdaq100. Conversely, signs of a cooling economy or easing inflation could bolster hopes for rate cuts, providing a much-needed boost to the index. The interplay between these macroeconomic forces and the current technical setup creates a high degree of uncertainty, demanding a disciplined approach from traders and investors.
The current narrative suggests that while the bulls have managed to push the Nasdaq100 towards its current price of $29,644.55, the path ahead is fraught with challenges. The strong bullish signals on the 1-hour and 4-hour charts are enticing, but they must be weighed against the conflicting signals on the daily chart and the broader macroeconomic environment. The upcoming economic data releases will likely be the catalyst that either confirms the bullish continuation or invalidates the recent gains, leading to a significant price adjustment. Therefore, a strategy that involves waiting for clear confirmation at key levels, managing risk diligently, and staying attuned to both technical and fundamental developments is essential for navigating the current market.
Bearish Scenario: Resistance Holds Firm
65% ProbabilityNeutral Scenario: Consolidation Around $29,644.55
25% ProbabilityBullish Scenario: Breakout Confirmation
10% ProbabilityFrequently Asked Questions: Nasdaq100 Analysis
What happens if Nasdaq100 fails to break above the $29,680.64 resistance level?
If the Nasdaq100 fails to decisively break above the $29,680.64 resistance, a bearish scenario becomes more probable. The index could retreat towards the $29,572.63 support level, with a further drop to $29,464.82 possible if the selling pressure intensifies.
Should I consider buying Nasdaq100 at current levels around $29,644.55 given the mixed signals?
Buying at current levels around $29,644.55 requires caution due to the strong resistance overhead and conflicting daily chart signals. A more prudent approach would be to wait for a confirmed breakout above $29,788.55 or a clear pullback to a support level like $29,572.63, coupled with bullish confirmation.
Is the RSI at 62.83 on the 4-hour chart a buy signal for Nasdaq100?
An RSI of 62.83 on the 4-hour chart indicates bullish momentum but is not yet in overbought territory. While it supports the current upward move, it should be considered alongside other indicators. A Stochastic in overbought territory alongside this RSI suggests caution about immediate further gains.
How might the Federal Reserve's policy outlook impact the Nasdaq100's movement this week?
The Federal Reserve's policy outlook is a critical driver. Any indication of a hawkish stance, perhaps due to persistent inflation, could pressure the Nasdaq100 downwards from current levels. Conversely, signals favoring rate cuts could provide a strong tailwind, potentially helping the index break through resistance.
Track markets in real-time
AI-powered analysis, technical indicators and real-time price data.
Join Our Telegram Channel
Breaking market news, AI analysis and trading signals instantly.
Join Channel