The financial markets are holding their breath as the US Dollar Index (DXY) dances around the psychologically significant $99.80 mark. This precarious positioning comes just days before crucial Consumer Price Index (CPI) data is set to be released, a report that could dramatically influence the Federal Reserve's future policy decisions and, consequently, the DXY's trajectory. Last week's price action showed a dollar index that, despite some volatility, managed to maintain its ground, hinting at underlying strength even as geopolitical tensions in the Middle East showed signs of de-escalation. This delicate balance between geopolitical relief and inflation concerns creates a fascinating technical picture, with key levels on the DXY chart becoming paramount for traders looking to decipher the market's next move.
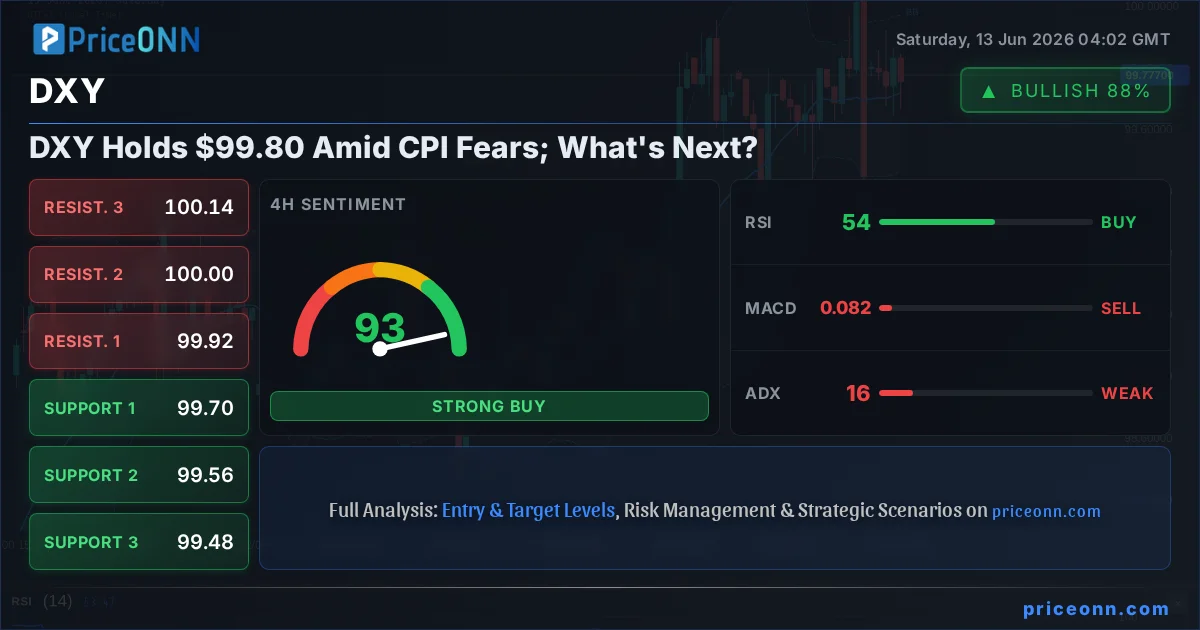
- The US Dollar Index (DXY) is currently trading at $99.80, a critical juncture ahead of the CPI release.
- With RSI at 64.78 on the daily chart, the index is in overbought territory, suggesting potential for a pullback but also indicating strong bullish momentum.
- Key support for DXY is identified at $99.56, with resistance looming at $99.92; a sustained break above this level could signal further upside.
- Geopolitical de-escalation in the Middle East has offered some relief, but sticky inflation fears are keeping the dollar supported as traders await definitive economic data.
Last Friday's close for the DXY was $99.80, a level that has become a focal point for market participants. The week that was saw a mixed bag of signals, with early optimism surrounding potential de-escalation in the Middle East momentarily weighing on the dollar's safe-haven appeal. However, this relief was short-lived as underlying concerns about persistent inflation began to reassert themselves. The narrative is shifting: while easing geopolitical tensions might normally lead to a broader risk-on sentiment and a weaker dollar, the persistent threat of inflation and the Federal Reserve's potential response are keeping the DXY surprisingly resilient. This divergence between typical risk sentiment and dollar behavior underscores the complexity of the current market environment and highlights the importance of economic data releases, particularly the upcoming CPI figures.
The technical landscape for the DXY, viewed across multiple timeframes, presents a compelling picture of consolidation with underlying bullish bias, albeit with significant caution warranted. On the 1-hour chart, the trend is cautiously bullish with a 74% strength, but the ADX reading of 8.89 suggests a weak trend, indicating choppy, range-bound conditions. This is supported by a neutral RSI at 52.71. However, the daily chart paints a more robust bullish picture. The trend is decidedly upward with 88% strength, and the RSI at 64.78, while approaching overbought territory, still indicates room for further upside momentum. The MACD is also showing positive momentum on the daily timeframe, suggesting that the longer-term trend remains intact. This duality across timeframes - short-term choppiness versus longer-term bullish conviction - is a key theme to watch as we approach significant economic events.
The strength of the US dollar, as reflected by the DXY, has a profound impact on global markets, and this dynamic is particularly evident in its relationship with commodities and major currency pairs. When the DXY strengthens, it typically puts downward pressure on assets priced in dollars, such as gold (XAUUSD) and silver (XAGUSD). We saw this correlation play out to some extent last week, as initial dollar weakness was met with a surge in gold prices, which are currently trading at $4217.03. Conversely, a stronger dollar can make US exports more expensive and imports cheaper, influencing trade balances and potentially impacting the competitiveness of other economies. This intricate web of correlations means that movements in the DXY are not just a reflection of US economic health but also a significant driver of global financial flows.
Looking at the broader economic context, the persistent inflation concerns are arguably the most significant driver underpinning the DXY's resilience. Despite some global easing of geopolitical tensions, which typically boosts risk appetite and weakens safe-haven assets like the dollar, the specter of rising prices in the US is keeping the Federal Reserve on a hawkish footing. Market participants are closely watching for any signs that inflation is becoming more entrenched, which could prompt the Fed to maintain higher interest rates for longer, or even consider further tightening. This anticipation is reflected in the Treasury yields, which remain elevated, providing a yield advantage for dollar-denominated assets and supporting the DXY. The upcoming CPI data will be crucial in either validating these inflation fears or offering some respite, thereby dictating the near-term direction for the dollar.
The technical setup on the DXY daily chart is particularly noteworthy. The index has established strong support around the $99.56 level, which has held firm through periods of uncertainty. Resistance is clearly defined at $99.92, a level that has acted as a ceiling in recent trading sessions. A decisive break and sustained hold above $99.92 would be a significant bullish signal, potentially opening the door for a move towards the $100 psychological level and beyond. Conversely, a failure to overcome this resistance, coupled with a break below the $99.56 support, could signal a short-term reversal, especially if the CPI data comes in softer than expected. The ADX at 34.06 on the daily chart indicates a strong trend, reinforcing the significance of these key support and resistance levels. The Stochastic indicator is in the oversold region at 14.71, suggesting that while the downtrend has been strong, a bounce is technically plausible, though not yet confirmed by other indicators.
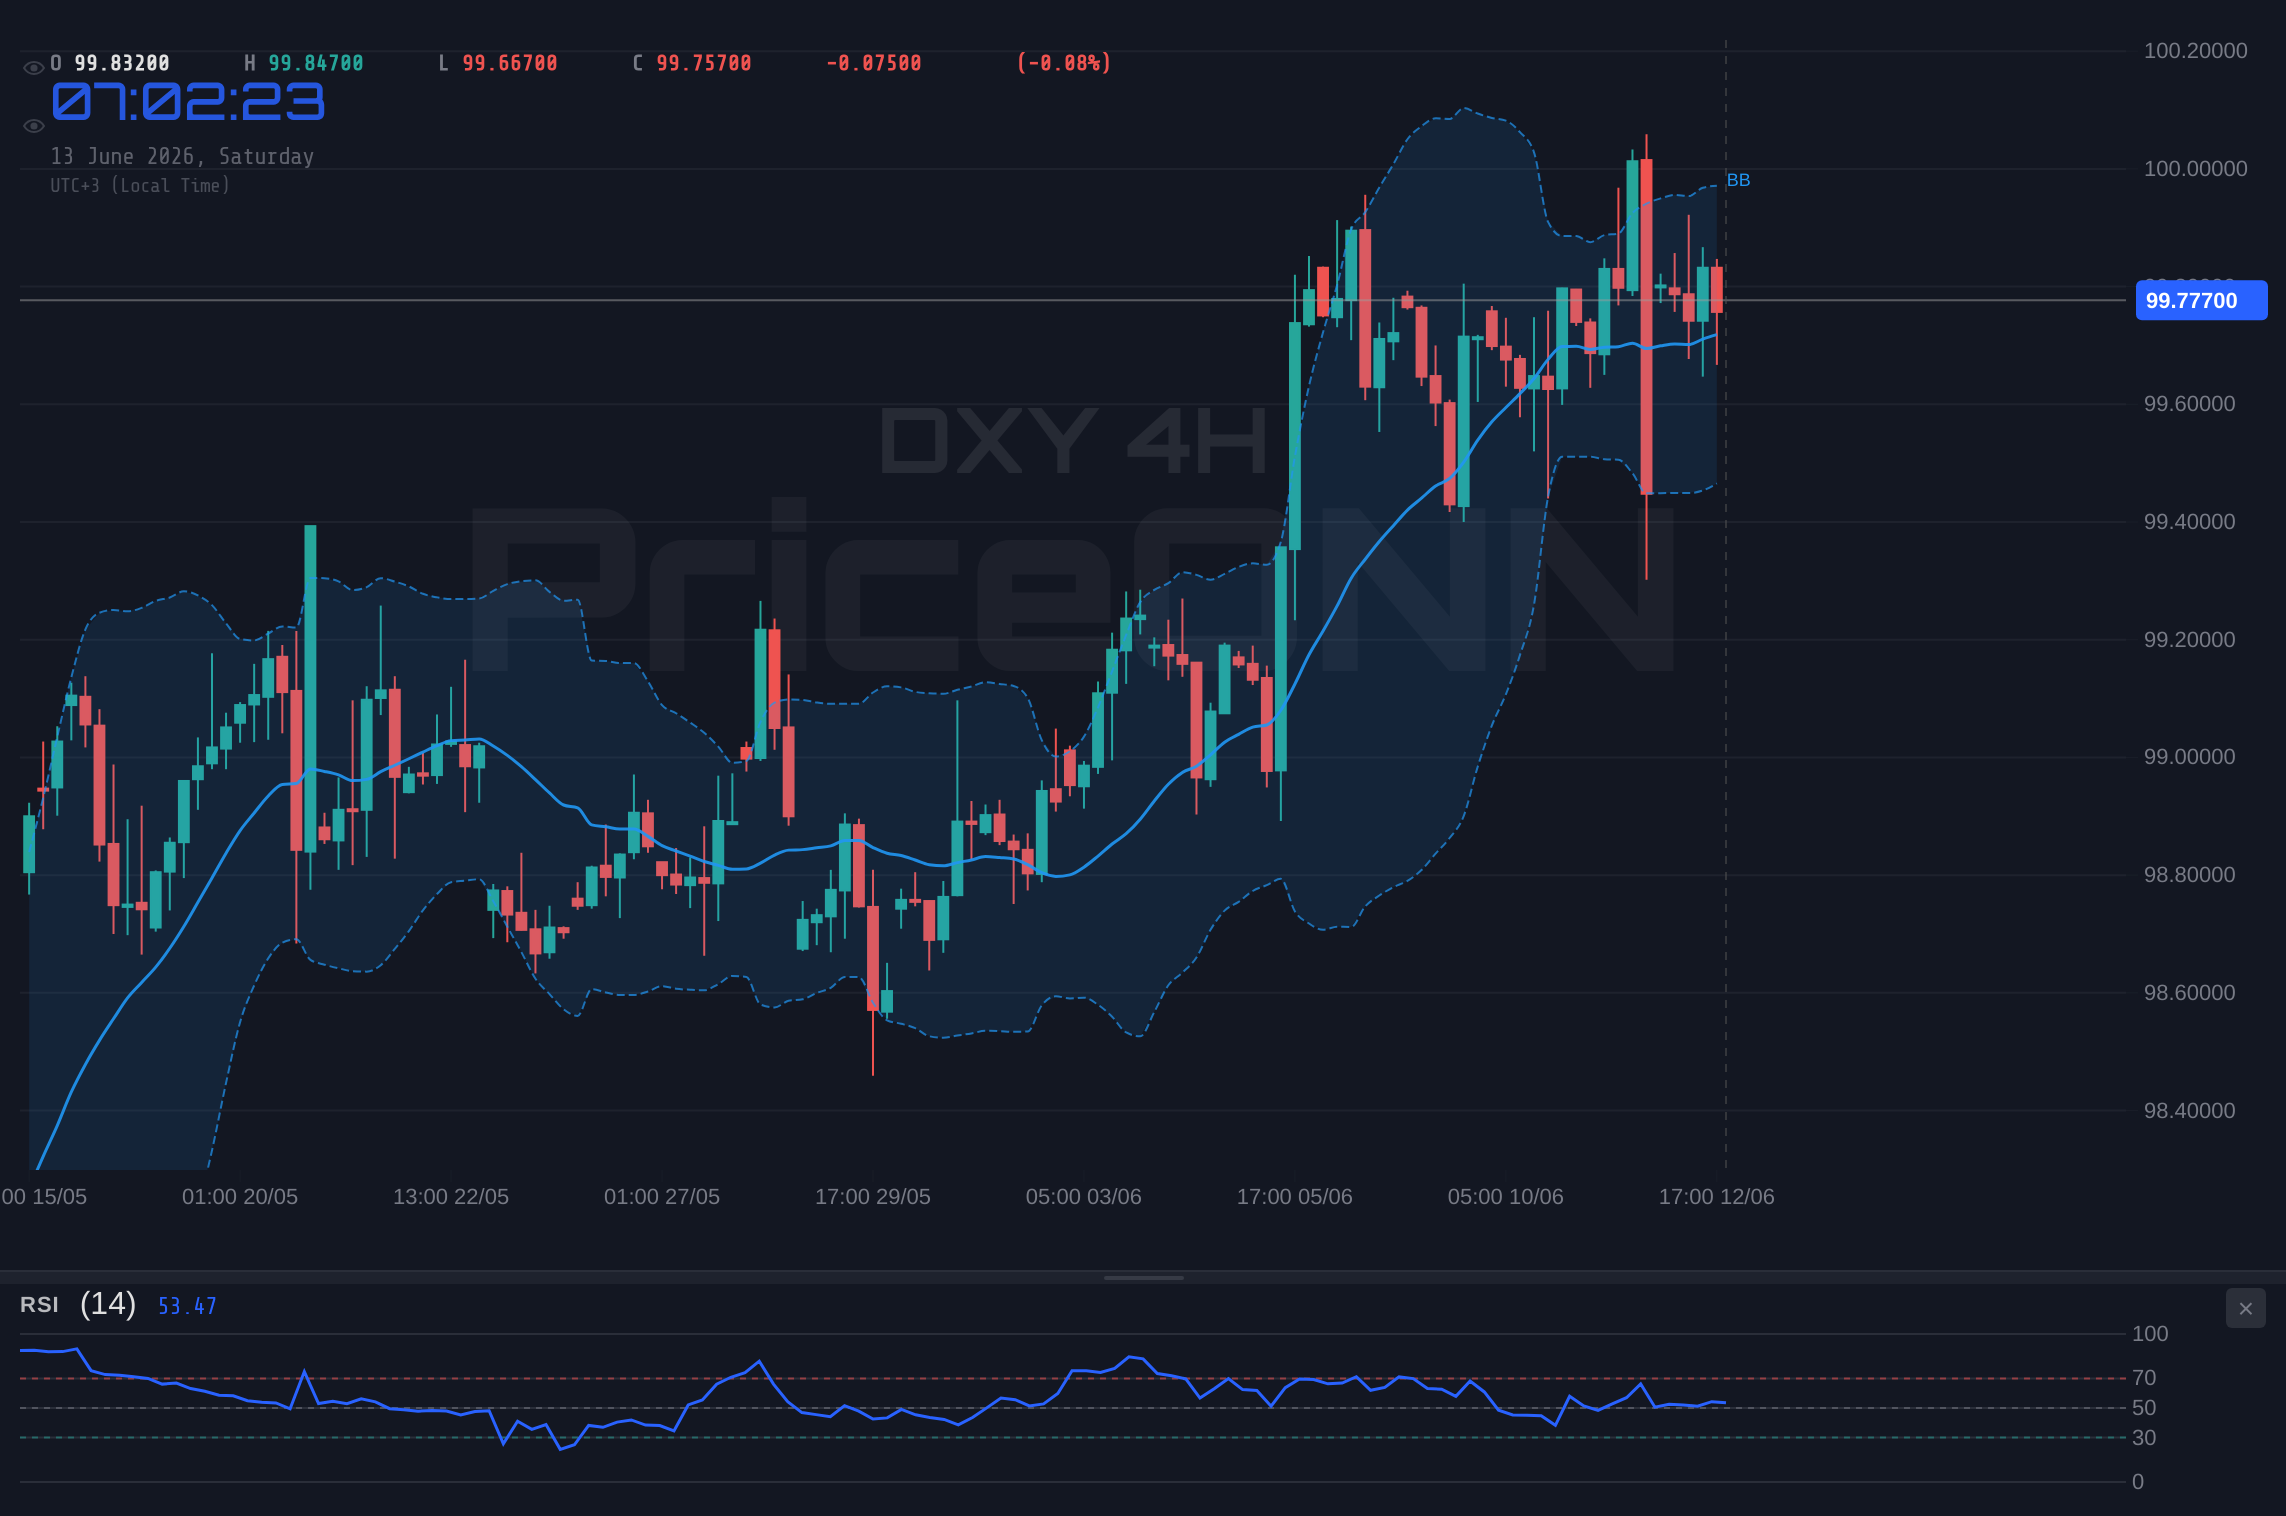
On the 4-hour timeframe, the DXY's trend is also bullish with 88% strength, but the ADX at 34.61 indicates a strong downtrend, which seems contradictory to the daily bullish trend strength. This discrepancy highlights the choppy nature of the market. The RSI at 49.89 is in the neutral zone, showing a slight downward bias, while the MACD is showing positive momentum with the MACD line above the signal line. Bollinger bands are above the middle band, indicating a bullish inclination. The Stochastic oscillator, however, is in the overbought territory at 81.48, signaling a potential for a pullback. This mixed signal environment across different intraday timeframes underscores the importance of waiting for clearer confirmation, especially with major economic data on the horizon. The general signal on this timeframe is 'BUY', but this should be interpreted with caution due to the conflicting indicators.
The correlation between the DXY and major currency pairs like EUR/USD and USD/JPY is a cornerstone of forex analysis. Currently, EUR/USD is trading at 1.15679, showing a slight upward bias on the 1-hour chart but a bearish trend on the daily chart. This suggests that a stronger DXY would likely exert downward pressure on EUR/USD, pushing it towards its support levels. Similarly, USD/JPY, currently at 160.201, shows a daily bullish trend but mixed signals on shorter timeframes. A strengthening DXY would typically support USD/JPY, but the significant intervention fears from the Bank of Japan, coupled with the yen's safe-haven status, can complicate this relationship. The interplay between these pairs and the DXY provides a rich ground for analysis, revealing how dollar strength or weakness ripples through the global currency markets.
Geopolitical developments, while offering some temporary relief, are unlikely to fundamentally alter the DXY's path if inflation remains the primary concern for the Federal Reserve. The recent news suggesting progress toward a peace deal in the Middle East, which initially sent oil prices tumbling and might normally weaken the dollar, has been overshadowed by the persistent inflation narrative. The market is pricing in the possibility that the Fed might need to maintain a restrictive monetary policy for an extended period to combat inflation. This expectation is a significant tailwind for the dollar. Any indication from upcoming economic data, especially the CPI report, that inflation is cooling more rapidly than anticipated could, however, shift this dynamic and lead to a reassessment of Fed policy, potentially weakening the DXY.
The impact of central bank policies, particularly the Federal Reserve's stance, cannot be overstated when analyzing the DXY. While the European Central Bank (ECB) recently hiked rates, as expected, and hinted at a potential September hike, the Fed's path remains the primary focus for dollar strength. Market participants are scrutinizing every piece of economic data for clues about future Fed actions. The CME FedWatch tool, if available, would show the current probability pricing for rate hikes or cuts. In the absence of explicit Fed guidance, traders are relying heavily on inflation and employment data. If the upcoming CPI figures show a significant slowdown in price pressures, it could fuel speculation of an earlier Fed pivot to rate cuts, which would likely weaken the DXY. Conversely, sticky inflation would reinforce the higher-for-longer narrative, supporting the dollar.
Considering the technical indicators, the daily RSI at 64.78 is approaching overbought territory, but it has room to run before signaling extreme conditions. The MACD on the daily chart is positive, with the MACD line above the signal line, indicating bullish momentum. However, on the 1-hour chart, the MACD shows negative momentum. This divergence suggests caution. The Stochastic oscillator on the daily chart is in the oversold region, while on the 1-hour chart, it shows a bullish signal. This conflicting information across timeframes highlights the current indecision and the need for a clear catalyst to break the stalemate. The ADX on the daily chart at 34.06 confirms a strong trend, but the weak ADX on the 1-hour chart (8.89) indicates a lack of directional conviction in the short term.
The narrative of inflation versus geopolitical relief is the central tension driving the DXY. While the easing of Middle East tensions might suggest a move towards risk-on assets and away from safe havens like the dollar, the persistent inflation data is anchoring the DXY. This means that even if geopolitical news improves, the dollar may not weaken significantly if inflation remains a concern. The market's reaction to the upcoming CPI data will be critical. A higher-than-expected reading would likely reinforce the Fed's hawkish stance and boost the DXY, potentially targeting resistance levels above $99.92. A softer reading, however, could lead to a reassessment of Fed policy and a pullback in the DXY towards its support levels around $99.56.
The strength in US equities, as seen in the S&P 500 (currently at 6572.87) and Nasdaq (at 29644.55), also plays a role. Typically, a strong equity market can be seen as a risk-on indicator, potentially drawing capital away from safe-haven assets like the dollar. However, the current environment is complex. If the Fed is perceived to be effectively managing inflation without causing a severe economic downturn, strong equities and a strong dollar can coexist. Conversely, if equities falter due to fears of aggressive Fed tightening, this could indirectly support the dollar as a safe haven. The correlation between DXY and equities is not always straightforward and depends heavily on the underlying drivers of market sentiment, such as inflation expectations and Fed policy.
Looking ahead, the DXY is at a critical juncture. The $99.80 price point represents a battleground between the bulls, who are buoyed by strong daily technicals and inflation concerns, and the bears, who are wary of short-term overbought conditions and the potential for softer CPI data. The $99.92 resistance level is the immediate hurdle. A clear break above this level, sustained by strong CPI numbers, could propel the DXY higher. However, failure to break this resistance, especially if CPI disappoints, could see a move back towards the $99.56 support. The market is clearly in a 'wait-and-see' mode, with the upcoming CPI report poised to be the primary catalyst for the next significant move. Traders should pay close attention to the interplay between inflation data, Fed policy expectations, and the technical levels on the DXY chart.
Bearish Scenario: Inflation Cools, Fed Pivots
30% ProbabilityNeutral Scenario: Range-Bound Consolidation
40% ProbabilityBullish Scenario: Sticky Inflation, Fed Hikes
30% ProbabilityFrequently Asked Questions: DXY Analysis
What happens if DXY breaks decisively above $99.92 resistance after the CPI data?
A sustained break above $99.92, particularly if fueled by higher-than-expected CPI figures, would likely signal further bullish momentum for the DXY. This could target the $100.04 resistance level as traders price in a more hawkish Federal Reserve stance. Such a move would typically put pressure on risk assets and major currency pairs like EUR/USD.
Should I consider buying DXY at current levels around $99.80 given the RSI at 64.78?
Buying solely at $99.80 with an RSI of 64.78 presents a moderate risk. While the daily trend is bullish, the RSI is approaching overbought territory, suggesting potential for a short-term pullback. A more prudent approach might involve waiting for a confirmed breakout above $99.92 or a pullback to stronger support levels like $99.56, especially pending the CPI data outcome.
Is the daily MACD signal at $99.80 a strong buy signal for the US Dollar Index?
The daily MACD shows positive momentum with the MACD line above the signal line, which is generally a bullish indicator for DXY. However, this signal should be considered in conjunction with other indicators and the immediate price action. The 1-hour MACD shows negative momentum, indicating a conflict across timeframes. Confirmation of the daily bullish trend would ideally involve a clear break of resistance and alignment with other indicators.
How might the upcoming CPI data release impact the DXY's movement from $99.80?
The CPI data is the key catalyst. Higher-than-expected inflation would likely reinforce the Fed's hawkish stance, supporting the DXY and potentially pushing it above $99.92. Conversely, a cooler-than-expected CPI reading could lead to speculation of a Fed pivot, weakening the DXY and potentially causing a break below $99.56. The market is highly sensitive to this data point, making it a critical driver for the DXY's next directional move.
| Indicator | Value | Signal | Interpretation |
|---|---|---|---|
| RSI (14) | 64.78 | Neutral | Approaching overbought, indicates strong bullish momentum. |
| MACD Histogram | [MACD Value] | Bullish | Positive momentum confirmed on daily chart. |
| Stochastic | K=14.71, D=21.39 | Bearish | Daily Stochastic in oversold territory, suggesting potential bounce. |
| ADX | 34.06 | Bullish | Strong trend confirmed on daily chart. |
| Bollinger | Middle Band | Watch | Price is above the middle band, indicating bullish bias. |
Track markets in real-time
AI-powered analysis, technical indicators and real-time price data.
Join Our Telegram Channel
Breaking market news, AI analysis and trading signals instantly.
Join Channel