A three-year high in US inflation and a surprisingly resilient euro: that is the paradox sitting at the heart of the EURUSD today analysis. With the pair trading at 1.1545, bulls and bears are locked in a tug-of-war that hinges on diverging central bank narratives, a muted dollar response to hot CPI data, and fresh European economic releases that could tip the balance in either direction.
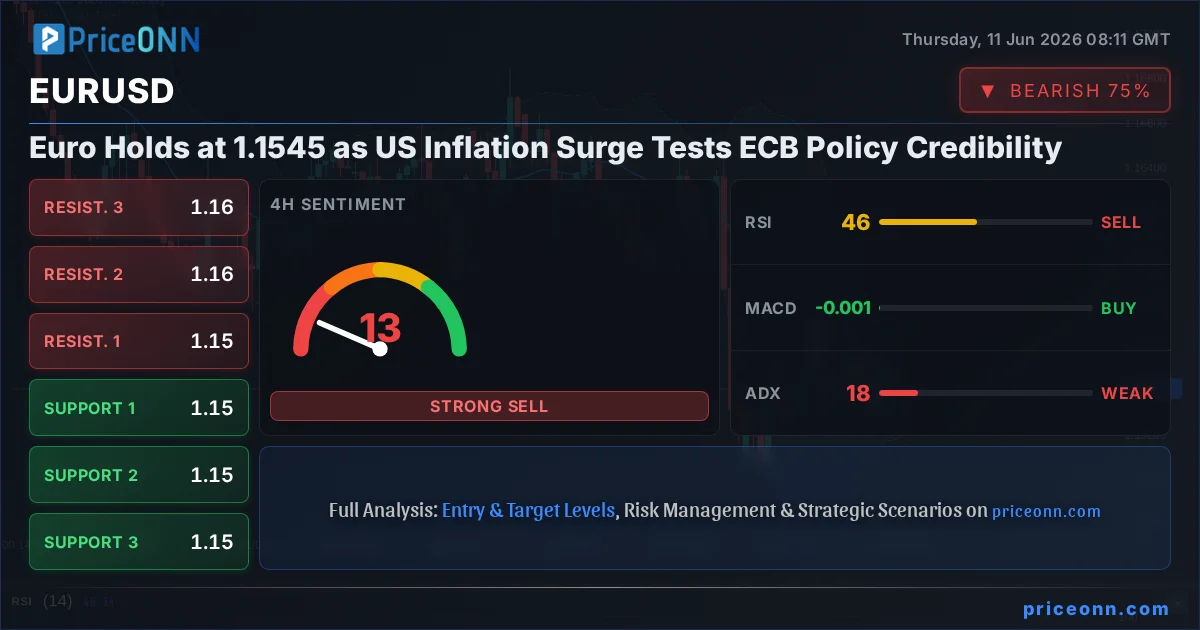
- EURUSD trading at 1.1545, holding a narrow daily range of 1.1532 to 1.1572 after absorbing a US CPI shock that most traders had already priced in
- US CPI rose 0.5% month-on-month in May, a three-year high, yet the dollar index DXY sits at just 99.75 - a telling signal that the inflation trade may be crowded
- Daily RSI at 36.63 approaches oversold territory while ADX at 18.45 confirms weak trend momentum across all timeframes - conditions that typically precede sharp directional moves
- Critical daily resistance at 1.1571 must be cleared convincingly before any bull case gains traction; failure to hold 1.1519 opens the path toward 1.1497 and lower
The Inflation Shock That Should Have Crushed the Euro - But Didn't
When the US Bureau of Labor Statistics confirmed that headline CPI climbed 0.5% month-on-month in May, the fastest pace in three years, conventional wisdom would have the euro sliding hard. The dollar should have surged, yields should have spiked, and EURUSD should have broken down. Instead, the pair barely moved. Sitting at 1.1545 with a daily change of just +0.03%, that near-paralysis tells you something important about where the market was already positioned heading into the print.
According to coverage tracking the pair's stabilization, the euro had already absorbed a sharp decline triggered by a strong US employment report in the days prior, and by the time the CPI number landed, a significant portion of the dollar-positive repricing had already been done. The dynamic at play was a classic 'sell the rumor, buy the fact' reset. That is not a ringing endorsement for euro bulls - it is a stabilization, not a rally. But stabilization after a sell-off, in a pair where the daily trend is already leaning 84% bearish, can mean one of two things: either the market is coiling for another leg lower, or it has found a floor that demands a fresh catalyst to break.
The DXY dollar index at 99.75, up just 0.03% on the day despite the inflation data, reinforces this reading. A dollar that fails to rally meaningfully on a three-year high CPI print is not a green light to buy EURUSD aggressively, but it does raise a legitimate question about whether the next 100-pip move in the pair comes from dollar exhaustion rather than euro strength. With DXY ADX at 24.31 showing moderate upward trend strength, the dollar is in a gradual drift higher rather than a sprint - and gradual drifts can be interrupted by European data surprises.
What EURUSD Multi-Timeframe Analysis Reveals Right Now
Step back from the headline noise and look at the EURUSD trend analysis across timeframes. The picture is more nuanced than the bearish daily trend would suggest on its own.
On the 1-hour chart, the pair is in genuine no-man's land. RSI at 49.62 sits right at the midpoint - not overbought, not oversold, just undecided. The Stochastic oscillator with K at 62.71 below D at 68.79 carries a mild bearish lean, suggesting near-term selling pressure is marginally in control. But with ADX at just 12.32, this is one of the weakest trend readings possible - the 1-hour chart is essentially confirming that there is no trend. Any breakout here is unconfirmed noise until ADX starts climbing toward 20 and beyond.
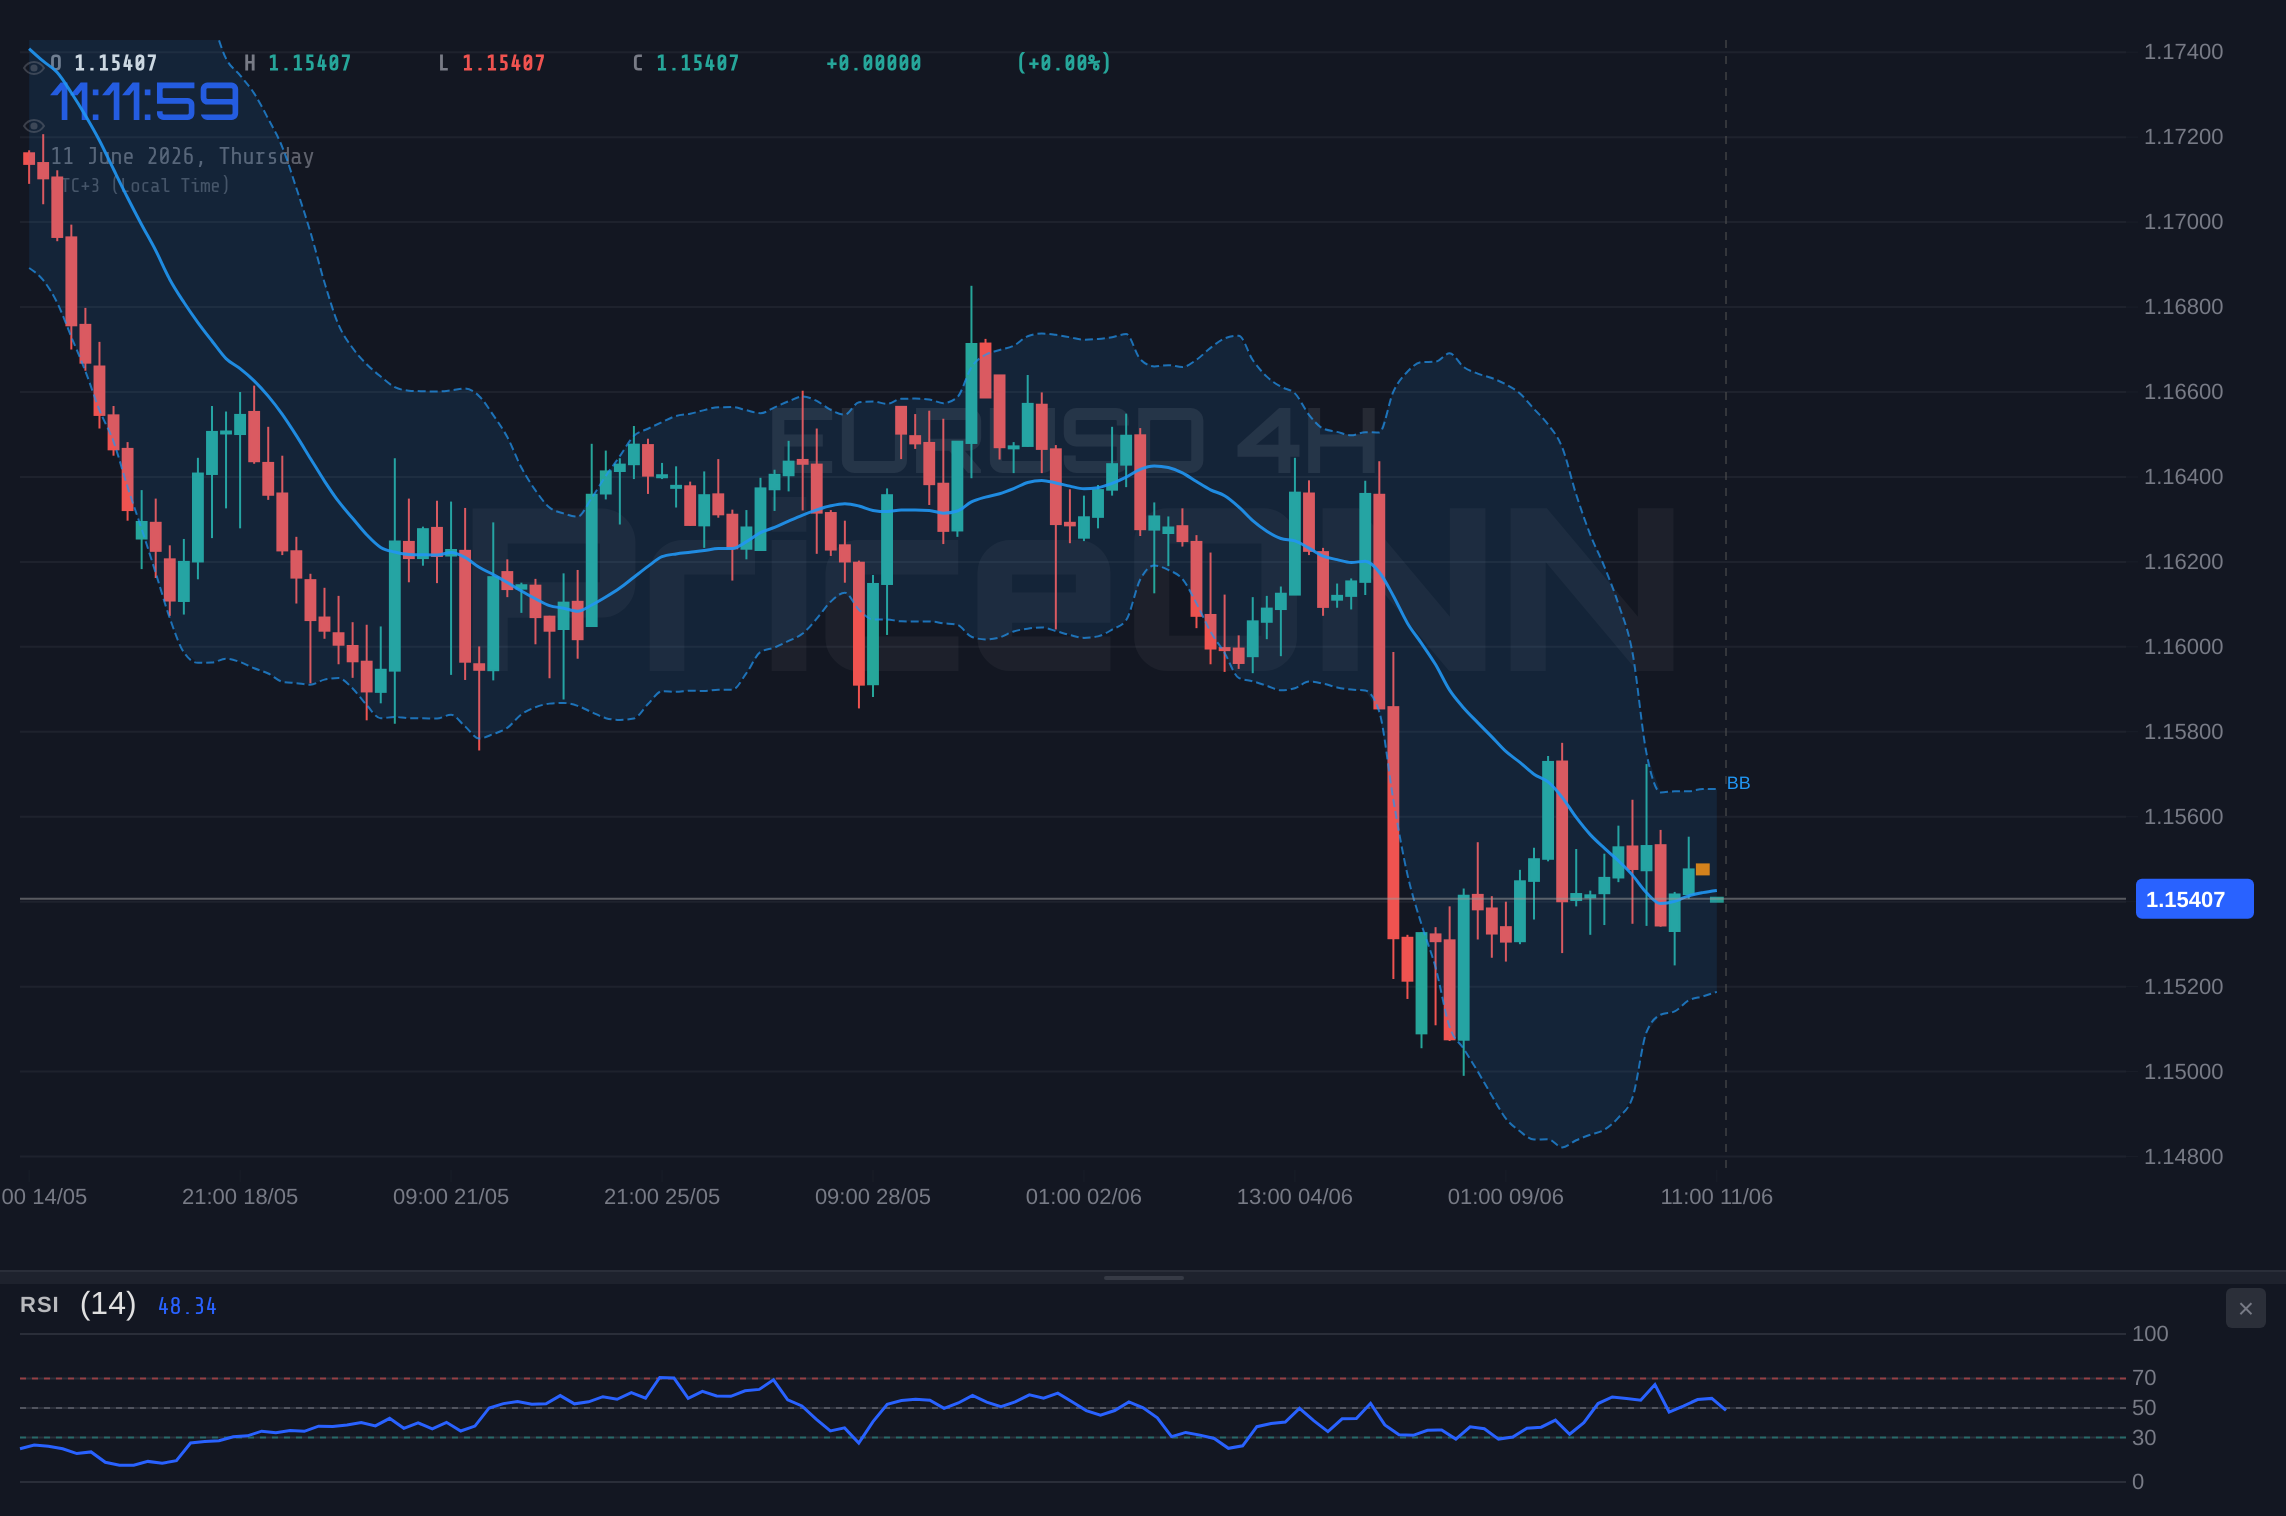
Shift to the 4-hour chart and the picture gets slightly clearer but no less conflicted. RSI at 46.36 is below the midpoint, showing a bearish lean. MACD is in positive territory and above its signal line - one of the few outright bullish signals in the entire dataset across all three timeframes. The Stochastic with K at 30.89 below D at 38.17 leans bearish, while ADX at 17.57 still signals weak trend conditions. The 4H chart is effectively a neutral setup with a mild bearish bias, and that lone MACD positive reading deserves attention precisely because it stands alone against a sea of bearish or neutral signals.
The daily chart is where conviction finally appears - and it is not encouraging for euro bulls. The daily trend is bearish with 84% strength. RSI at 36.63 is approaching but not yet at the classic oversold threshold. MACD runs negative, below its signal line, and declining. The daily Stochastic with K at 20.02 just below D at 21.13 is deep in oversold territory but the cross has not yet turned bullish. ADX at 18.45 remains weak, which is actually a silver lining of sorts: without ADX confirmation above 25, even the bearish daily trend lacks the muscle to drive a sustained breakdown. A trend that is bearish but lacks momentum is a trend that can reverse quickly on a catalyst.
The 4-hour MACD is positive while the daily MACD is negative - a genuine timeframe conflict that prevents a clean directional call. Until one timeframe capitulates to the other, expect choppy, range-bound EURUSD price action rather than a sustained directional trend. The EURUSD market sentiment is authentically divided right now, and trading with conviction in either direction without confirmation is the fast route to a stopped-out position.
Why the 1.1571 Level Is the Line Every Trader Is Watching
The daily resistance at 1.1571 is not just a pivot calculation number. It represents the zone where recent selling pressure has consistently overwhelmed buyers, and it aligns closely with the upper end of today's daily range at 1.1572. For EURUSD support and resistance traders, this level carries outsized importance because a clean daily close above it would be the first meaningful challenge to the 84% bearish daily trend structure.
Below current price, the first meaningful floor sits at the daily S1 of 1.1519. This level has held on recent tests and represents the zone where dip buyers have historically stepped in. A convincing daily close below 1.1519 would be a meaningful bearish development - it would break a support that has been relevant in recent sessions and open the path toward 1.1497 (daily S2). Should selling accelerate through 1.1497, the next destination is 1.1468 (daily S3), which aligns with a broader range of support established during the pair's last meaningful leg lower.
Above the current price, the sequence of resistance is also worth mapping for EURUSD key levels awareness. After 1.1571 comes 1.1600 - a psychologically significant round number that tends to attract option-related selling - and then 1.1622 (daily R3), which would represent a genuine trend-reversal challenge. Getting to 1.1600 from 1.1545 requires breaking 1.1571 on a daily close. Getting to 1.1622 requires dismantling what is currently an 84% bearish trend signal. Neither is impossible, but both require a fundamental catalyst, not just a technical bounce.
ECB vs Fed: The Policy Divergence That Keeps Coming Back
The fundamental driver behind EURUSD's longer-term softness is a story of policy divergence - but it is more complicated than the textbook version. Yes, US inflation running at a three-year high complicates any near-term Fed rate cut narrative. Yes, that is dollar-supportive. But the ECB faces its own pressures that prevent a straightforward sustained euro decline, and those pressures are not fully priced into the 1.1545 level right now.
European inflation has been running closer to the ECB's 2% target, which gives the central bank room to consider further easing. Any credible ECB easing signal would widen the interest rate differential with the Fed and add meaningful downside pressure to the euro. The core EURUSD forecast debate right now is essentially a question of timing: how long before the ECB moves, and will the Fed's inflation fight delay any potential pivot long enough to create sustained dollar dominance?
The Bank of Canada's decision to hold its policy rate at 2.25% on Wednesday adds relevant context to this narrative. The BoC cited the need to 'balance' competing risks from oil prices and trade uncertainty - a phrase that captures the exact dilemma facing European policymakers as well. Major central banks outside the US are in a holding pattern, uncertain about the next directional move. The Fed, by contrast, faces the opposite challenge: a hot economy making rate cuts look premature. That divergence is not new information, but it reasserts itself every time a data print like Tuesday's CPI lands.
The SP500 at 6,572.87, up 0.74% on the session, adds another layer. Equities rallying despite hot inflation signals that markets are still operating in a 'good news is good news' environment for risk assets. That dynamic is mildly supportive for the euro as a higher-beta currency relative to the safe-haven dollar. But the relationship between euro strength and equity risk appetite is tenuous: the moment equity optimism fades, the flight-to-dollar dynamic reasserts itself quickly, and EURUSD bears are standing ready to press the 1.1519 support.
German Data as the Potential Catalyst EURUSD Needs
The focus on German economic data is well-placed given the technical setup. Germany remains the engine of the eurozone, and its readings carry outsized weight for ECB policy expectations. When German industrial output, sentiment surveys, or inflation data surprises to the upside, the euro tends to receive a fundamental tailwind that technical levels alone cannot manufacture.
The setup heading into German data is interesting from a positioning perspective. With EURUSD sitting in technical no-man's land - daily trend bearish but momentum weak, 4H MACD positive but Stochastic declining - a German data beat could be the asymmetric catalyst that forces a rapid positioning adjustment. Phrased differently: if the market is positioned moderately short the euro based on the bearish daily signals, even a modest positive surprise from German data could trigger short-covering that takes EURUSD from 1.1545 back toward 1.1571 resistance in a hurry. Short squeezes in low-momentum environments tend to be faster and more violent than the underlying fundamental justification warrants, because the stops are clustered tightly near key technical levels.
Conversely, a weak German reading would validate the bearish daily trend and likely see sellers accelerate the move toward the 1.1519 support. The directional risk around German data is asymmetric in the near term - given how much bearish news has already been absorbed, the upside reaction to a positive surprise is likely to be sharper than the downside reaction to a negative one. That is a probabilistic view, not a trading signal, and it should not substitute for confirmation before positioning.
EURUSD Price Forecast: Three Paths From Here
Bearish Continuation; Dollar Dominance Extends on Persistent Inflation
50% ProbabilityBullish Recovery; German Data Triggers Short-Covering Rally
30% ProbabilityConsolidation Grind; Low ADX Keeps Price Range-Bound
20% ProbabilityWhat Different Trader Types Should Watch on EURUSD Right Now
Short-term scalpers working the 1-hour chart have a range-trading setup between the 1H S1 at 1.15383 and the 1H R1 at 1.15453 - a tight 7-pip range that reflects just how compressed near-term price action is. The 1H ADX at 12.32 confirms this is a fader's market at the micro level: sell near 1H resistance, cover near 1H support, and keep position sizing modest because a sudden breakout fueled by a European data release could catch short-term traders badly offside. The 1H Stochastic with K at 62.71 below D at 68.79 is a mild sell lean for scalpers, but it is far from a high-conviction entry signal at current compression levels.
Swing traders watching the daily timeframe have a cleaner story to follow but require patience. The daily bearish trend at 84% strength is not noise - it is a persistent signal that the path of least resistance remains lower. But the ADX at 18.45 is too weak to justify aggressively shorting into the current level without confirmation. A daily close below 1.1519 with ADX beginning to climb toward 25 would be the swing trader's ideal trigger for a structured short targeting 1.1497 and then 1.1468. Until that confirmation arrives, the daily chart argues for watching rather than acting. The daily Stochastic at oversold levels (K at 20.02) also argues for not chasing the short side here - oversold conditions, even in a bearish trend, tend to produce at least a near-term bounce before the trend resumes.
Longer-term macro traders are focused on the ECB-Fed interest rate differential. If upcoming eurozone inflation data keeps tracking near target while US inflation stays elevated, the interest rate argument continues to favor dollar strength and EURUSD pressure. That multi-week headwind is a well-known consensus trade, and consensus trades invite violent reversals when even modestly bullish data surprises land. Macro traders holding short EURUSD exposure should note that the pair's refusal to sell off hard on a three-year high US CPI print is a yellow flag - not a reversal signal, but a sign that the bearish consensus needs fresh catalysts to extend the move beyond 1.1468.
With ADX below 20 on all three timeframes simultaneously, the current EURUSD setup is a volatility compression event. Historically, when ADX contracts to these levels across multiple timeframes in a pair with a clear directional trend bias, the eventual breakout tends to be swift and sizeable. The question is not whether volatility returns - it is which direction the breakout resolves. Monitoring ADX for a rise above 20 on the 4H chart will be one of the cleaner early signals that the next directional move has begun.
Frequently Asked Questions: EURUSD Analysis
What happens to EURUSD if price breaks below the 1.1519 support level on a daily close?
A daily close below 1.1519 (Daily S1) would confirm a continuation of the bearish trend that already shows 84% strength on the daily timeframe. This development would likely accelerate selling toward the next technical floor at 1.1497 (Daily S2), and potentially 1.1468 (Daily S3) if momentum picks up and ADX begins rising above 20. The significance of 1.1519 is that it has acted as a recent pivot level where buyers have previously stepped in, so a clean break below it removes that buyer base from the market structure.
Is the daily RSI at 36.63 a buy signal for EURUSD given the current oversold conditions?
Not in isolation. While RSI at 36.63 approaches the classic oversold threshold of 30, a single indicator reading is insufficient justification for a counter-trend long in a pair showing 84% daily bearish trend strength. The daily Stochastic at K=20.02 adds to the oversold picture, but the MACD remains negative and ADX at 18.45 shows no trend exhaustion signal yet. Confirmation for a counter-trend long requires either a bullish reversal candle on the daily chart or a fundamental catalyst - such as a German data beat - to justify going against the prevailing trend bias.
Why did EURUSD barely react to the US CPI three-year high of 0.5% month-on-month in May?
The muted reaction to the strong CPI print reflects a 'sell the rumor, buy the fact' dynamic that played out across the prior trading sessions. The euro had already absorbed a sharp sell-off driven by the strong US employment report, and by the time the CPI data landed, the dollar-positive repricing was largely complete. Market reporting noted the euro was already showing 'signs of a modest recovery following a sharp decline,' confirming that short positioning had become crowded enough to absorb the inflation headline without triggering fresh selling pressure.
What resistance level must EURUSD clear to shift the daily trend from bearish to a more neutral or bullish outlook?
A convincing daily close above 1.1571 (Daily R1) is the minimum requirement to begin challenging the current bearish trend structure. That level aligns with the upper boundary of today's trading range and represents the zone where recent selling has consistently overrun buyers. From there, a sustained move toward 1.1600 (Daily R2) and 1.1622 (Daily R3) would be needed to shift the multi-timeframe bias, as the daily trend currently shows 84% bearish strength driven by negative MACD, declining Stochastic, and Bollinger bands positioned below their middle band.
| Indicator | Value | Signal | Interpretation |
|---|---|---|---|
| RSI (14) - 1H | 49.62 | Neutral | Midpoint - no directional conviction on hourly |
| RSI (14) - 4H | 46.36 | Neutral | Below midpoint, mild bearish lean developing |
| RSI (14) - 1D | 36.63 | Approaching OS | Bearish tendency, watching for oversold bounce |
| MACD - 4H | Positive | Bullish | Above signal line - the lone bullish signal in dataset |
| MACD - 1D | Negative | Bearish | Below signal line, declining momentum on daily |
| Stochastic - 1H | K=62.71, D=68.79 | Bearish Cross | K below D, near-term selling bias |
| Stochastic - 1D | K=20.02, D=21.13 | Oversold | Deep oversold but no bullish cross yet |
| ADX - 1H | 12.32 | No Trend | Below 20 threshold - range conditions prevail |
| ADX - 4H | 17.57 | Weak Trend | Insufficient strength for confident trend trade |
| ADX - 1D | 18.45 | Weak Trend | Bearish bias without momentum confirmation |
Track markets in real-time
AI-powered analysis, technical indicators and real-time price data.
Join Our Telegram Channel
Breaking market news, AI analysis and trading signals instantly.
Join Channel