Gold has entered a critical phase, hovering around the $4,217 mark as the market grapples with conflicting signals from geopolitical developments and the looming specter of inflation data. This past week saw significant price action, with gold experiencing a sharp decline followed by a partial recovery, leaving traders at a crossroads. The narrative is complex, balancing optimism from potential de-escalation in the Middle East against persistent concerns about economic stability and central bank policies. Understanding the interplay between these factors is paramount for navigating the current volatility. As we head into the weekend, the $4,217 level for XAUUSD represents not just a price point, but a battleground where the bulls and bears are locked in a strategic contest, awaiting the next catalyst.
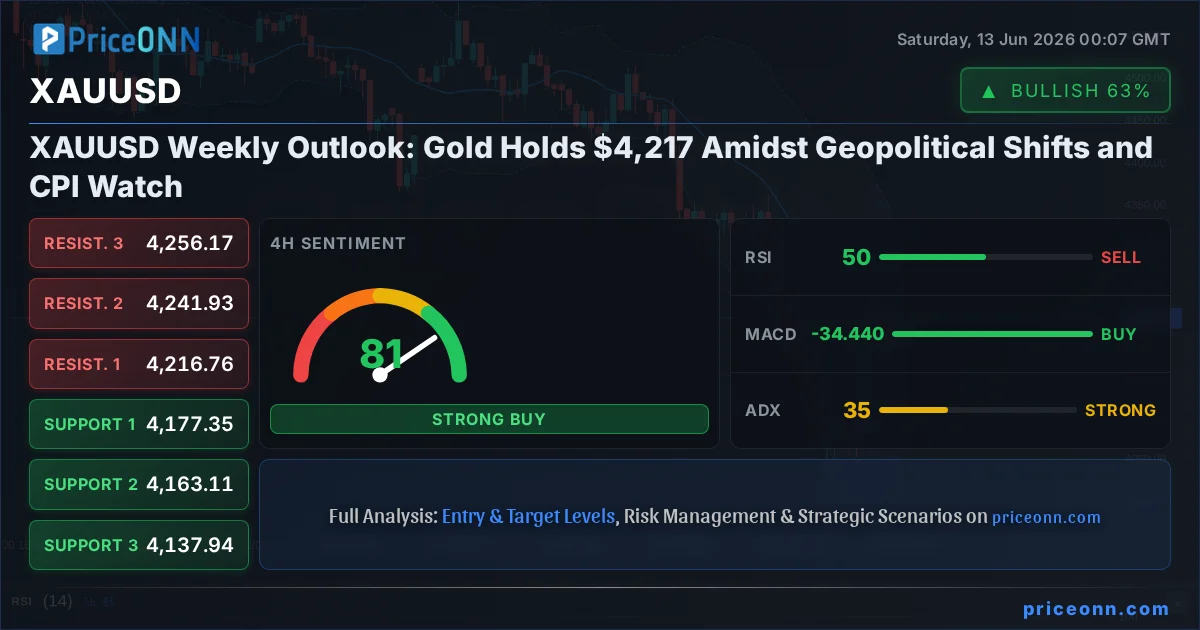
- XAUUSD is currently trading around $4,217.03, reflecting a neutral to cautiously optimistic sentiment after a volatile week.
- The RSI at 59.39 on the 1H chart signals neutral momentum with an upward bias, while the 1D RSI at 36 suggests a potential bounce from oversold conditions.
- Critical support for gold is holding around $4,207.86, with major resistance eyed at $4,229.01.
- Geopolitical optimism regarding US-Iran relations has eased pressure on oil and potentially gold, but upcoming CPI data remains a key inflation driver.
The past week has been a masterclass in market crosscurrents for gold. After a significant plunge, XAUUSD found itself testing crucial support levels, only to stage a notable recovery. This whipsaw action underscores the sensitivity of gold prices to a confluence of factors, from shifting geopolitical sands to the ever-present inflation concerns that continue to shape central bank strategies. The ability of gold to hold its ground above the $4,200 psychological level, despite broader market pressures, speaks volumes about its enduring appeal as a safe-haven asset and a hedge against economic uncertainty. However, the path forward is far from clear, with upcoming economic data poised to dictate the next significant move.
Navigating the Geopolitical Crosscurrents
The narrative surrounding gold's recent price action is heavily influenced by evolving geopolitical landscapes. News of potential breakthroughs in US-Iran relations sent ripples across global markets, notably causing oil prices to tumble and the US Dollar Index (DXY) to experience a significant downturn. This de-escalation sentiment, if sustained, typically reduces demand for safe-haven assets like gold. However, gold’s price action has been more nuanced. While the initial reaction might suggest downward pressure, the fact that gold has managed to hold its ground, and even recover some losses, indicates underlying support driven by deeper economic anxieties. The market is weighing the immediate relief from reduced geopolitical tension against the persistent specter of inflation and the potential for renewed instability. This complex interplay means that while headline news might suggest one direction, the underlying economic fundamentals continue to provide a floor for gold.
The impact of geopolitical shifts on commodities is a well-trodden path. Historically, increased tensions in regions like the Middle East have fueled demand for gold as a hedge against supply disruptions and broader market uncertainty. Conversely, signs of de-escalation often lead to a unwinding of these safe-haven premiums. The recent optimism surrounding US-Iran relations, as reported by sources like Reuters and CNBC, has certainly put downward pressure on oil prices, a key inflation indicator. This development, if it translates into sustained stability, could theoretically reduce the inflation hedge demand for gold. However, the market’s reaction has been tempered. The DXY’s sharp decline following these reports suggests a broader risk-off sentiment reversal, which can paradoxically support gold prices as the dollar weakens. This highlights how gold’s role is multifaceted, acting not only as an inflation hedge but also as a beneficiary of dollar weakness.
Furthermore, the lingering effects of past geopolitical flare-ups and the potential for future instability mean that gold’s safe-haven status remains robust. Even as immediate tensions appear to ease, the underlying fragility of the global economic and political order continues to underpin demand. The market participants are keenly aware that geopolitical situations can change rapidly, and any renewed escalation could swiftly reignite safe-haven flows into gold. This underlying bid provides a structural support that cannot be easily dismissed by short-term positive headlines. The price action around $4,217.03 this week reflects this tug-of-war, with buyers stepping in whenever the price dips too far, anticipating that broader risks are still very much present.
The CPI Watch: Inflation's Shadow Looms
Beyond geopolitical narratives, the persistent specter of inflation continues to exert a significant influence on gold. Investors are keenly awaiting upcoming economic data, particularly the Consumer Price Index (CPI) figures, which will provide crucial insights into the inflationary environment. High inflation, or even sticky inflation, typically strengthens the case for gold as an inflation hedge. It also complicates the path forward for central banks, potentially forcing them to maintain higher interest rates for longer, or even consider further tightening. This macroeconomic backdrop is critical for XAUUSD, as it directly impacts the opportunity cost of holding non-yielding assets like gold.
With the RSI currently at 59.39 on the 1H timeframe, the indicator suggests a neutral momentum with a slight upward bias, indicating that buyers are still showing some interest. However, the 1D RSI reading of 36 paints a different picture, pointing towards oversold conditions and a potential for a rebound. This divergence across timeframes highlights the current indecision in the market. If the upcoming CPI data comes in hotter than expected, it could reignite inflation fears, potentially pushing gold prices higher as investors seek refuge. Conversely, cooler-than-expected inflation figures might dampen these concerns, allowing the focus to shift back to interest rate differentials and dollar strength, which could pressure gold.
The interplay between inflation data and central bank policy is a delicate dance. The Federal Reserve, in particular, has been walking a tightrope, aiming to curb inflation without triggering a severe economic downturn. Recent comments from Fed officials, though not directly quoted here, often emphasize a data-dependent approach. This means that the upcoming CPI report will be scrutinized for any signs that inflation is either accelerating or showing definitive signs of cooling. The market’s reaction to this data will likely be swift and significant. A stronger-than-expected inflation print could lead to a repricing of interest rate expectations, potentially boosting gold prices as the prospect of prolonged higher rates diminishes. Conversely, a significant cooling in inflation could lead to a reassessment of the Fed's hawkish stance, which might not necessarily be negative for gold if it signals a less aggressive approach to monetary policy overall.
Technical Levels and Price Action Analysis
Technically, gold is at a fascinating juncture. On the 1-hour chart, the trend is neutral with a 50% strength, showing a lack of clear direction. The RSI at 59.39 is in the neutral zone, leaning towards bullish, while the MACD indicates negative momentum with the MACD line below the signal line. Stochastic K=70.05 and D=60.43 show a bullish signal, but the ADX at 18.91 suggests a weak trend, meaning any move might lack conviction. The immediate support is noted at $4,207.86, with resistance at $4,229.01. This 1H setup suggests that while there are some bullish undertones, the overall trend is indecisive, and a breakout above $4,229 could be a key confirmation for further upside.
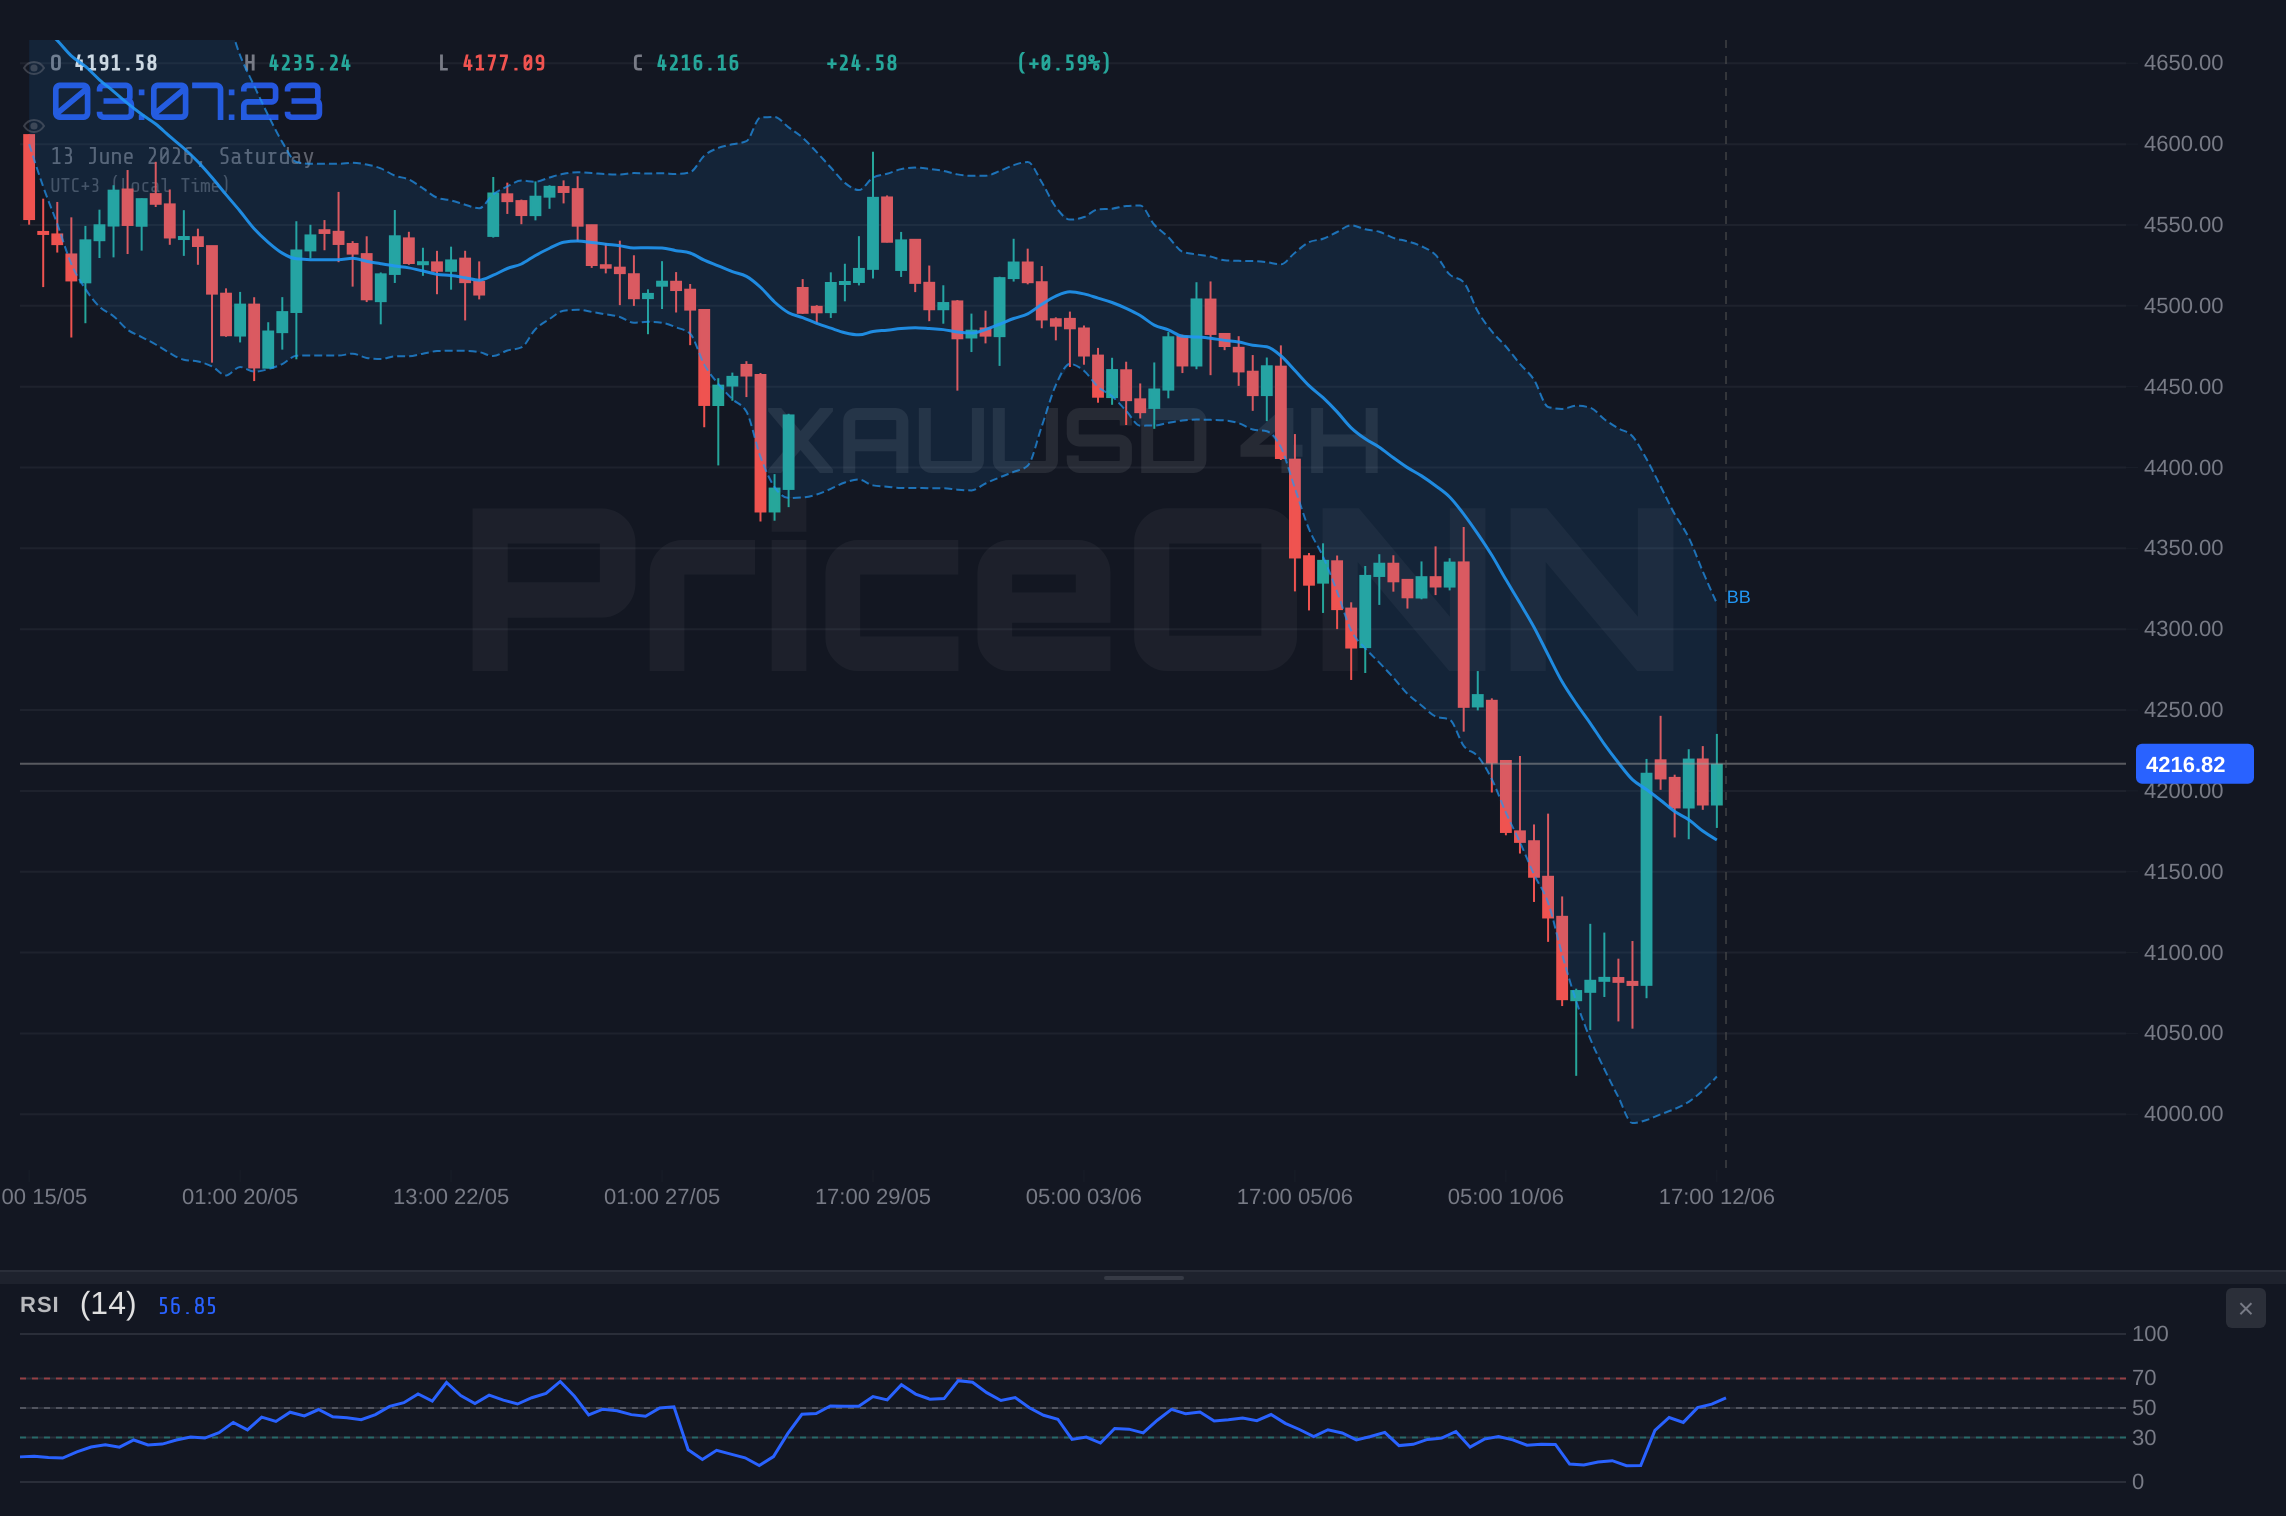
The 4-hour chart presents a more mixed picture. The trend is also neutral, but the RSI at 49.89 shows a bearish inclination, contrasting with the bullish signals from Stochastic (K=81.48, D=74.2) and MACD. The ADX at 34.61 indicates a strong trend, but its direction isn't clearly defined across all indicators. Support is found at $4,177.35, and resistance at $4,216.76. This timeframe’s data suggests a potential for consolidation or a reversal, especially if key levels are breached. The Bollinger Bands are above the middle band, showing a slight upward bias, but the conflicting signals across indicators create an environment ripe for volatility rather than a sustained directional move.
The daily chart, however, paints a decidedly bearish picture, with the trend classified as 'Düşüş' (Downtrend) with 100% strength. The RSI at 36 is firmly in the lower half of the neutral zone, indicating bearish momentum, corroborated by the MACD being below its signal line and the Stochastic (K=14.71, D=21.39) showing a clear bearish signal. The ADX at 34.06 confirms a strong downward trend. Key support levels on the daily chart are significantly lower, at $4,006.33, $3,941.47, and $3,816.02, while resistance is seen at $4,196.64. This daily perspective suggests that any short-term rallies might be opportunities for sellers to re-enter the market, especially if the price fails to decisively break through the immediate resistance.
The divergence across these timeframes is telling. The short-term charts (1H, 4H) show some signs of stabilization or even a nascent bullish attempt, potentially reacting to the geopolitical news or oversold conditions. However, the dominant daily trend remains bearish. This creates a critical scenario: can the short-term bullish pressures overcome the entrenched daily downtrend? The immediate resistance at $4,229.01 on the 1H chart and $4,216.76 on the 4H chart are key levels to watch. A sustained break and hold above these could signal a shift in momentum. Conversely, failure to break these levels, especially if accompanied by weaker-than-expected CPI data or a strengthening dollar, could see gold resume its downward trajectory towards the daily support levels.
USDJPY and DXY Dynamics: A Dollar Under Pressure?
The performance of the US Dollar Index (DXY) and USD/JPY offers crucial context for gold's price action. The DXY, currently trading around 99.8, has seen a mixed performance this week. While the daily chart shows a strong upward trend, the recent news regarding potential US-Iran de-escalation has put the dollar under pressure, causing it to retreat from its highs. This is particularly relevant for gold, as a weaker dollar typically supports higher gold prices. The correlation is clear: with the DXY at 99.8, gold's ability to consolidate around $4,217 suggests that the dollar's weakness is providing a significant tailwind.
USD/JPY, a key barometer of risk sentiment and dollar strength against the yen, is currently trading around 160.201. The daily chart indicates a strong uptrend, but the 1H and 4H charts present a more neutral to bearish picture, with the price hovering around the middle Bollinger Band and showing negative momentum on the MACD. This suggests that even as the overall dollar trend remains upward, there are pockets of weakness, particularly against currencies perceived as safe havens or those benefiting from a shift in risk appetite. The current price action in USD/JPY, coupled with the DXY’s slight pullback, reinforces the narrative that global risk sentiment is in flux, which can create opportunities for gold.
The implications of a potentially weakening dollar are significant for gold. As a dollar-denominated asset, gold becomes cheaper for holders of other currencies when the dollar falls. This can stimulate demand and drive prices higher. The current market data shows the DXY in a strong daily uptrend, yet facing resistance at 100.04. If this resistance holds, and the dollar continues to soften due to geopolitical optimism or shifting Fed rate expectations, gold could find further upward momentum. Conversely, if the DXY breaks decisively above 100.04 and the trend resumes, it would likely create headwinds for gold, even if other factors are supportive.
Equity Market Correlation: SP500 and Nasdaq's Influence
The performance of major equity indices like the S&P 500 and Nasdaq 100 provides another layer of insight into market sentiment and its potential impact on gold. The S&P 500 is currently trading at 6572.87, showing a strong upward move of 0.74% for the day. The daily chart, however, presents a bearish trend, with RSI at 45.35 and MACD in negative momentum. This discrepancy between the intraday move and the longer-term trend suggests underlying fragility in the equity markets. Similarly, the Nasdaq 100, trading at 29644.55 with a significant daily gain of 4.27%, also shows a bearish trend on the daily timeframe, with RSI at 54.74 and negative MACD momentum.
This divergence between intraday strength and daily bearish trends in equities is a critical point. If the equity markets continue to rally, it might suggest a healthy risk appetite, which could divert funds away from safe-haven assets like gold. However, the underlying bearish trends on the daily charts indicate that this rally might be unsustainable or a 'bear market rally'. In such scenarios, gold often benefits as investors seek a more stable store of value. The current market data shows the S&P 500 facing resistance at 6568.73 (1H) and 6605.07 (1D), while the Nasdaq faces resistance at 29680.64 (1H) and 28972.03 (1D). If these indices falter and reverse, it could increase demand for gold.
The fact that gold is holding its ground around $4,217 despite the intraday strength in equities suggests that investors are not entirely abandoning safe-haven assets. There might be a bifurcation of market sentiment, where some sectors are experiencing a risk-on rally while others remain cautious, favoring assets like gold. The correlation between gold and equities is not always straightforward; sometimes, gold acts as a hedge against equity market downturns, and other times, it moves in tandem as part of a broader commodity or inflation narrative. Given the conflicting signals from the equity indices’ daily charts, gold’s resilience around $4,217 could be interpreted as a sign of underlying strength, anticipating potential headwinds in the stock market.
Economic Calendar: What's Next for Gold?
Looking ahead, the economic calendar is packed with events that could significantly influence gold prices. The most critical data release in the immediate future will be the upcoming CPI figures. As discussed, any deviation from expectations could trigger substantial volatility. Beyond inflation, investors will be closely monitoring employment data, such as Nonfarm Payrolls (NFP) and unemployment rate figures, which will provide further clarity on the health of the US economy and guide Federal Reserve policy expectations. While specific dates for these releases are not provided in the current data snippet, their importance cannot be overstated.
The market's reaction to past economic data also offers clues. For instance, if previous high-impact events related to the US dollar or Eurozone showed significant deviations from forecasts, it suggests that markets are sensitive to these releases. The absence of specific past data points in the provided calendar requires us to focus on the forward-looking aspect. Upcoming high-impact events for the USD and EUR will be key. If these releases indicate economic strength, particularly in the US, it could support the dollar and potentially pressure gold. Conversely, signs of economic weakening could bolster gold's appeal. The current data shows a lack of specific dates for these high-impact events, emphasizing the need for traders to stay informed through real-time news feeds.
The role of central bank policy, particularly from the Federal Reserve, remains a dominant theme. While no specific Fed meeting dates are listed, the market's interpretation of inflation and employment data will heavily influence expectations regarding future interest rate decisions. If inflation remains stubbornly high, the Fed might be forced to maintain a hawkish stance, which could strengthen the dollar and weigh on gold. However, if inflation shows signs of cooling, or if economic growth falters, the Fed might pivot towards a more accommodative stance, which would likely be bullish for gold. The current technical indicators, especially on the daily chart, suggest that gold is still under pressure, but a favorable CPI print or a dovish shift in Fed expectations could provide the catalyst for a reversal.
Scenario Analysis: Positioning for the Week Ahead
Bearish Scenario: Consolidation Below Resistance
60% ProbabilityNeutral Scenario: Range-Bound Volatility
30% ProbabilityBullish Scenario: Breakout Confirmation
10% ProbabilityFrequently Asked Questions: XAUUSD Analysis
What happens if XAUUSD breaks below $4,207.86 support amidst rising DXY?
A break below $4,207.86, especially if coupled with a strengthening US Dollar Index (DXY) above 100, would likely signal a resumption of the bearish trend. The immediate target would then be the 1D resistance turned support at $4,196.64, with further downside potential towards $4,177.35.
Should I buy XAUUSD at current levels of $4,217.03 given the mixed 1H and 4H signals?
Buying at current levels carries risk due to the prevailing bearish trend on the daily chart. While 1H and 4H charts show some bullish signals, confirmation is needed. A more prudent approach might be to wait for a clear break above $4,229.01 resistance with strong volume, or a confirmed bounce from the $4,207.86 support level, ideally with supportive CPI data.
Is the RSI at 59.39 on the 1H chart a buy signal for XAUUSD right now?
An RSI of 59.39 on the 1-hour chart is considered neutral, leaning slightly bullish, but it is not a definitive buy signal on its own. While it indicates upward momentum is present, the overall trend on the daily chart remains bearish. Confirmation from other indicators and price action breaking key resistance levels would be necessary for a conviction buy signal.
How will the upcoming CPI data affect XAUUSD this week?
Significantly higher-than-expected CPI data could reignite inflation fears, potentially leading to a dovish reassessment of Fed rate hike expectations. This scenario would likely boost XAUUSD towards $4,242.66 and beyond. Conversely, cooler inflation prints could strengthen the dollar and pressure gold downwards towards $4,196.64.
Volatility creates opportunity - those prepared will be rewarded.
While the technical picture remains mixed and economic data releases introduce uncertainty, disciplined risk management and a focus on key levels will be crucial. Patience is key; waiting for clear setups around critical price points like $4,217.03 is the most strategic approach in this environment.
Technical Outlook Summary
| Indicator | Value | Signal | Interpretation |
|---|---|---|---|
| RSI (14) | 59.39 | Neutral | Neutral momentum, slight upward bias on 1H; oversold on 1D. |
| MACD | Negative momentum | Bearish | MACD below signal line on 1H and 1D suggests weakening upside. |
| Stochastic | K=70.05, D=60.43 | Bullish | Bullish crossover on 1H, but overbought on 4H. |
| ADX | 18.91 | Weak Trend | Low ADX indicates a lack of strong directional trend, favoring range-bound or choppy price action. |
| Bollinger | Middle Band | Bullish Bias | Price above middle band on 1H and 4H suggests some buying pressure. |
Key Levels
Support Levels
Resistance Levels
Track markets in real-time
AI-powered analysis, technical indicators and real-time price data.
Join Our Telegram Channel
Breaking market news, AI analysis and trading signals instantly.
Join Channel