Gold is currently trading at $4,091.30, a significant drop of -3.94% today, as a potent combination of a strengthening US Dollar and waning risk appetite puts downward pressure on the precious metal. The price action below $4,100 signals a shift in sentiment, with traders keenly awaiting upcoming inflation data that could dictate the next major move. This analysis delves into the intricate web of market correlations, technical indicators, and macroeconomic drivers shaping the short-to-medium term outlook for XAUUSD, exploring potential scenarios and key levels to watch.
- XAUUSD RSI at 42.19 indicates a neutral stance with a downward lean on the 1-hour chart, while daily RSI at 24.84 signals oversold conditions offering potential buying opportunities.
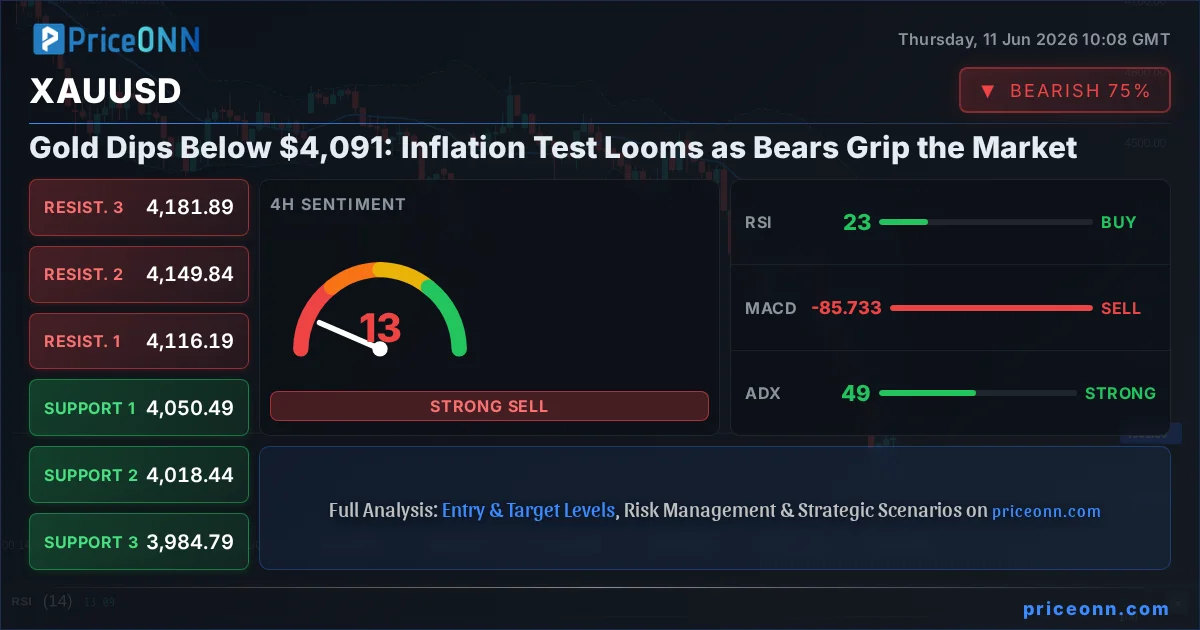
- Critical support for XAUUSD lies at $4,075, with further levels at $4,065.65 and $4,046.97. Resistance is observed at $4,103.03, $4,121.71, and $4,131.06.
- The ADX indicator shows a strong downtrend, with values of 36.13 (1H), 49.06 (4H), and 31.83 (1D), suggesting significant bearish momentum is in play.
- The strengthening US Dollar Index (DXY) at 99.86 is exerting pressure on gold, a common inverse correlation observed in market dynamics.
The Bearish Grip Tightens: Why XAUUSD is Under Pressure
Navigating the Downtrend: Technical Signals and Market Sentiment
The current technical picture for XAUUSD paints a predominantly bearish canvas across multiple timeframes. On the 1-hour chart, the trend is neutral but leaning towards a decline, with the RSI at 42.19 hovering in neutral territory, showing a clear downward trajectory. MACD, however, displays positive momentum with its signal line above, creating a slight conflict, while Bollinger Bands suggest a bearish inclination by trading below the middle band. The Stochastic Oscillator offers a glimmer of hope with a reading of K=68.31 and D=67.44, indicating a potential bullish signal as %K is above %D, but this is overshadowed by the strong bearish ADX of 36.13, confirming a robust downtrend. The aggregate signal leans heavily towards a 'SELL' across this timeframe, with 6 SELL, 2 BUY, and 0 NEUTRAL recommendations.
Stepping back to the 4-hour chart, the bearish trend is undeniable, with a 100% trend strength. The RSI at 23.01 plunges into oversold territory, typically signaling a potential buying opportunity, a sentiment echoed by the Stochastic oscillator where %K (22.62) has crossed above %D (9.59). Yet, the MACD remains firmly in negative momentum, below its signal line, and Bollinger Bands continue to hug the lower band, reinforcing the downward pressure. Crucially, the ADX at 49.06 signifies an extremely strong downtrend, making any counter-trend moves highly risky. The 4-hour chart echoes the 1-hour's sentiment, with a strong 'SELL' signal (6 SELL, 2 BUY, 0 NEUTRAL).
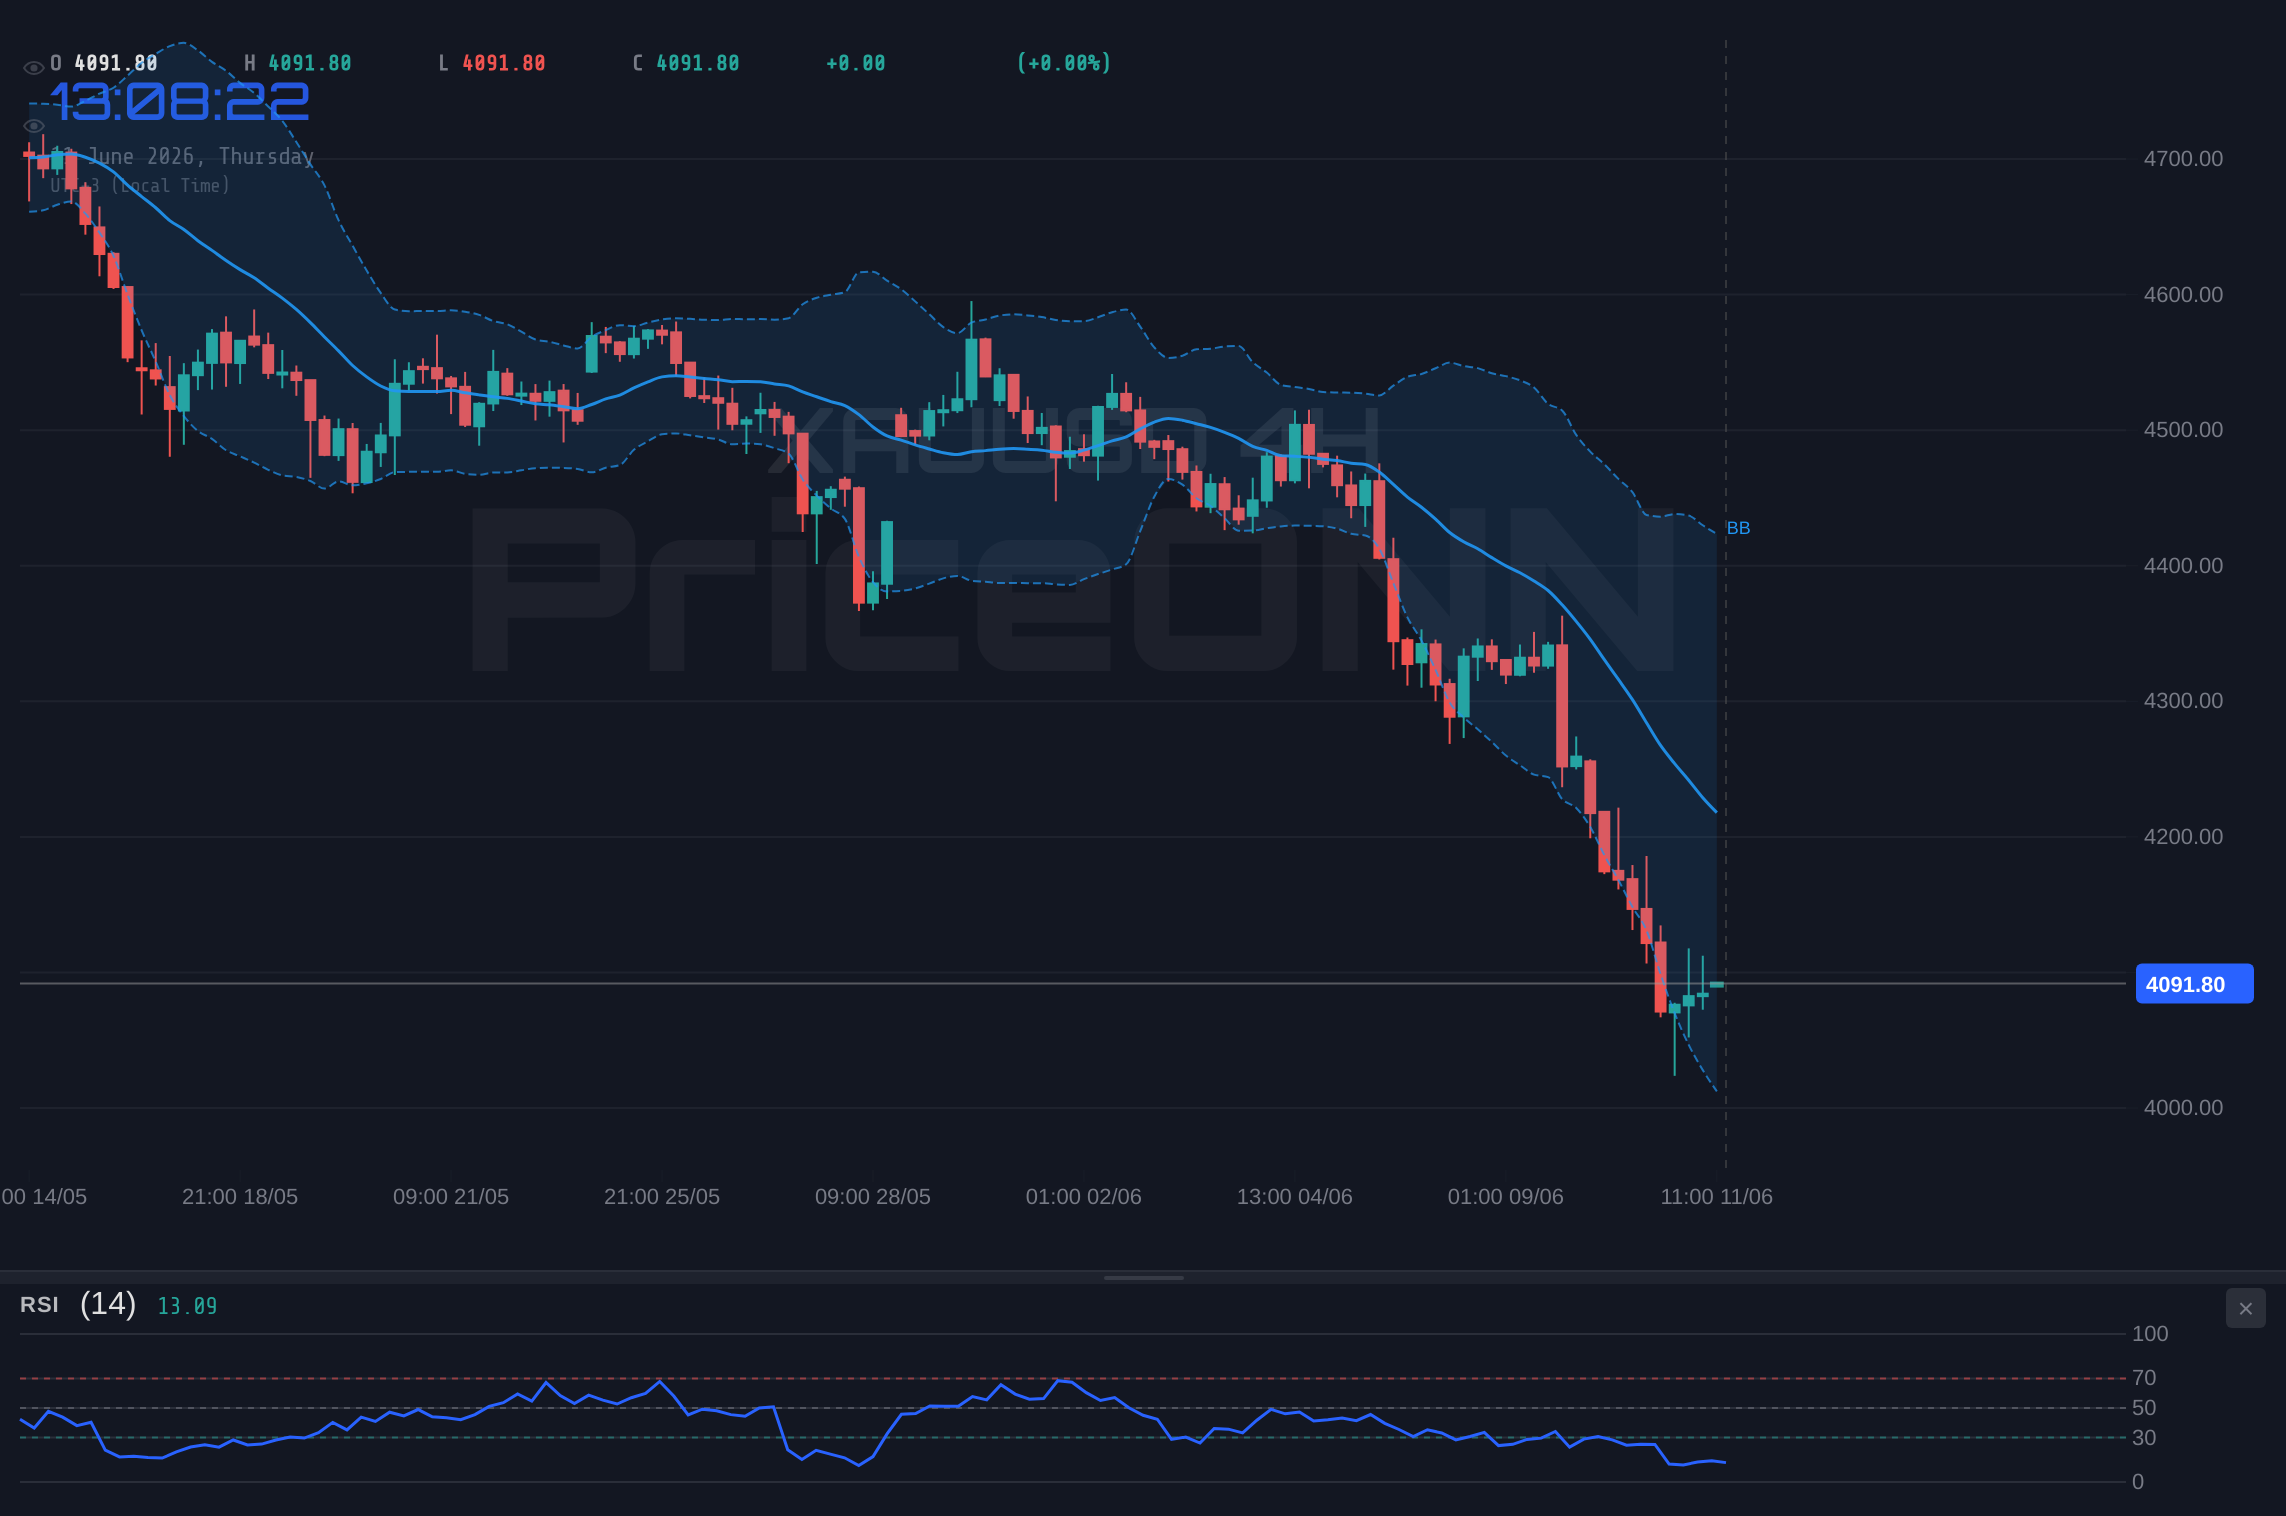
The daily chart reinforces this bearish outlook, displaying a 100% strength downtrend. The RSI at 24.84 is deeply oversold, presenting a classic 'buy the dip' scenario for contrarian traders, a view somewhat supported by the Stochastic oscillator's rising %K (9.86) above %D (26.6) – though %K is still very low. MACD continues to show negative momentum, and the Bollinger Bands are trading below the lower band, indicating extreme selling pressure or a potential breakout to the downside. The ADX at 31.83 still points to a strong trend, albeit less intense than the 4-hour reading. Despite the oversold indicators, the overwhelming signal across timeframes, particularly the daily's 7 SELL, 1 BUY, and 0 NEUTRAL recommendations, suggests that the path of least resistance for gold remains downwards in the immediate term.
The Dollar's Ascent and Its Shadow Over Gold
The current market environment is heavily influenced by the performance of the US Dollar Index (DXY), which is showing strength, currently trading at 99.86 and moving upwards. This inverse correlation between the dollar and gold is a well-established phenomenon. As the DXY strengthens, it implies a higher demand for US dollars, often driven by factors such as higher US interest rate expectations, safe-haven flows into US assets, or a general 'risk-off' sentiment in global markets. When the dollar becomes more expensive relative to other currencies, commodities priced in dollars, like gold, become less attractive to buyers holding those other currencies, thus putting downward pressure on their prices. The DXY's upward trajectory today, reflected in its 0.15% daily gain, directly contributes to the selling pressure seen in XAUUSD. The 1-hour DXY chart shows a bullish trend with RSI at 63.46 and Stochastic in the overbought zone, suggesting further dollar strength could be on the horizon, which would likely exacerbate the weakness in gold.
This dynamic is further amplified by the broader market's risk appetite. The SP500 and Nasdaq, key indicators of risk sentiment, are showing mixed signals today. The SP500 is up 0.74% to 6572.87, while the Nasdaq is down 0.82% to 28857.61. This divergence suggests a cautious market, where tech-heavy Nasdaq is facing headwinds, potentially indicating a preference for safer assets or a rotation out of growth stocks. Historically, a decline in major equity indices often leads to increased demand for safe-haven assets like gold. However, the current strength of the dollar seems to be overriding this safe-haven bid for gold, a critical point for traders to note. If the equity markets were to experience a sharper downturn, we might see a shift where gold benefits from safe-haven flows despite dollar strength, but for now, the dollar's dominance is the primary narrative.
Inflationary Headwinds: The Looming CPI Test
The market is on tenterhooks ahead of crucial US inflation data. Today’s economic calendar, although listing 34 events, has 9 high-impact releases, with USD-denominated data likely to be the most influential. While specific 'Actual' figures are not provided for today's key releases (like the USD data with previous values of 4.02, 0.6, 0.4, 3.8, 1.4), the anticipation of these numbers is already shaping market behavior. Yesterday's news indicates that headline US CPI climbed to a three-year high of 0.5% month-on-month in May, meeting expectations. This already elevated inflation backdrop sets the stage for today's figures. If today's CPI data comes in higher than expected, it could reinforce the narrative of persistent inflation, potentially leading central banks to maintain or even increase interest rates for longer.
Such a scenario would be a double-edged sword for gold. On one hand, higher inflation often fuels demand for gold as an inflation hedge. On the other hand, higher interest rates increase the opportunity cost of holding non-yielding assets like gold, making them less attractive compared to interest-bearing assets. The market's reaction will likely hinge on how the Federal Reserve interprets the data. If the data suggests inflation is indeed 'sticky,' the Fed might adopt a more hawkish stance, which would likely strengthen the dollar further and cap gold's upside potential, even if inflation itself is rising. Conversely, if the data shows signs of cooling inflation, it could pave the way for potential rate cuts sooner, which would be bullish for gold. The current bearish momentum in XAUUSD suggests the market may be pricing in a scenario where inflation remains a concern, or the Fed remains hawkish despite rising prices.
The Bull's Roadmap: Conditions for a Gold Rally
Scenario 1: Bullish Reversal - The Hopeful Path
For gold to stage a meaningful recovery, several conditions must align. The primary trigger would be a decisive close above the immediate 1-hour resistance level of $4,103.03. This breakout would need to be accompanied by strong buying volume and a clear shift in momentum indicators. A follow-through move above $4,121.71 would further solidify this bullish thesis. Crucially, this rally would likely need support from a weakening US Dollar. If the DXY fails to hold its current strength and begins to retreat, perhaps due to softer-than-expected US economic data or a shift in Fed rhetoric, it would remove a significant headwind for gold.
The invalidation point for this bullish scenario would be a decisive break below the key 1-hour support level of $4,075, and more critically, a close below the 4-hour support at $4,050.49. If price action fails to sustain gains above $4,103, it would suggest the selling pressure is still dominant. The first target for a bullish scenario, assuming a successful breakout and dollar weakness, would be the 4-hour resistance at $4,116.19, followed by a more significant test of the $4,149.84 level. A sustained move above these levels could open the door for a retest of higher daily resistance points, but this remains a less probable outcome given the current market setup. This scenario carries a lower probability, estimated at around 15-20%, given the strong bearish technicals and the dollar's current strength.
Where Bears Take Control: The Path of Least Resistance
Scenario 2: Bearish Continuation - The Dominant Trend
The most probable scenario, given the current technical and fundamental backdrop, is a continuation of the bearish trend. The trigger for this scenario is the failure of gold to reclaim the $4,103.03 resistance level on the 1-hour chart, or a decisive break below the immediate support at $4,075. A close below $4,065.65 would further confirm this bearish continuation, signaling that the sellers are firmly in control. The ADX readings across all timeframes (36.13, 49.06, 31.83) strongly support this thesis, indicating a powerful trend that is unlikely to reverse without significant catalysts.
Invalidation of this bearish continuation scenario would occur if price decisively breaks above the 1-hour resistance at $4,103.03, and more importantly, closes above the 4-hour resistance of $4,116.19, indicating a potential trend shift. The primary target for this bearish continuation would be the 4-hour support level at $4,050.49. A break below this level could lead to a swift move towards the next significant support at $4,018.44. Further downside could target the daily support at $4,082.97, which is currently below the price, indicating that the market is already testing deeper levels. This scenario is currently the most likely, with an estimated probability of 60-65%, supported by the overwhelming 'SELL' signals from technical indicators and the strong dollar.
The Waiting Game: Consolidation and Uncertainty
Scenario 3: Sideways Action - The Range-Bound Grind
While the dominant trend appears bearish, the possibility of a period of consolidation or sideways movement cannot be entirely dismissed, especially if the upcoming economic data proves to be a mixed bag, failing to provide a clear directional impetus. This scenario would be triggered if gold prices fail to break decisively below the $4,075 support level while simultaneously being capped by the $4,103.03 resistance on the 1-hour chart. Such a range-bound environment would likely be characterized by lower trading volumes and choppy price action as the market digests conflicting signals.
The invalidation for this neutral scenario would be a clear breach of either the upper resistance or lower support levels mentioned above. If price consolidates between $4,075 and $4,103, the first target would be the edges of this range. However, the strong ADX readings suggest that prolonged consolidation might be difficult to maintain. This scenario hinges on the market's indecision following the inflation data or a period of low liquidity. Given the strong trend signals, this scenario is less probable, estimated at 15-20%. The market might experience short bursts of volatility within this range, but a sustained sideways trend is unlikely without a clear resolution to the current inflationary pressures and monetary policy outlook.
The Most Likely Path: Why Bears Are Poised to Prevail
Considering the confluence of technical indicators and macroeconomic factors, the bearish continuation scenario emerges as the most probable outcome for XAUUSD in the short to medium term. The daily chart's persistent downtrend, coupled with the 4-hour chart's strong bearish momentum (ADX 49.06), indicates significant selling pressure that is unlikely to be overcome by mere oversold bounces. The strengthening US Dollar Index (DXY) at 99.86 acts as a powerful headwind, diminishing the appeal of dollar-denominated assets like gold. Furthermore, the anticipation of key inflation data, which could lead to a more hawkish central bank response, adds another layer of bearish risk.
While the daily RSI and Stochastic are in oversold territory, suggesting potential for a short-term bounce, the strength of the overall trend and the dollar's performance make such bounces likely to be short-lived profit-taking opportunities for bears rather than the start of a sustained rally. The critical levels to watch remain $4,075 as immediate support and $4,103 as resistance. A break below $4,075 could accelerate the move towards $4,050.49 and potentially lower. The risk of higher inflation figures, if realized, could prompt further monetary tightening, which historically tends to suppress gold prices. Therefore, the path of least resistance for gold appears to be downwards, at least until a clearer signal emerges from inflation data or central bank policy shifts.
What I'm Watching: Key Triggers for the Week Ahead
This week, the market's attention will be laser-focused on a few critical triggers that could determine the fate of gold prices. Firstly, the upcoming US inflation data (CPI) is paramount. A reading significantly above expectations could reinforce the bearish case by signaling persistent price pressures and a potentially longer period of higher interest rates, further strengthening the dollar and pressuring gold. Conversely, any signs of cooling inflation could provide a reprieve for gold, though the market's reaction might be muted if the Fed maintains a hawkish bias.
Secondly, the price action around the key levels of $4,075 (support) and $4,103 (resistance) on the 1-hour chart will be crucial. A decisive break and sustained hold above $4,103, especially on increasing volume and accompanied by dollar weakness, would signal a potential bullish reversal. Conversely, a firm break below $4,075, confirmed by follow-through selling and continued dollar strength, would validate the bearish continuation scenario, targeting lower levels. Finally, monitoring the broader risk sentiment, as indicated by the SP500 and Nasdaq's performance, will be important. A significant downturn in equities could, under certain circumstances, trigger safe-haven demand for gold, potentially overriding dollar strength, though this is a less likely outcome currently.
Cross-Market Dynamics: Interplay with Other Assets
The Euro's Struggle Against a Strong Dollar
The EURUSD pair is currently trading at 1.15294, showing a slight decline of -0.11% today. This pair, like gold, is heavily influenced by the strength of the US dollar. The 1-hour and 4-hour charts both indicate a bearish trend, with RSI levels in the low 40s and Stochastic oscillators showing bearish signals. The ADX values are relatively low (12.56 and 17.11), suggesting a weak trend, but the overall sentiment is negative, with strong 'SELL' signals across these timeframes. The daily chart also shows a downtrend with an RSI of 36.63. This weakness in the Euro against the dollar reinforces the narrative of dollar strength and its negative impact on riskier assets and non-dollar currencies.
The recent news flow indicates that the Euro has stabilized after a sell-off, awaiting US CPI and Bank of Canada meetings. This stabilization, however, is fragile. If US inflation data comes in hot, it could further pressure the Euro as the Fed maintains a hawkish stance, while the ECB might be perceived as needing to follow suit or risk a widening interest rate differential. This continued weakness in the Euro against the dollar is a signal of broader risk aversion and dollar demand, which indirectly supports the bearish outlook for gold by increasing the opportunity cost of holding the precious metal.
USD/JPY: A Tale of Two Currencies
The USD/JPY pair is exhibiting a strong upward trend, trading at 160.541 with a daily increase of 0.12%. This pair represents a classic risk-on scenario for the dollar against the safe-haven Japanese Yen. The technical indicators across all timeframes (1H, 4H, 1D) show a predominantly bullish signal, with RSI levels in the neutral to overbought territory (68.63 on 4H, 66 on 1D) and MACD displaying positive momentum. The Stochastic oscillators are in overbought conditions on the 4-hour and daily charts, indicating potential for a pullback, but the overall trend strength, particularly on the daily chart (93% strength), remains bullish.
The strength in USD/JPY, reaching its highest level since July 2024, directly correlates with the broader dollar strength narrative. This robust performance of the dollar against the Yen further underscores the demand for the greenback and its potential to weigh on gold prices. While the Yen is traditionally considered a safe-haven currency, its current weakness suggests that global risk appetite, despite some mixed signals in equities, is not entirely collapsing, or that the interest rate differential between the US and Japan is the dominant driver. This sustained strength in USD/JPY is a tailwind for the bearish case on XAUUSD.
Equity Indices: Mixed Signals Amidst Broader Weakness
The major US equity indices present a mixed picture. The SP500 is showing some resilience, up 0.74% to 6572.87, with a 1-hour bullish trend. However, its daily chart indicates a strong downtrend (100% strength) with an RSI at 45.35 and MACD in negative momentum. This suggests that the current intraday gains might be a temporary pullback within a larger bearish trend. The Nasdaq, on the other hand, is down 0.82% to 28857.61, showing a bearish trend on its 4-hour chart and mixed signals overall. The divergence between the SP500's intraday strength and its longer-term bearish trend, coupled with the Nasdaq's weakness, points towards underlying caution in the equity markets.
This cautious sentiment in equities, particularly the weakness in growth-oriented tech stocks (Nasdaq), could theoretically increase demand for safe-haven assets like gold. However, as observed, the current dollar strength appears to be the dominant factor, overshadowing gold's traditional safe-haven appeal. If equity markets were to experience a more significant sell-off, we might see a stronger bid for gold. But for now, the correlation suggests that while equities are not displaying strong bullish momentum, they are not yet triggering a full-blown risk-off flight to gold. The ongoing battle between inflation concerns, potential central bank responses, and equity market performance will be key determinants of gold's trajectory.
Fundamental Drivers: Inflation and Central Bank Policy
The Inflationary Crucible: What CPI Data Could Mean
The upcoming US Consumer Price Index (CPI) report is the central piece of the economic puzzle for gold traders. Historical data shows that inflation has been a persistent concern, with previous figures indicating elevated levels. If today's CPI data confirms or even exceeds expectations for rising inflation, it could trigger a significant market reaction. Higher-than-expected inflation would likely reinforce the Federal Reserve's hawkish stance, potentially leading to prolonged higher interest rates or fewer rate cuts than the market anticipates. This would increase the opportunity cost of holding gold, making it less attractive relative to interest-bearing assets, and simultaneously strengthen the US Dollar.
However, there's a complex interplay. Gold is traditionally seen as an inflation hedge. If inflation continues to climb unchecked, investors might flock to gold for protection, potentially overriding the negative impact of higher interest rates. The market's interpretation will be key: does it see rising inflation as a sign of economic overheating requiring aggressive Fed action (bearish for gold), or as a signal of underlying economic strength that gold can benefit from as a store of value (bullish for gold)? Given the current bearish technicals and dollar strength, the market seems to be leaning towards the former, anticipating a hawkish Fed response that would cap gold prices. The specific numbers from the CPI report will be critical in confirming or refuting this assumption.
Central Bank Watch: The Fed's Stance is Paramount
The Federal Reserve's monetary policy remains the most significant driver for gold prices. With inflation showing signs of persistence, the Fed is walking a tightrope. Any indication from the latest economic data, particularly the CPI report, that inflation is not cooling sufficiently could lead the Fed to maintain a hawkish bias. This means keeping interest rates higher for longer, which generally dampens demand for non-yielding assets like gold. The CME FedWatch tool, if available, would provide precise probabilities of future rate hikes or cuts, but in its absence, market participants must infer the Fed's likely reaction based on economic indicators.
A hawkish Fed environment directly supports a stronger US Dollar, which, as discussed, puts downward pressure on gold. Conversely, if inflation data surprises to the downside, it could open the door for the Fed to signal potential rate cuts sooner than expected. Such a development would weaken the dollar and reduce the opportunity cost of holding gold, likely providing a significant boost to the precious metal. The market is currently pricing in a certain path for monetary policy, and any deviation from these expectations, driven by inflation data or Fed commentary, could lead to sharp price movements in gold. For now, the prevailing sentiment seems to be one of caution, with the market wary of sticky inflation.
Trade Scenarios and Key Levels
Bearish Continuation: The Path of Least Resistance
65% ProbabilityConsolidation: The Waiting Game
20% ProbabilityBullish Reversal: A Glimmer of Hope
15% ProbabilityThe current market conditions, particularly the strong ADX values across timeframes and the strengthening dollar, heavily favor the bearish continuation scenario. While oversold indicators on daily charts present a potential for a short-term bounce, the prevailing trend suggests that any upward moves are likely to be met with selling pressure. Traders should remain vigilant for a break below $4,075 as confirmation of further downside, with $4,050.49 as the initial target. Conversely, a sustained move above $4,103 would require significant confirmation, including dollar weakness and robust buying volume, to be considered a genuine reversal.
What I'm Watching: Key Triggers for the Coming Days
This week, the market's focus will be squarely on the US inflation data (CPI). A higher-than-expected reading could solidify the bearish outlook for gold by signaling persistent price pressures and a potentially hawkish Federal Reserve stance, which would likely strengthen the dollar. Conversely, any indication of cooling inflation might offer a temporary reprieve, but the overall trend and dollar strength remain significant hurdles for gold.
Secondly, price action around the $4,075 support and $4,103 resistance levels on the 1-hour chart will be critical. A decisive break below $4,075, supported by continued dollar strength and negative equity market sentiment, would likely trigger further downside towards $4,050.49. A sustained move above $4,103, however, would require a combination of dollar weakness and strong buying conviction, making it a less probable outcome in the current environment. Finally, monitoring the broader risk sentiment, as reflected in the SP500 and Nasdaq, will provide context. A significant equity sell-off could theoretically boost gold as a safe haven, but the dollar's dominance currently appears to be the primary driver.
Market Snapshot and Technical Summary
| Indicator | Value | Signal | Interpretation |
|---|---|---|---|
| RSI (14) | 42.19 | Neutral | Downward lean on 1H; oversold on 1D (24.84) |
| MACD Histogram | Positive | Bullish | Momentum positive on 1H, negative on 4H/1D |
| Stochastic | K=68.31, D=67.44 | Bullish | Bullish signal on 1H; oversold bounce potential on 4H/1D |
| ADX | 36.13 | Bearish | Strong downtrend confirmed across timeframes |
| Bollinger | Middle Band Break | Bearish | Price below middle band on 1H/4H/1D, indicating downward pressure |
Frequently Asked Questions: XAUUSD Analysis
What happens if XAUUSD breaks below $4,075 support?
A break below $4,075 could accelerate the bearish trend, targeting the next support level at $4,050.49. This would be confirmed by continued dollar strength and negative market sentiment.
Is RSI at 24.84 on the daily chart a buy signal for XAUUSD?
The daily RSI of 24.84 indicates oversold conditions, suggesting potential for a bounce. However, the strong overall downtrend and dollar strength mean this could be a short-lived opportunity rather than a sustained reversal.
How will upcoming US inflation data affect XAUUSD?
Higher-than-expected inflation could strengthen the dollar and pressure gold by signaling hawkish Fed policy. Conversely, cooling inflation might weaken the dollar and support gold, but the market's interpretation of the Fed's reaction is key.
Should I consider buying XAUUSD at current levels around $4,091.30?
Given the strong bearish signals and dollar strength, buying at current levels carries significant risk. A more prudent approach would be to wait for confirmation of a bullish reversal, such as a clear break above $4,103.03, or for price to test lower support levels like $4,050.49.
Track markets in real-time
AI-powered analysis, technical indicators and real-time price data.
Join Our Telegram Channel
Breaking market news, AI analysis and trading signals instantly.
Join Channel