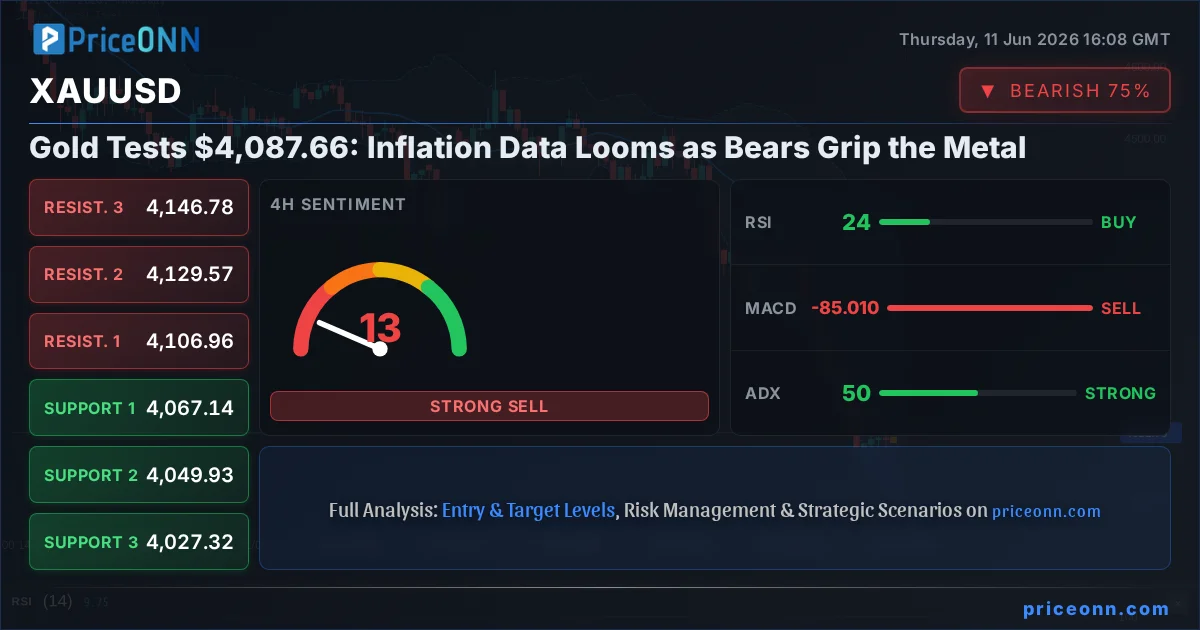
The relentless tug-of-war between bulls and bears in the gold market has reached a pivotal juncture, with the precious metal currently trading at $4,087.66. This level is not just a price point; it represents a battleground where inflation concerns clash with tightening monetary policy expectations and a strengthening dollar. As traders brace for crucial US inflation data, the technical indicators on multiple timeframes are flashing a stark warning, suggesting that the recent downward pressure on gold might be more than just a temporary pullback. The question on every trader's mind is whether this is a precursor to a deeper correction or a final capitulation before a potential rebound.
- RSI at 43.7 on the 1H chart signals waning bullish momentum, with a further dip to 22.16 on the 4H chart indicating oversold conditions that could precede a bounce, or further downside.
- Critical support for XAUUSD sits at $4,055.72 (1H) and $4,067.14 (4H), with a decisive break below these levels potentially accelerating the bearish trend.
- The MACD histogram shows mixed signals across timeframes, but the dominant ADX reading of 49.83 on the 4H chart underscores a strong existing downtrend.
- The DXY is currently trading at 100.01, exhibiting strength that typically correlates with pressure on gold prices, adding another layer of complexity to the outlook.
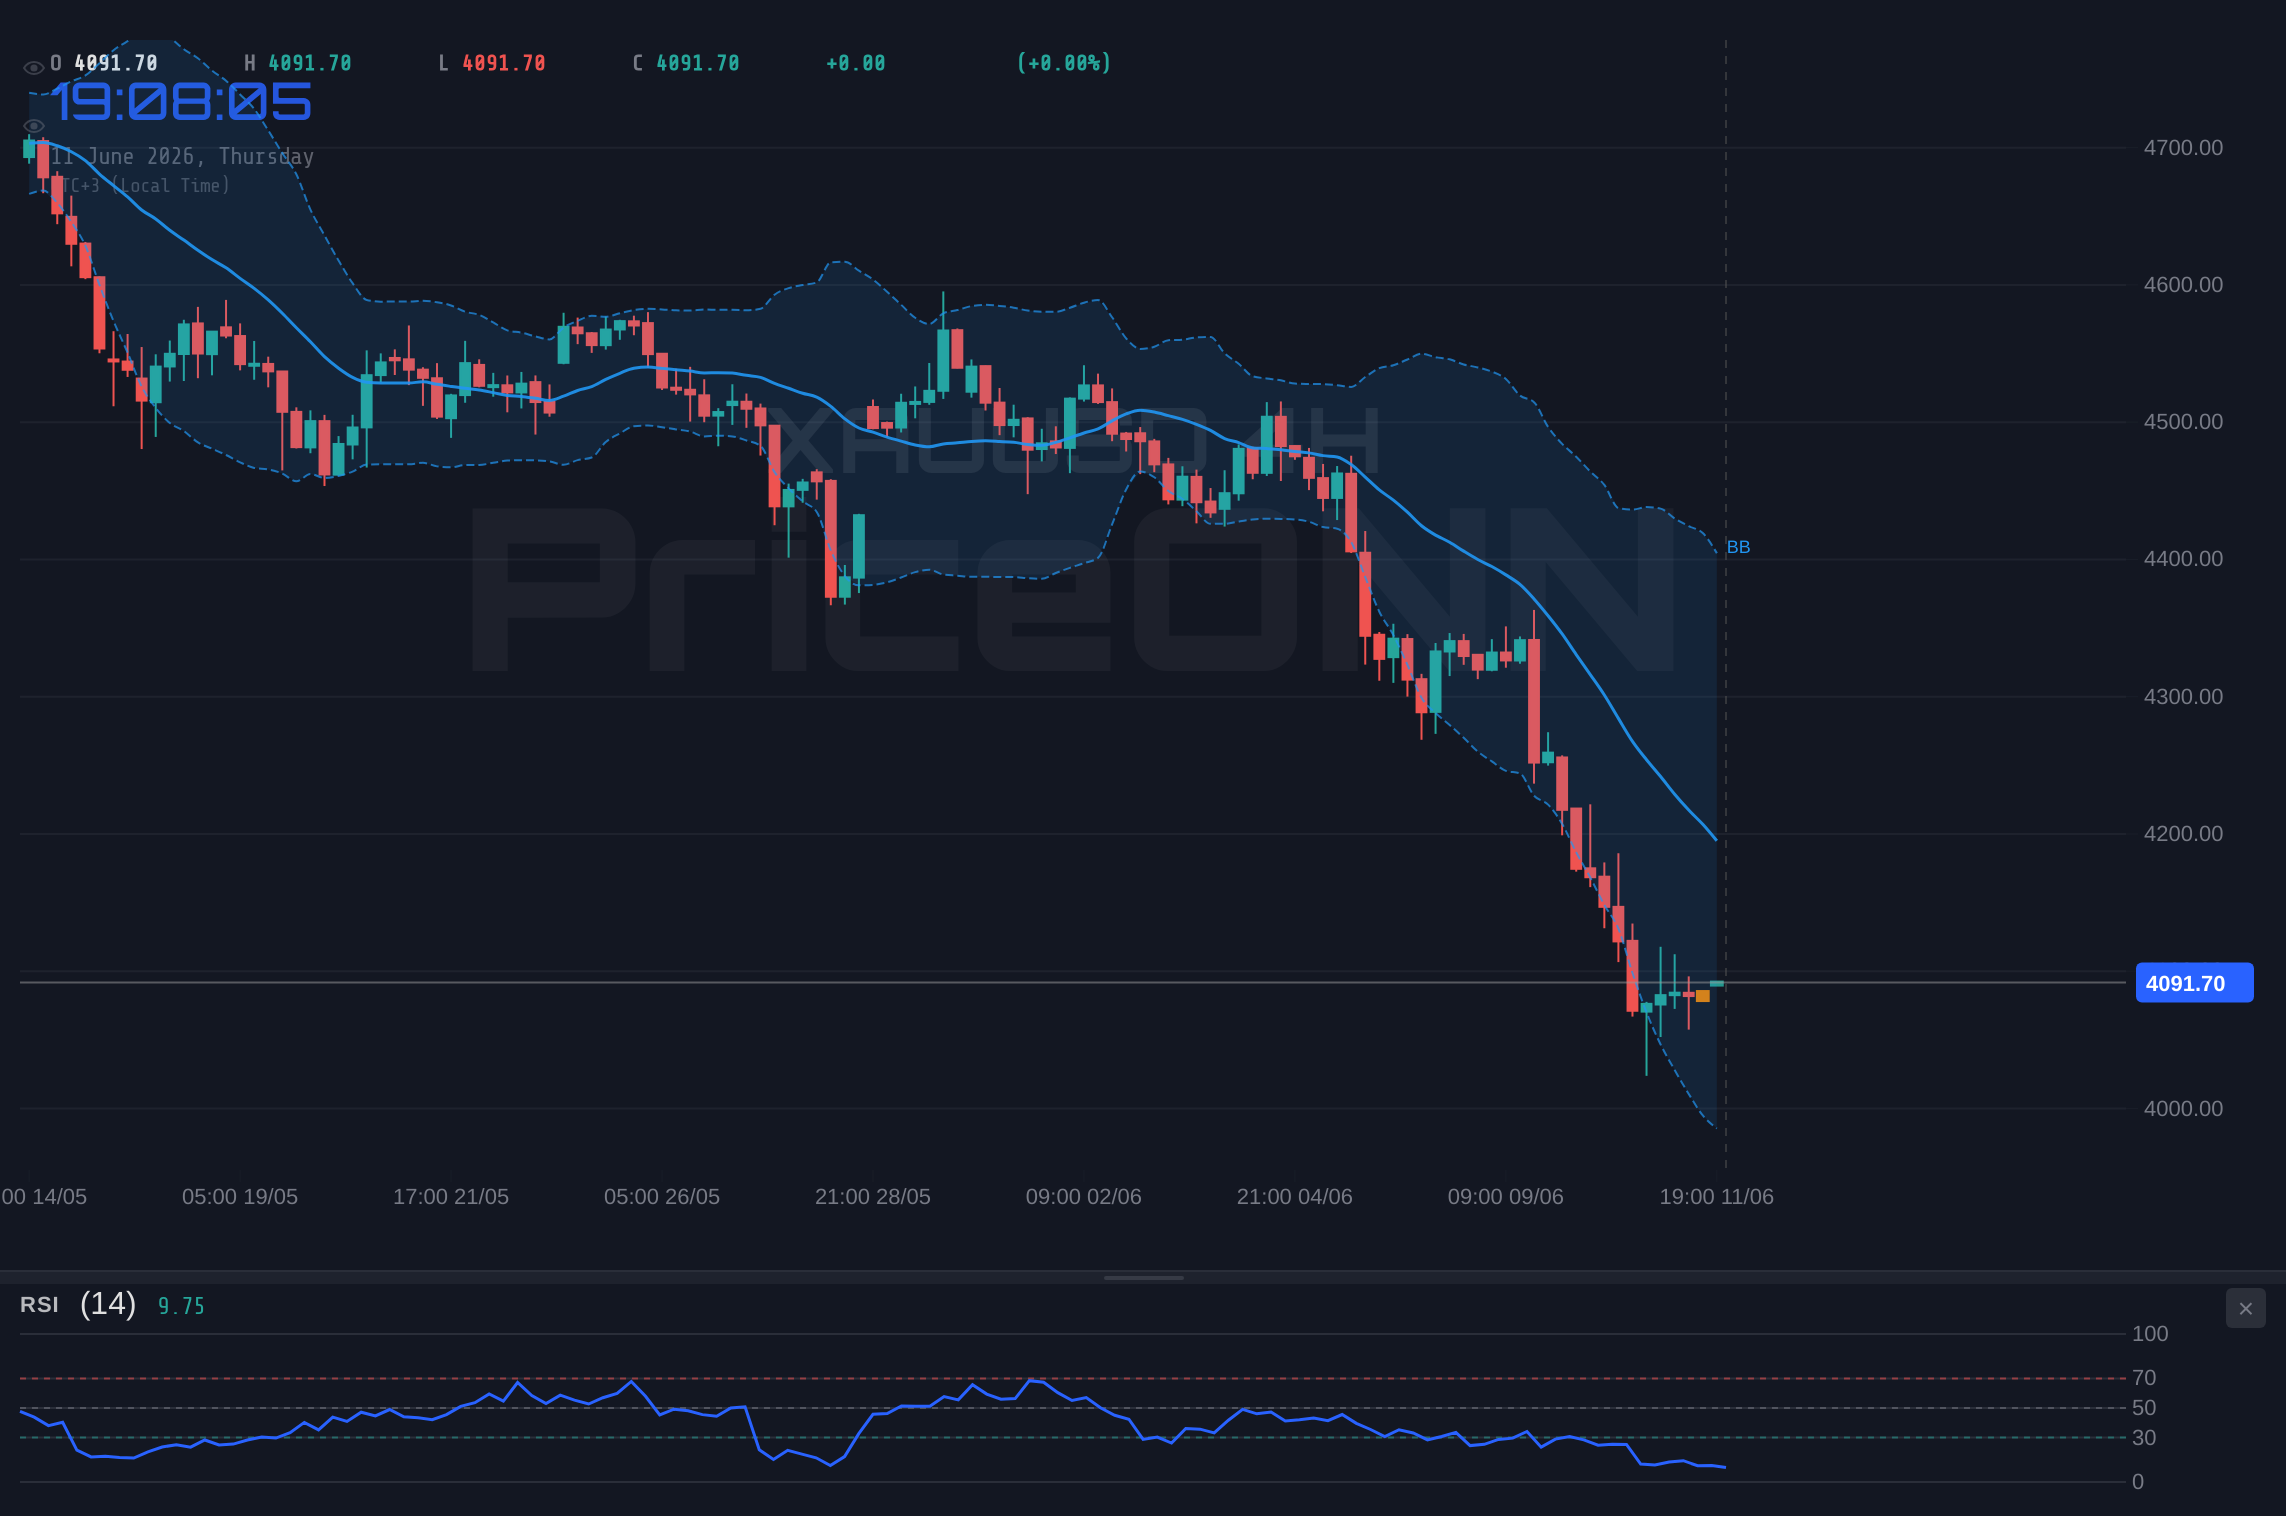
The narrative surrounding gold has been dominated by its inverse relationship with the US Dollar Index (DXY), which is currently showing renewed strength at 100.01. This resurgence in the dollar, coupled with elevated US Treasury yields, typically acts as a headwind for non-yielding assets like gold. However, the persistent specter of inflation, even if showing signs of moderation, continues to provide a floor for safe-haven demand. The recent sharp decline in gold, down 4.03% (-$171.58) on the day to $4,087.66, highlights the market's sensitivity to shifting economic data and central bank rhetoric. The daily trading range, from $4,066.93 to $4,257.24, illustrates the significant volatility currently gripping the precious metal.
The Bearish Case: Why Gold's Shine is Fading
The technical picture for XAUUSD is currently painting a predominantly bearish hue, especially when viewed across the 4-hour and daily charts. The 4H trend is unequivocally bearish with 100% strength, supported by a confluence of indicators. The RSI(14) at 22.16 is deep in oversold territory, which, while often seen as a precursor to a bounce, also signals intense selling pressure. This is further reinforced by the MACD, which is showing negative momentum with the MACD line firmly below its signal line. The Bollinger Bands are also following suit, with the price trading below the middle band, indicating a bearish inclination and potential for further downside extension towards the lower band.
Adding significant weight to the bearish argument is the Average Directional Index (ADX). On the 4-hour timeframe, the ADX stands at a formidable 49.83, a reading that signifies a very strong and established trend. While ADX measures trend strength rather than direction, in combination with the other bearish indicators, it confirms that the current downward move has substantial momentum behind it. The Stochastic Oscillator presents a slightly conflicting signal with %K (27.24) above %D (13.33), suggesting a potential short-term upward correction, but this is often a fleeting signal within a dominant downtrend. The overall signal on the 4H chart is a strong 'SELL', with 6 sell signals versus only 2 buy signals.
The daily chart reinforces this bearish outlook, albeit with a slightly less aggressive trend strength compared to the 4H. The trend is still classified as 'Düşüş' (Downtrend) with 100% strength. The RSI(14) at 24.73 remains deeply oversold, mirroring the 4H chart and suggesting that the market is heavily weighted towards sellers. The MACD continues to show negative momentum, and the Bollinger Bands are hugging the lower band, a classic sign of a strong downtrend. The Stochastic Oscillator here, however, shows %K (9.63) below %D (26.56), aligning with the bearish sentiment and indicating further potential downside. The ADX at 31.83 still points to a strong trend, though less intense than the 4H reading. The overwhelming 'SELL' signal on the daily chart (7 sells, 1 buy) cannot be ignored by any serious market participant.
The immediate price action on the 1-hour chart, while showing a 'Neutral' trend with 50% strength, is still heavily influenced by the longer-term bearish structure. Support at $4,055.72 is being eyed, and a break below this level would likely trigger further selling pressure, potentially accelerating the move towards the next support at $4,038.23. Resistance remains capped around $4,087.93, the current price acting as a thin barrier. The RSI(14) at 43.7 on this timeframe is in neutral territory but shows a slight downward inclination, aligning with the broader bearish narrative. The MACD's positive momentum here is a minor counter-signal, but it lacks the conviction to override the daily and 4H trends. The combination of a strong dollar (DXY at 100.01) and the bearish technicals paints a picture of caution for gold buyers right now.
The Bullish Counter-Argument: Opportunity Amidst the Sell-Off?
Despite the prevailing bearish sentiment, there are compelling arguments to be made for a potential bullish turn, particularly when examining the oversold conditions on longer timeframes and the underlying inflationary pressures that gold historically hedges against. The daily RSI(14) is sitting at a deeply oversold 24.73, and the 4-hour RSI is at 22.16. Historically, such extreme readings often precede significant price reversals. While these levels can be maintained for extended periods in strong downtrends, they also present attractive entry points for contrarian traders anticipating a rebound. The Stochastic Oscillator on the 4H chart, with %K (27.24) above %D (13.33), offers a hint of this potential upside, suggesting that momentum might be shifting.
Furthermore, the fundamental backdrop of persistent inflation cannot be entirely dismissed. While recent data might show moderation, the underlying concerns remain. Geopolitical tensions, such as those potentially escalating in the Middle East, often act as a catalyst for safe-haven assets. The European Central Bank's recent decision to hike interest rates by 25 basis points, while a hawkish move, was accompanied by concerns about higher inflation and lower growth, underscoring the complex economic environment. If inflation proves stickier than anticipated, or if geopolitical risks escalate, gold could find renewed strength as a traditional inflation hedge and safe haven, regardless of the dollar's immediate strength.
The 1-hour chart offers some solace to the bulls, with a 'Neutral' trend classification and a MACD displaying positive momentum. While the ADX at 17.38 indicates a weak trend on this timeframe, it also suggests that the current bearish momentum might be losing steam in the very short term. If gold can hold above the immediate support levels, particularly the 1-hour support at $4,055.72, and more importantly, manage to break through the immediate resistance at $4,087.93 (which is also the current price), it could signal a short-term recovery. The Stochastic on the 1H chart, at K=46.38 and D=49.57, is approaching a bullish crossover, which could be the spark needed for a temporary relief rally.
Weighing the Evidence: Technicals and Fundamentals
The conflict between the bearish technical signals and the potential for a bullish reversal based on oversold conditions and inflation fears is the central theme. The ADX readings are particularly telling. On the 4H chart, ADX at 49.83 screams 'strong trend', and combined with the bearish RSI and MACD, it strongly favors continuation of the downtrend. However, the daily RSI at 24.73 is an anomaly that cannot be ignored. A sustained move below 30 for such an extended period often marks exhaustion.
The correlation with the DXY is another critical factor. With the DXY at 100.01 and showing upward momentum, it exerts downward pressure on gold. If the DXY continues to climb, it will make a gold rally significantly harder. Conversely, any sign of weakness in the DXY could provide the necessary catalyst for gold to stage a recovery, especially given the oversold conditions on the daily chart. The market is clearly at a crossroads, with the upcoming inflation data poised to be the deciding factor in which direction the pendulum swings.
The breakdown in XAUUSD below key support levels has been significant. The daily support at $4,209.52 was clearly breached, and the price is now flirting with the next major support zone around $4,082.97. A failure to hold this level could open the door to further declines, targeting psychological levels and potentially much lower prices if the downtrend accelerates. On the resistance side, the $4,087.93 level is the immediate hurdle. A convincing close above this, followed by a push past $4,102.65, would be the first sign that the bears might be losing their grip. However, given the strength of the current trend, such a move would require significant conviction and likely a shift in the broader market sentiment or economic data.
The Verdict: Bears in Control, Watch for Capitulation
Looking at the confluence of indicators, the bearish case for XAUUSD currently holds more weight. The strong trend strength indicated by the ADX on the 4H (49.83) and daily (31.83) charts, combined with consistently bearish RSI and MACD signals across these timeframes, suggests that the path of least resistance is still downwards. The immediate price action at $4,087.66 is critical; a failure to decisively break higher and hold above $4,102.65 resistance would likely lead to a retest of lower support levels.
The oversold conditions on the daily chart (RSI 24.73) do present a potential for a bounce, but this should be treated with extreme caution. A true capitulation event, where sellers are finally exhausted and a sharp reversal occurs, is what bulls would be looking for. However, until we see clearer signs of weakening momentum on the longer timeframes, or a significant shift in the fundamental narrative (e.g., a dovish pivot from the Fed, or a major geopolitical escalation driving safe-haven flows), the prevailing trend suggests further downside is possible. The market is currently pricing in a strong dollar and potentially moderating inflation, which is a toxic cocktail for gold.
The immediate future for gold hinges on the upcoming inflation data. If inflation comes in hotter than expected, it could reignite safe-haven demand and provide a much-needed boost for gold, potentially triggering a short-covering rally. Conversely, softer inflation prints would likely reinforce the bearish technicals and the strong dollar narrative, pushing XAUUSD lower. Given the current technical setup, particularly the strong bearish trend on the 4H and daily charts, traders should remain vigilant. A break below $4,067.14 on the 4H chart could signal the next leg down, targeting $4,049.93 and potentially $4,027.32. Resistance at $4,087.93 and $4,102.65 will be key to watch for any signs of a sustained reversal.
Scenario Analysis: Navigating the Gold Market's Crossroads
Bearish Scenario: The Trend Continues
70% ProbabilityNeutral Scenario: Consolidation and Waiting Game
20% ProbabilityBullish Scenario: Oversold Rebound
10% Probability| Indicator | Value | Signal | Interpretation |
|---|---|---|---|
| RSI (14) | 43.7 | Neutral | Leaning bearish on 1H, deep oversold on 4H/1D |
| MACD | -171.58 | Bearish | Negative momentum on 4H/1D, mixed on 1H |
| Stochastic | K=46.38, D=49.57 | Neutral | Mixed signals, approaching crossover on 1H, bearish on 1D |
| ADX | 31.68 | Bearish Trend | Strong downtrend on 1H, very strong on 4H |
| Bollinger Bands | Middle Band | Bearish | Price below middle band on 4H/1D, above on 1H |
Frequently Asked Questions: XAUUSD Analysis
What happens if XAUUSD breaks below $4,067.14 support on the 4-hour chart?
A break below $4,067.14 would likely accelerate the bearish trend, invalidating the neutral scenario and increasing the probability of the bearish scenario playing out. The immediate downside target would then shift towards $4,055.72.
Is the RSI at 24.73 on the daily chart a buy signal for XAUUSD at $4,087.66?
While RSI at 24.73 is deeply oversold and historically suggests a potential bounce, it is not a buy signal in isolation. The strong bearish trend indicated by ADX 31.83 on the daily chart means this oversold condition could persist or worsen. A confirmed bullish reversal would require price to break key resistance levels like $4,087.93 and $4,102.65.
How does the DXY at 100.01 impact XAUUSD's trend analysis?
The DXY's strength at 100.01 exerts significant downward pressure on gold, as they typically move inversely. This strengthens the bearish case for XAUUSD, suggesting that any bullish attempts will face headwinds unless the dollar weakens considerably.
How will upcoming inflation data affect XAUUSD's price action around $4,087.66?
Hotter-than-expected inflation data could reignite safe-haven demand for gold, potentially triggering a short-covering rally and invalidating the bearish scenario. Conversely, cooler inflation would reinforce the current downtrend and dollar strength, pushing XAUUSD towards lower support levels.
Track markets in real-time
AI-powered analysis, technical indicators and real-time price data.
Join Our Telegram Channel
Breaking market news, AI analysis and trading signals instantly.
Join Channel