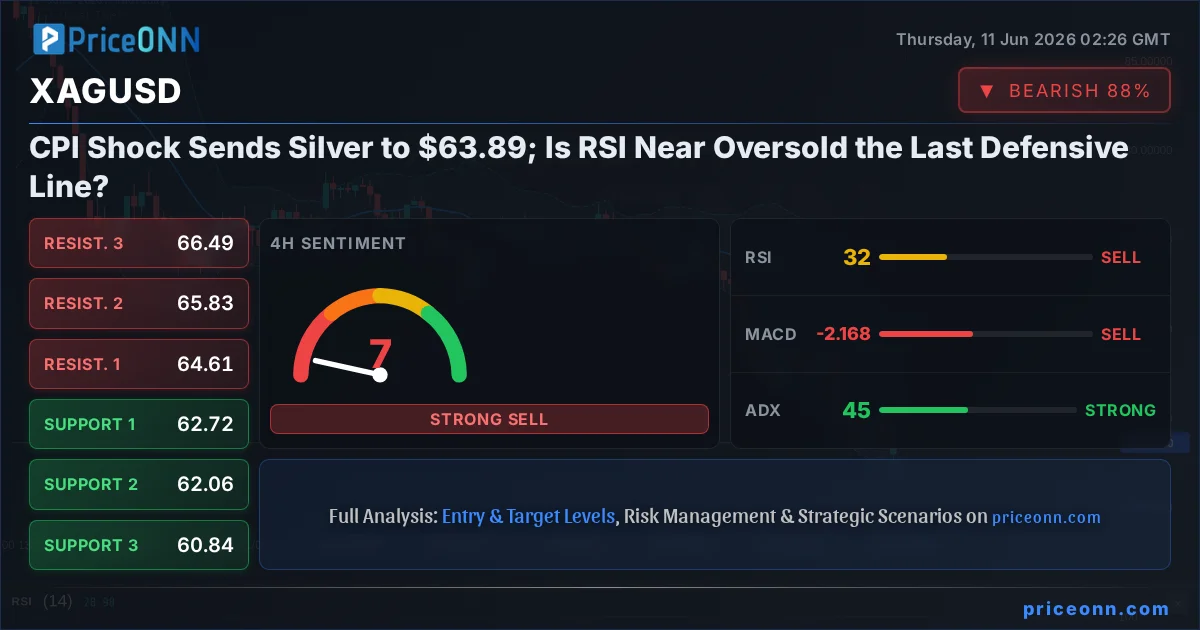
US headline inflation just climbed to a three-year high - and silver is taking the hit. With XAGUSD now trading at $63.89, down 2.16% on the day, the question every silver trader is asking is whether the oversold RSI readings building across multiple timeframes signal a genuine buying opportunity or just a trap ahead of further losses.
- XAGUSD is trading at $63.89, down 2.16% (-$1.41), with the daily range spanning $63.29 to $65.72.
- 4H RSI at 32.72 and daily RSI at 30.88 are approaching oversold territory, historically flagging potential inflection points for silver.
- ADX at 45.22 on the 4-hour chart confirms the downtrend is strong - oversold readings alone are not a buy signal in a trend this powerful.
- Critical support sits at $62.72 (4H S1); a close below this level opens the path toward $62.06 and $60.84.
Time Horizon: This analysis covers the near-to-medium term outlook for XAGUSD across the 1H, 4H, and Daily timeframes, suitable for intraday and swing traders.
A Three-Year Inflation High Reshapes the Metals Landscape
The June 10 US CPI print was blunt: headline inflation climbed 0.5% month-on-month, marking the sharpest annual pace in three years. For silver, this creates a genuinely complex signal. On one hand, rising inflation historically supports precious metals as inflation hedges. On the other, the immediate market reflex was a flight toward dollar assets and risk-off repositioning that hit both gold and silver hard. The XAGUSD today analysis has to grapple with both forces simultaneously.
Gold demonstrated this contradiction brutally, falling nearly 4% to $4,092.98 after failing to hold its key support zone. When gold drops that sharply, silver tends to follow - and sometimes overreact. That overreaction dynamic is precisely what XAGUSD market sentiment is processing right now. The silver market's weakness appears partly mechanical: algorithmic liquidation following gold's breakdown, stop-hunting below key levels, and profit-taking by traders who had been long precious metals heading into the inflation print.
The dollar index (DXY) sits at 99.67, marginally lower on the day by 0.04%. This is actually notable: despite the strong US inflation print, DXY is not surging. This tepid dollar response is one of the few potentially supportive signals for silver bulls to hold onto. If DXY had spiked above 101, the outlook for silver would be considerably darker. Instead, the metal's weakness appears driven more by profit-taking and risk repositioning than by sustained dollar strength - which means the floor for silver might be closer than the price action currently suggests.
Higher US inflation can theoretically support silver as a hedge, but in the short run it often signals tighter monetary policy expectations - which strengthens the dollar and pressures metals. The net effect right now is bearish for XAGUSD, but the relationship can flip quickly once rate expectations peak or the Fed signals a pause.
The Bank of Canada's decision to hold rates at 2.25% on June 10, noting that maintaining the current setting "balances" competing risks from oil prices and trade, added another layer to the global rate narrative. With Brent crude at $96.48 (up 2.6% on the day), energy-driven inflation is becoming a recurring theme in central bank communications. For silver, which straddles both industrial demand and monetary safe-haven demand, this energy price surge adds complexity: it supports the inflation hedging thesis but also risks further central bank hawkishness that weighs on speculative positioning in precious metals.
What the XAGUSD Price Forecast Charts Are Telling Us Across Timeframes
A multi-timeframe XAGUSD trend analysis reveals a market under sustained bear control, but one that is quietly accumulating the kind of oversold conditions that historically precede at least a technical bounce - if not a full reversal. This is the core tension in today's analysis, and understanding which timeframe is "telling the truth" is the key skill for navigating the next move.
On the 1-hour chart, the trend is clearly bearish with 90% strength. RSI is sitting at 46.37, technically neutral but with a downward lean. The real story on the hourly timeframe is actually the Stochastic indicator: with %K at 46.04 crossing above %D at 26.46, short-term momentum is beginning to turn. ADX at 29.94 confirms the hourly downtrend still has teeth. This is not a setup for aggressive longs; it looks more like a market pausing before the next leg lower or consolidating at support near today's $63.89 handle. Scalpers who missed the initial move should resist the urge to chase.
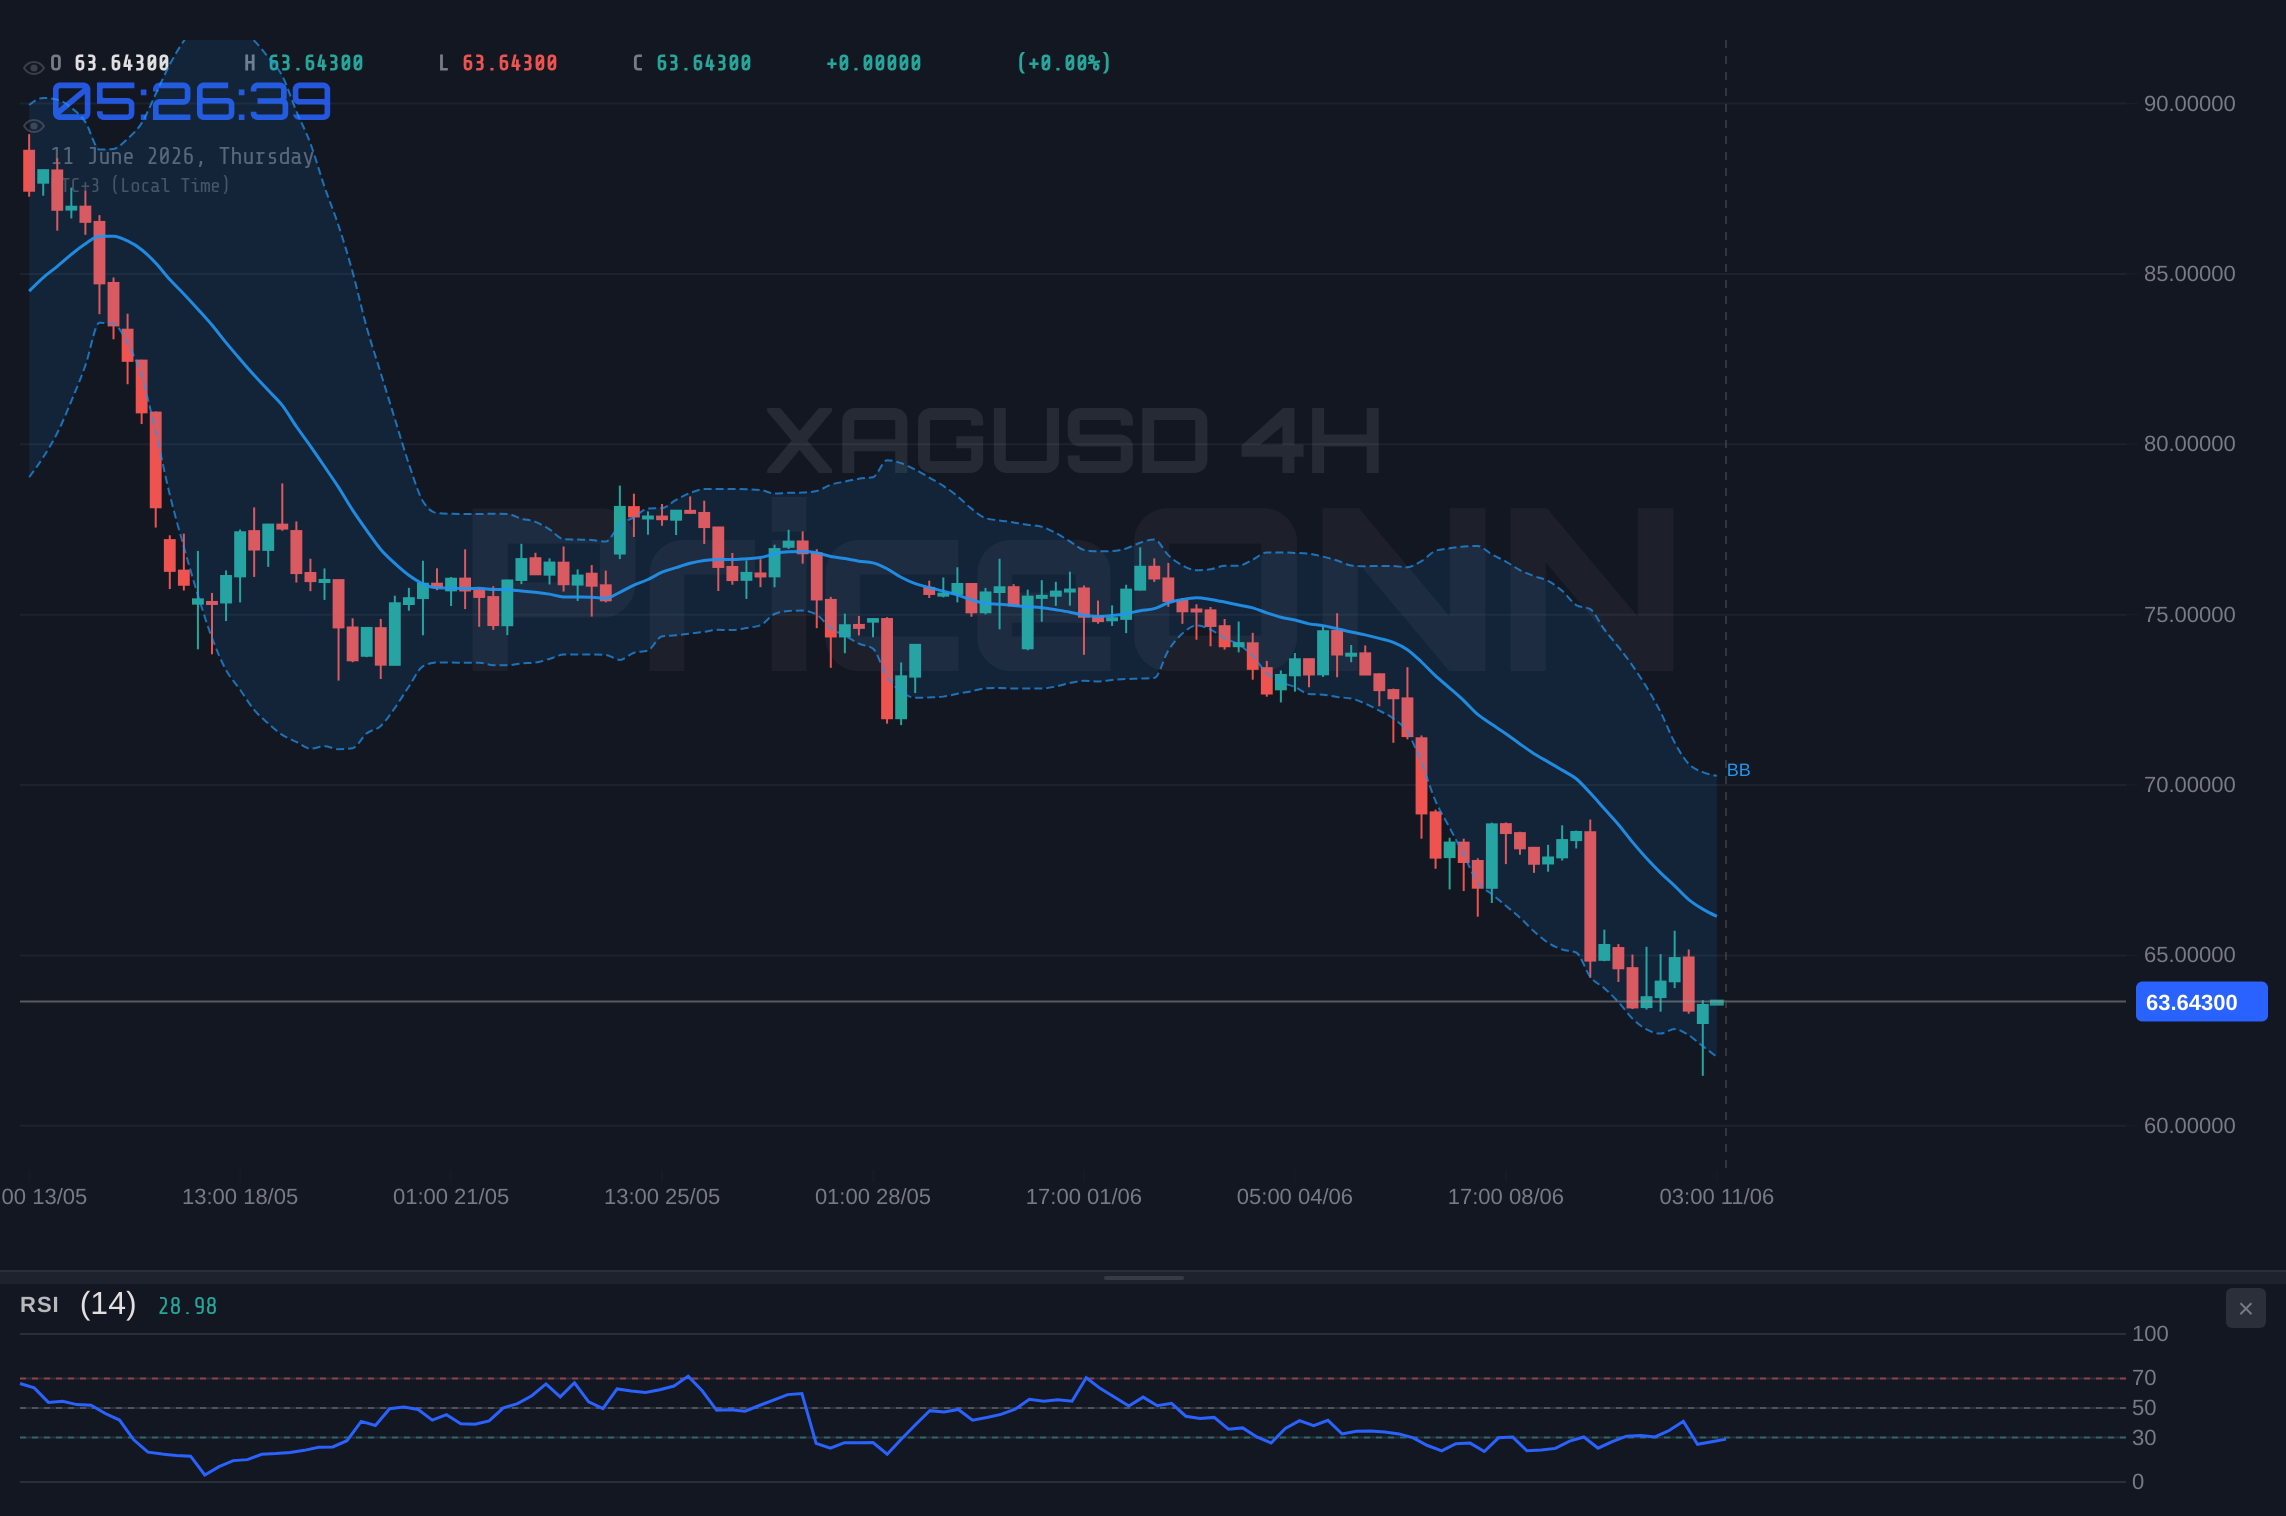
Zoom out to the 4-hour chart and the picture sharpens considerably. ADX at 45.22 is the headline number here - this is a strong, well-established directional move that bears watching carefully. MACD remains in negative territory with the histogram pulling below the signal line, confirming sellers are still active and in control. But the Stochastic oscillator is sending a different message: %K at 20.59 has just crossed above %D at 12.54 from deep oversold territory. That is a bullish crossover firing from an extreme zone - a pattern that has often preceded short-term relief rallies even within broader downtrends. The key word is "often" - not "always." Without corroboration from MACD or a break of resistance, this is an early warning signal, not an entry trigger.
The daily chart completes the picture. RSI at 30.88 is knocking on the oversold door. For silver specifically, daily RSI readings this low have historically represented zones where the metal finds at least temporary footing. The Bollinger Bands on the daily chart confirm the extent of this move: price is currently trading below the lower band, which is a statistical outlier condition that rarely persists for more than a few sessions. Bollinger Band pierces like this are not automatic reversals - but they do signal that the market is operating in an extreme condition that warrants close attention from both bulls looking for entry and bears watching for exhaustion signals.
Why $62.72 Is the Number Every Silver Trader Should Know This Week
Support and resistance analysis for the XAGUSD key levels right now narrows to a few critical battlegrounds. On the 4-hour chart, the first meaningful support sits at $62.72. This is not an arbitrary level - it represents a zone where buyers have previously stepped in during the current downtrend. Lose $62.72 on a closing basis and the next defensive line falls at $62.06, followed by $60.84 - a level that would represent roughly a 5% decline from today's $63.89 and would signal that the near-term capitulation is deepening rather than stabilizing.
On the upside, the bears have built walls. The first meaningful resistance on the 4H chart is at $64.61. Getting back above $64.61 on a 4-hour closing basis would be the first technical signal that short-term selling pressure is genuinely exhausting. Above that, $65.83 and $66.49 are the next resistance checkpoints on the way to any meaningful recovery. These levels are not far from the daily high at $65.72, which makes reclaiming $64.61 the immediate critical test for any bulls attempting to position for a bounce.
Pulling back to the daily chart, the support structure looks like this: $63.44 (Daily S1), then $61.57 (Daily S2), then $58.79 (Daily S3). The $63.44 daily S1 is particularly significant because it sits very close to today's intraday low of $63.29 - suggesting the market has already probed this level once. A daily close below $63.44 would be a meaningful bearish confirmation on the longer-term chart, validating the bearish continuation scenario.
The Gold-Silver Ratio Signal in XAGUSD Trend Analysis
With gold (XAUUSD) trading at $4,092.98 and silver at $63.89, the gold-to-silver ratio currently sits at approximately 64:1. This is a fundamental metric that long-term silver investors track carefully. When the ratio is elevated - as it is today - silver is considered undervalued relative to gold on a historical basis. Periods of elevated gold-silver ratio have historically preceded strong silver outperformance as the ratio tends to mean-revert toward its long-run average.
Mean-reversion, however, is a multi-week or multi-month concept. In the near term, if gold continues its decline driven by inflation-related Fed hawkishness concerns, silver could continue to underperform on an absolute basis even as the ratio stays elevated. The asymmetric risk is actually in silver's favor over a weeks-to-months timeframe - even if the next few sessions remain choppy. From a XAGUSD key levels perspective, the current daily RSI at 30.88 combined with the Bollinger Band breach is the kind of setup where gradual accumulation makes sense for longer-horizon players - with the caveat that the ADX-confirmed downtrend across all timeframes argues against all-in entries at current prices.
Three Scenarios for XAGUSD; Pick Your Side
Given the confluence of strong ADX downtrend momentum, multiple oversold oscillators, and a major macro catalyst just digested by the market, here are the three scenarios traders should plan for over the next 48 to 72 hours:
Bearish Continuation; ADX Says the Trend Is Not Done
55% ProbabilityOversold Bounce; Stochastic Crossover Sparks a Relief Rally
20% ProbabilityConsolidation; Market Digests Losses Before Next Directional Move
25% ProbabilityWhat Different Trader Types Should Watch for in XAGUSD Right Now
For scalpers and day traders, the 1-hour chart provides the most granular signals. The Stochastic crossover at K=46.04 over D=26.46 on the hourly chart is a micro bullish signal, but ADX at 29.94 says the downtrend still has directional momentum. Scalpers should be cautious about counter-trend long positions. The cleaner setup is waiting for a retest of the $64.16 area (1H R1) and looking for rejection there as a short entry, targeting the $62.46 hourly support. Risk/reward is tighter than at the day's open, but the trade thesis is cleaner.
For swing traders operating on the 4-hour timeframe, patience is the operative word. The strong ADX reading of 45.22 combined with persistently negative MACD argues against entering long positions until there is clear confirmation of a trend change. The risk/reward for shorts from current levels toward $62.72 is reasonable but the move has already been substantial - chasing short entries at these levels increases the risk of catching a snapback. The better setup for swing longs would be a clear Stochastic bullish crossover on the daily chart alongside a confirmed hold of $62.72 on a closing basis, giving the trade both momentum and structural confirmation.
Long-term investors and position traders face a more nuanced picture. The daily RSI at 30.88 approaching oversold territory, combined with the Bollinger Band breach on the downside, historically represents a zone where silver has offered attractive accumulation opportunities. The gold-silver ratio at current levels further supports the case for adding silver exposure with a multi-week to multi-month horizon. However, the ADX-confirmed downtrend across all timeframes suggests scaling in gradually rather than committing fully at today's $63.89 - consider a first tranche here with additional entries if $62.72 or $62.06 are tested and hold.
The confluence of oversold Stochastic readings on both the 4H and daily charts with an ADX above 40 is a classic "strong trend approaching exhaustion" pattern in silver. Historically, this combination has preceded sharp but short-lived counter-trend rallies before the primary trend reasserts itself. Trade the setup you see - not the one you want.
Frequently Asked Questions: XAGUSD Analysis
What happens to XAGUSD if it breaks below the $62.72 support level on a 4-hour close?
A confirmed 4-hour close below $62.72 (the primary 4H S1) would be a significant bearish confirmation, opening the path toward the $62.06 level and potentially the $60.84 major support zone. Given the ADX at 45.22 confirming a strong downtrend on the 4-hour chart, a break of this support with follow-through volume would indicate that selling pressure is not yet exhausted and the bearish continuation scenario (55% probability) is actively playing out.
Should traders buy XAGUSD at $63.89 given the daily RSI is near the 30.88 oversold threshold?
Oversold RSI readings can signal exhaustion, but the strong ADX at 45.22 on the 4-hour chart means the downtrend still has real momentum - oversold can get more oversold in a strong trend. A more disciplined approach is waiting for either a confirmed hold of $62.72 on a 4-hour closing basis or a break above $64.61 resistance before entering long positions, rather than buying purely on oversold readings without structural confirmation.
Is the 4H Stochastic crossover at K=20.59 above D=12.54 a reliable buy signal for XAGUSD right now?
Stochastic crossovers from oversold territory can signal potential reversals, but they are most reliable when confirmed by other indicators. In this case, the crossover is occurring while ADX remains at 45.22 and MACD stays in negative territory, meaning the downtrend's underlying momentum is still intact. Treat the Stochastic crossover as an early warning to watch rather than an immediate entry trigger - wait for MACD to confirm before acting on it.
How does the US CPI three-year high reported on June 10 affect the XAGUSD price forecast this week?
The US CPI climbing to a three-year high creates dual pressure on silver: it raises inflation hedge demand theoretically, but simultaneously boosts Fed hawkishness expectations that can strengthen the dollar and suppress metals. With DXY at 99.67 and not surging aggressively, the door remains open for silver stabilization, but any Fed rhetoric reinforcing higher-for-longer rates could extend XAGUSD's decline below $63.89 toward the $62.72-$62.06 support cluster in the near term.
Silver at $63.89 sits at a genuine decision point. The macro backdrop - three-year high US inflation, energy price spikes, and global central bank uncertainty - is creating the kind of volatility that either breaks key support levels decisively or sets up powerful snap-back rallies. The technical case for a bounce is building quietly: RSI near historic extremes on the daily chart, Stochastic crossovers firing from oversold territory, and Bollinger Band conditions that rarely persist beyond a few sessions. But the ADX at 45.22 on the 4-hour chart says the trend has not broken yet. Patience, defined risk, and confirmation over conviction - that remains the edge in a market as contested as this one.
Track markets in real-time
AI-powered analysis, technical indicators and real-time price data.
Join Our Telegram Channel
Breaking market news, AI analysis and trading signals instantly.
Join Channel