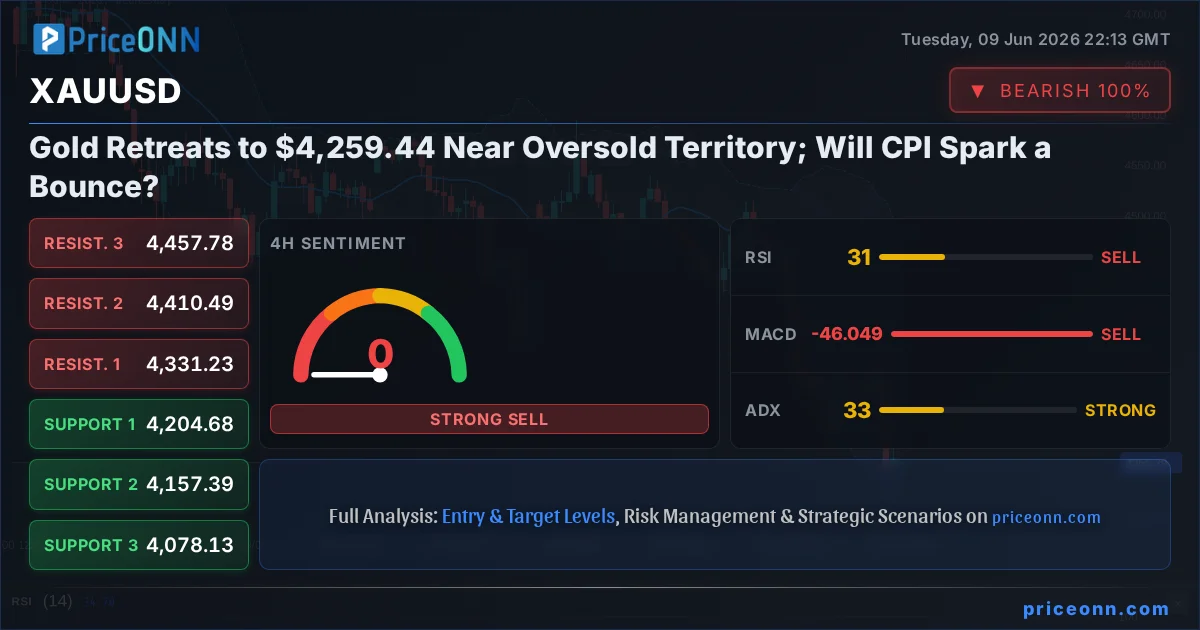
When three timeframes all show RSI clustering between 30 and 31, the market is whispering something important: the sellers are getting tired. But tired sellers and a confirmed reversal are two very different things - and right now, with US CPI data looming over every precious metals trade this week, the distinction matters enormously.
- XAUUSD today analysis shows gold at $4,259.44, down 1.57% on the session, with the 1-hour RSI at 30.37 - sitting precisely at the oversold threshold.
- Critical support at $4,253.06 (1H chart) is the immediate line in the sand; a 4H close below this level opens the door to $4,203.85 on the daily chart.
- MACD histogram is negative across all three timeframes simultaneously - no bullish momentum confirmation exists despite the compressed RSI readings.
- US CPI data is the binary catalyst defining gold's next move: a hot print validates the bears, a soft print could ignite the oversold bounce traders are watching for.
The Market Has Been Methodical About This Selloff
Profit-taking ahead of a high-stakes inflation print is rational behavior. What's less rational is assuming the selling stops here simply because RSI is at 30. The XAUUSD trend analysis across the daily chart tells a story of sustained institutional distribution: a 99% bearish trend reading, ADX at 28.18 confirming the trend has real structural force behind it, and Bollinger Bands showing price trading below the lower band - that last signal is particularly important. A daily close below the Bollinger lower band doesn't just signal oversold conditions; it signals that volatility has expanded to the downside in a way that exceeds normal statistical ranges.
Reuters reporting from today confirms the macro backdrop: traders are booking gains across commodities as they position defensively before the CPI release. Sterling jumped on strong UK consumer spending data, drawing some flows away from safe-haven assets. The broader narrative of the session is one of selective risk-taking - equities rally, gold retreats. That's not a panic selloff. That's disciplined repositioning by market participants who have learned to respect CPI week volatility.
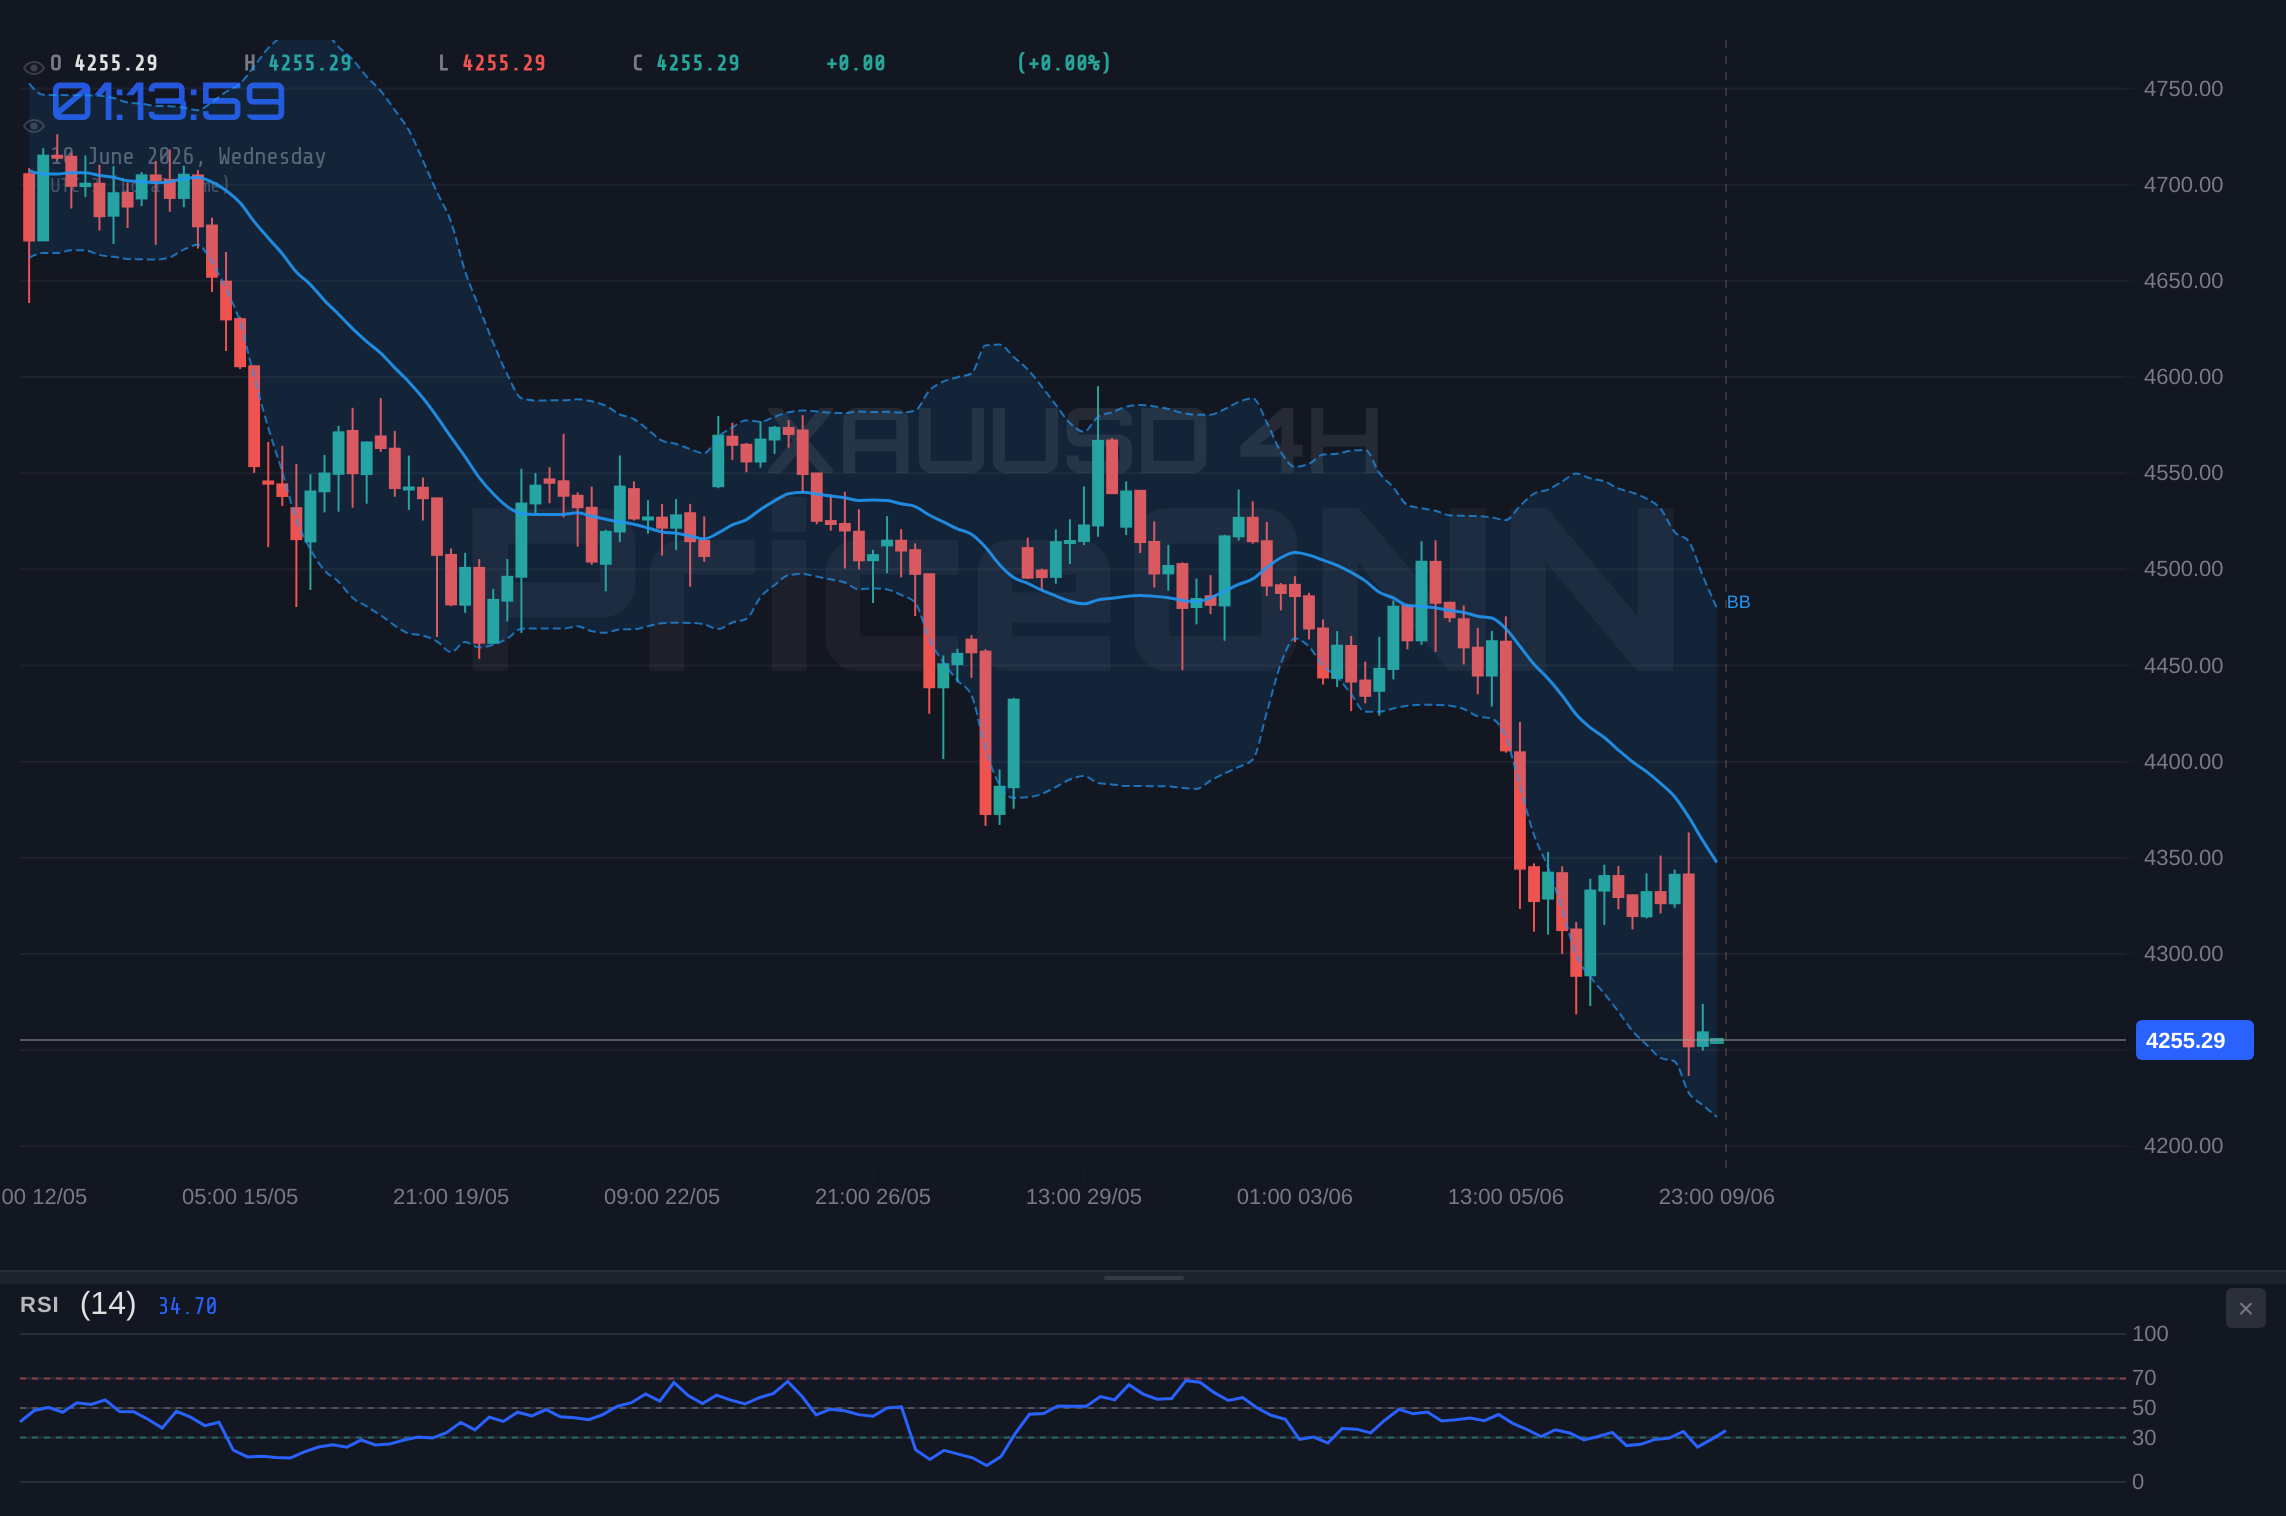
One thing the chart makes absolutely clear: the daily range of $4,268.60 to $4,353.12 established earlier in the session has collapsed into the lower end, with the current $4,259.44 print sitting below today's opening range entirely. Bears are in control of price discovery today, and they haven't shown any signs of relinquishing that control ahead of the data.
Why Dollar Strength Is Driving Gold Lower Right Now
The XAUUSD key levels analysis and its directional bias are fundamentally connected to what the dollar is doing. DXY at 99.72 with a daily trend running at 91% bullish strength is the structural headwind gold cannot escape. The dollar's RSI on the daily chart reads 63.83 - firmly in bullish territory - and the MACD remains in positive momentum above the signal line. Bloomberg has consistently reported that strong US labor market data, with Non-Farm Payrolls well above expectations, has rekindled Fed rate hike expectations and given the dollar fresh momentum throughout this week.
Here is the intermarket dynamic that cuts to the heart of the gold bear case: rising rate expectations increase the opportunity cost of holding non-yielding assets. When US Treasuries are offering 4-5% annualized returns, institutional money has a compelling reason to rotate out of gold. Dollar-denominated gold also becomes more expensive for international buyers as DXY strengthens, mechanically reducing demand. Both channels are active simultaneously right now.
Then there are equities. The S&P 500 is up 0.74% at $6,572.87 today, with the 1-hour chart showing a 100% bullish trend reading and ADX at 49.72 - one of the strongest trend confirmation readings in the current market cycle. Nasdaq added over 1%, climbing to $29,097. Risk appetite is genuinely robust in equities today, and that means institutional flows are chasing performance in growth assets rather than seeking shelter in bullion. Safe-haven demand is the engine that drives gold rallies; with that engine idling, the path of least resistance remains lower.
Incoming US CPI data represents the single largest binary risk for gold this week. A hotter-than-expected reading would reinforce Fed hawkishness, strengthen DXY beyond the 100.13 resistance level, and likely push XAUUSD below the critical $4,253.06 support zone. A soft print could trigger a sharp relief rally toward $4,276 and beyond. Position sizing around this event deserves careful consideration.
What the XAUUSD RSI Reading Near 30 Actually Means for Traders
The XAUUSD RSI analysis is generating conflicting signals that deserve careful interpretation. On the 1-hour chart, RSI sits at 30.37. On the 4-hour, it reads 30.85. On the daily, 31.21. Three timeframes, all clustered just above the 30-level that traders associate with potential exhaustion zones. Multi-timeframe confluence on RSI compression like this is a genuine technical signal - but it requires context.
The nuance that most traders miss: RSI at 30 in the context of an ADX reading of 28.18 on the daily means the downtrend has enough structural momentum to push RSI lower before reversing. ADX measures trend strength, not direction - and 28.18 is a number that says "this trend is real." MACD is negative across all three timeframes, sitting below the signal line in each case without exception. The daily Stochastic shows K=17.69 crossing below D=42.52 - a confirmed bearish signal that hasn't shown any signs of reversing.
The only potential early-stage recovery signal comes from the 4-hour Stochastic, where K=58.08 has crossed above D=50.8 - a bullish cross suggesting some short-covering pressure building at current levels. But one Stochastic cross on the 4H chart against a wall of bearish evidence from MACD, daily RSI, and ADX is not a trade. It's a data point worth watching for confirmation. The XAUUSD breakout potential on the upside doesn't exist until price reclaims $4,276.05 on a 4H close - that's the technical line that would shift the short-term momentum picture.
US CPI: The Catalyst That Decides Gold's Next Directional Move
Bloomberg's analysis covering this week's event calendar described US CPI as leading a "high-stakes week" with one central question: how much of the recent oil shock has fed into core inflation readings? This is the specific mechanism through which CPI affects gold. If services inflation remains sticky and headline CPI prints above the previous 0.4% month-on-month reading, the Fed's case for pausing rate hikes weakens considerably - and gold's primary bull narrative for this cycle goes with it.
Brent crude is currently at $94.13, down 1.49% today as Kuwait offers its first crude cargoes to Asia since Middle East conflict disrupted Strait of Hormuz shipping access. The energy market stress that was feeding into inflation expectations earlier in the month is partially resolving, which creates a legitimate argument that CPI could print softer than feared. But "could print softer" is not "will print softer" - and the previous month's data showing a 0.4% reading combined with robust employment means the Fed has little reason to sound dovish regardless of the exact number.
The geopolitical backdrop continues to provide a theoretical floor for gold's safe-haven appeal. Middle East tensions, ongoing energy market disruptions, and global uncertainty typically support precious metals. The issue right now is that the macro tape - dollar strength, equity market confidence, rate expectations - is overriding the geopolitical bid with mathematical precision. Until CPI resolves the rate outlook uncertainty, gold is trading on dollar dynamics more than anything else.
The $4,253 Level: Where the Real Battle Lines Are Drawn
On the 1-hour chart, three support levels define the immediate structural floor beneath current prices. S1 at $4,261.37 has already been breached - the current print of $4,259.44 is trading through it, confirming sellers have not found a reason to stop at that level. The real test now is S2 at $4,253.06. This is where the XAUUSD support and resistance picture gets serious. A sustained hourly close below $4,253 opens space toward $4,246.69 (S3), and from there the daily chart takes over with $4,203.85 as the next major structural level.
On the resistance side, the 1-hour chart shows the bull recovery narrative requires reclaiming $4,276.05 (R1) first. Beyond that, $4,282.42 (R2) and $4,290.73 (R3) represent the overhead supply that any bounce must work through. The daily chart resistance structure doesn't begin until $4,435.30 - which illustrates how far gold has retreated from its structural range highs. Getting back to that level would require a complete narrative shift: soft CPI, Fed pivot, dollar reversal. That is not the base case. But it is the upside scenario if every macro variable reverses simultaneously.
Three Scenarios That Define the Next 48 Hours for Gold
With RSI compressed near 30 across all timeframes and CPI acting as a binary catalyst, the probability distribution for the next two trading sessions has a clear directional skew. Here are the three scenarios traders should have mapped before the data drops:
Bearish Continuation: CPI Validates the Downtrend
65% ProbabilityBullish Reversal: Soft CPI Ignites the Oversold Bounce
15% ProbabilityNeutral Consolidation: Pre-CPI Rangebound Squeeze
20% ProbabilityWhat Different Trader Profiles Should Watch Right Now
The XAUUSD market sentiment analysis reads differently depending on your time horizon and risk tolerance. Scalpers working the 1-hour chart face a genuine dilemma: RSI at 30.37 prevents aggressive new short entries because you are statistically near exhaustion territory, but MACD negative momentum with no confirmation signal means longs have no technical backing either. The narrow range between $4,253 and $4,276 is the only playable zone for intraday traders - and it requires tight stops given the binary CPI event overhead.
Swing traders have the most interesting setup building. The daily chart showing ADX at 28.18 with RSI at 31.21 and the Bollinger lower band breach suggests we are approaching a zone where counter-trend positioning historically generates reasonable risk-reward - particularly if CPI provides the macro catalyst for a relief rally. The 4H Stochastic bullish cross (K=58.08 above D=50.8) is the early-warning signal worth monitoring. But the confirmation trade for a swing long requires a 4H close above $4,276.05 - that's the gate that needs to open before adding directional long exposure with any conviction.
Long-term investors and macro-oriented participants watching this correction have the clearest perspective. Central banks globally have been systematic gold accumulators throughout 2025 and into 2026 - Bloomberg's reporting has tracked this institutional demand trend consistently. A CPI-driven dip toward $4,203 or the $4,096 daily support level could represent a structurally attractive accumulation zone for those operating on a multi-month horizon. The XAUUSD weekly outlook for gold bulls hinges on the dollar narrative reversing - and that reversal, when it comes, will likely be sharp and significant.
The XAUUSD breakout level to watch post-CPI: if DXY breaks below its 1D S1 support at 99.17, gold gets structural relief immediately. Dollar weakness is gold's primary fuel right now. A softer CPI reading is the catalyst most likely to trigger that DXY break - and with it, a potentially sharp recovery rally in gold from oversold levels.
Frequently Asked Questions: XAUUSD Analysis
What happens to gold if US CPI breaks above the previous 0.4% reading with XAUUSD near $4,253 support?
A hotter-than-expected CPI print would likely push DXY above its key 100.13 resistance level, creating direct and immediate bearish pressure on XAUUSD below the $4,253.06 support zone. In this scenario, the next major support sits at $4,203.85 on the daily chart - approximately 1.3% below current levels. Traders should watch for a confirmed 4H candle close below $4,253 as the technical signal to validate the bearish extension.
Should traders buy XAUUSD at $4,259 given RSI is near 30 across the 1H, 4H, and daily charts?
While RSI converging near 30 across three timeframes signals approaching oversold conditions, the MACD remains negative across all three timeframes with no bullish momentum confirmation. The ADX at 28.18 on the daily chart confirms the downtrend has structural force that RSI alone cannot override. A safer long entry requires a 4H close above $4,276.05 (R1) after the CPI data resolves the directional binary - until then, oversold RSI in a strong downtrend is not sufficient confirmation for a counter-trend position.
Why is gold falling with RSI at 30.37 on the 1-hour chart if oversold typically signals a reversal?
Gold is declining primarily because DXY at 99.72 with a 91% bullish daily trend is exerting consistent pressure on dollar-denominated commodities, amplified by Fed rate hike expectations following strong NFP data. The S&P 500 at $6,572.87 with ADX at 49.72 signals robust risk appetite that reduces safe-haven demand for gold simultaneously. RSI approaching 30 means the rate of decline may slow, but it does not override the fundamental macro pressure from dollar strength, equity confidence, and rate expectations - confirmation of reversal requires MACD and ADX to corroborate the signal.
How will the upcoming US CPI release affect the $4,253.06 support level for XAUUSD this week?
The $4,253.06 level (1H S2) is the critical structural test going into the CPI release - price is already trading just $5.38 above it at $4,259.44. A CPI print above the previous reading of 0.4% would likely trigger a breach of this level and target $4,203.85 (daily S2), while a softer-than-expected print could spark a relief rally toward the $4,276-$4,290 resistance cluster. The daily ADX at 28.18 confirms strong bearish trend momentum, meaning $4,253 would need significant buying volume to hold against a hawkish CPI catalyst.
Markets that sell as methodically as gold has this week rarely give clean reversal signals at the bottom - they grind, they test patience, and they eventually force out the last stubborn bears before reversing. The RSI compression across three timeframes tells you the grind is reaching statistical limits. What it cannot tell you is whether CPI provides the macro permission slip for a recovery. That answer comes from the data. Prepare both scenarios, size positions accordingly, and let the market reveal its hand before committing.
Track markets in real-time
AI-powered analysis, technical indicators and real-time price data.
Join Our Telegram Channel
Breaking market news, AI analysis and trading signals instantly.
Join Channel