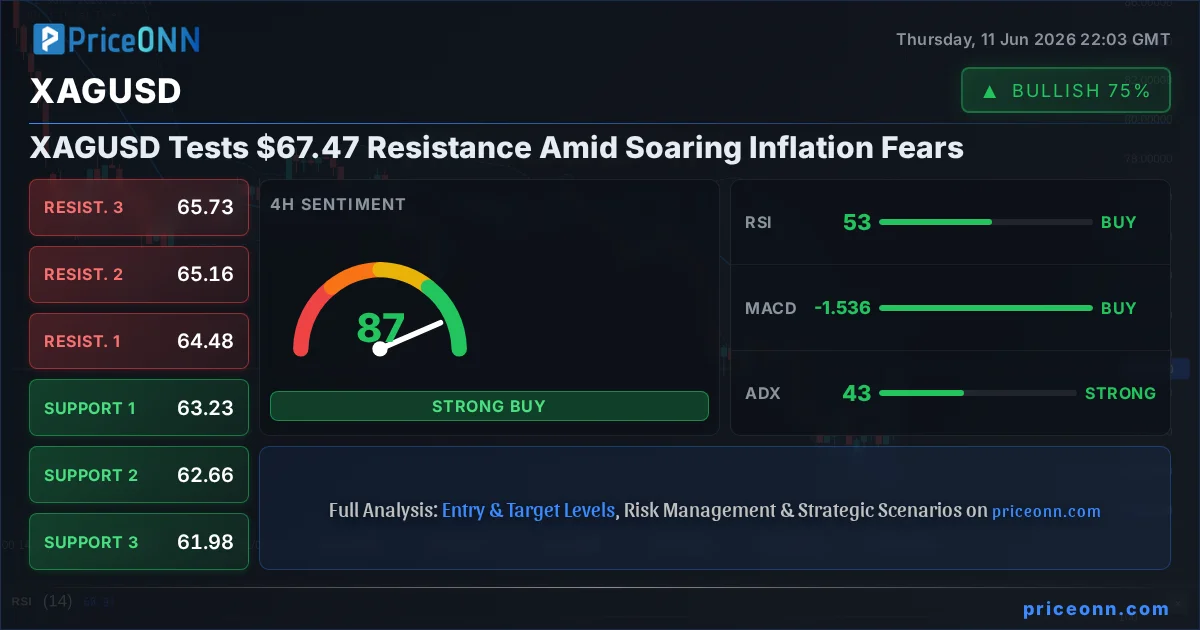
Silver, or XAGUSD, is currently trading at a critical juncture, hovering around the $67.47 mark and testing significant resistance levels. This price point is not just a number; it represents a battleground where inflation fears clash with market sentiment, potentially dictating the precious metal's next major move. The recent surge in gold prices, coupled with a notable uptick in silver's value, signals a growing appetite for safe-haven assets as macroeconomic uncertainties mount. This analysis delves into the intricate web of market dynamics, from the dollar's influence and equity market sentiment to geopolitical undercurrents, to decipher the path forward for XAGUSD.
- Silver (XAGUSD) is currently testing resistance near $67.47, with RSI at 67.77 indicating a strong upward momentum that is approaching overbought territory.
- The critical support level for XAGUSD is holding firm at $66.39, while resistance looms at $67.81, a crucial barrier for further upside.
- The MACD histogram shows positive momentum, but Stochastic is entering overbought zones, suggesting a potential short-term pullback or consolidation.
- Correlation analysis shows the DXY at 99.46 is in a downtrend, which typically supports precious metals like XAGUSD.
The Inflationary Tide Lifting Silver
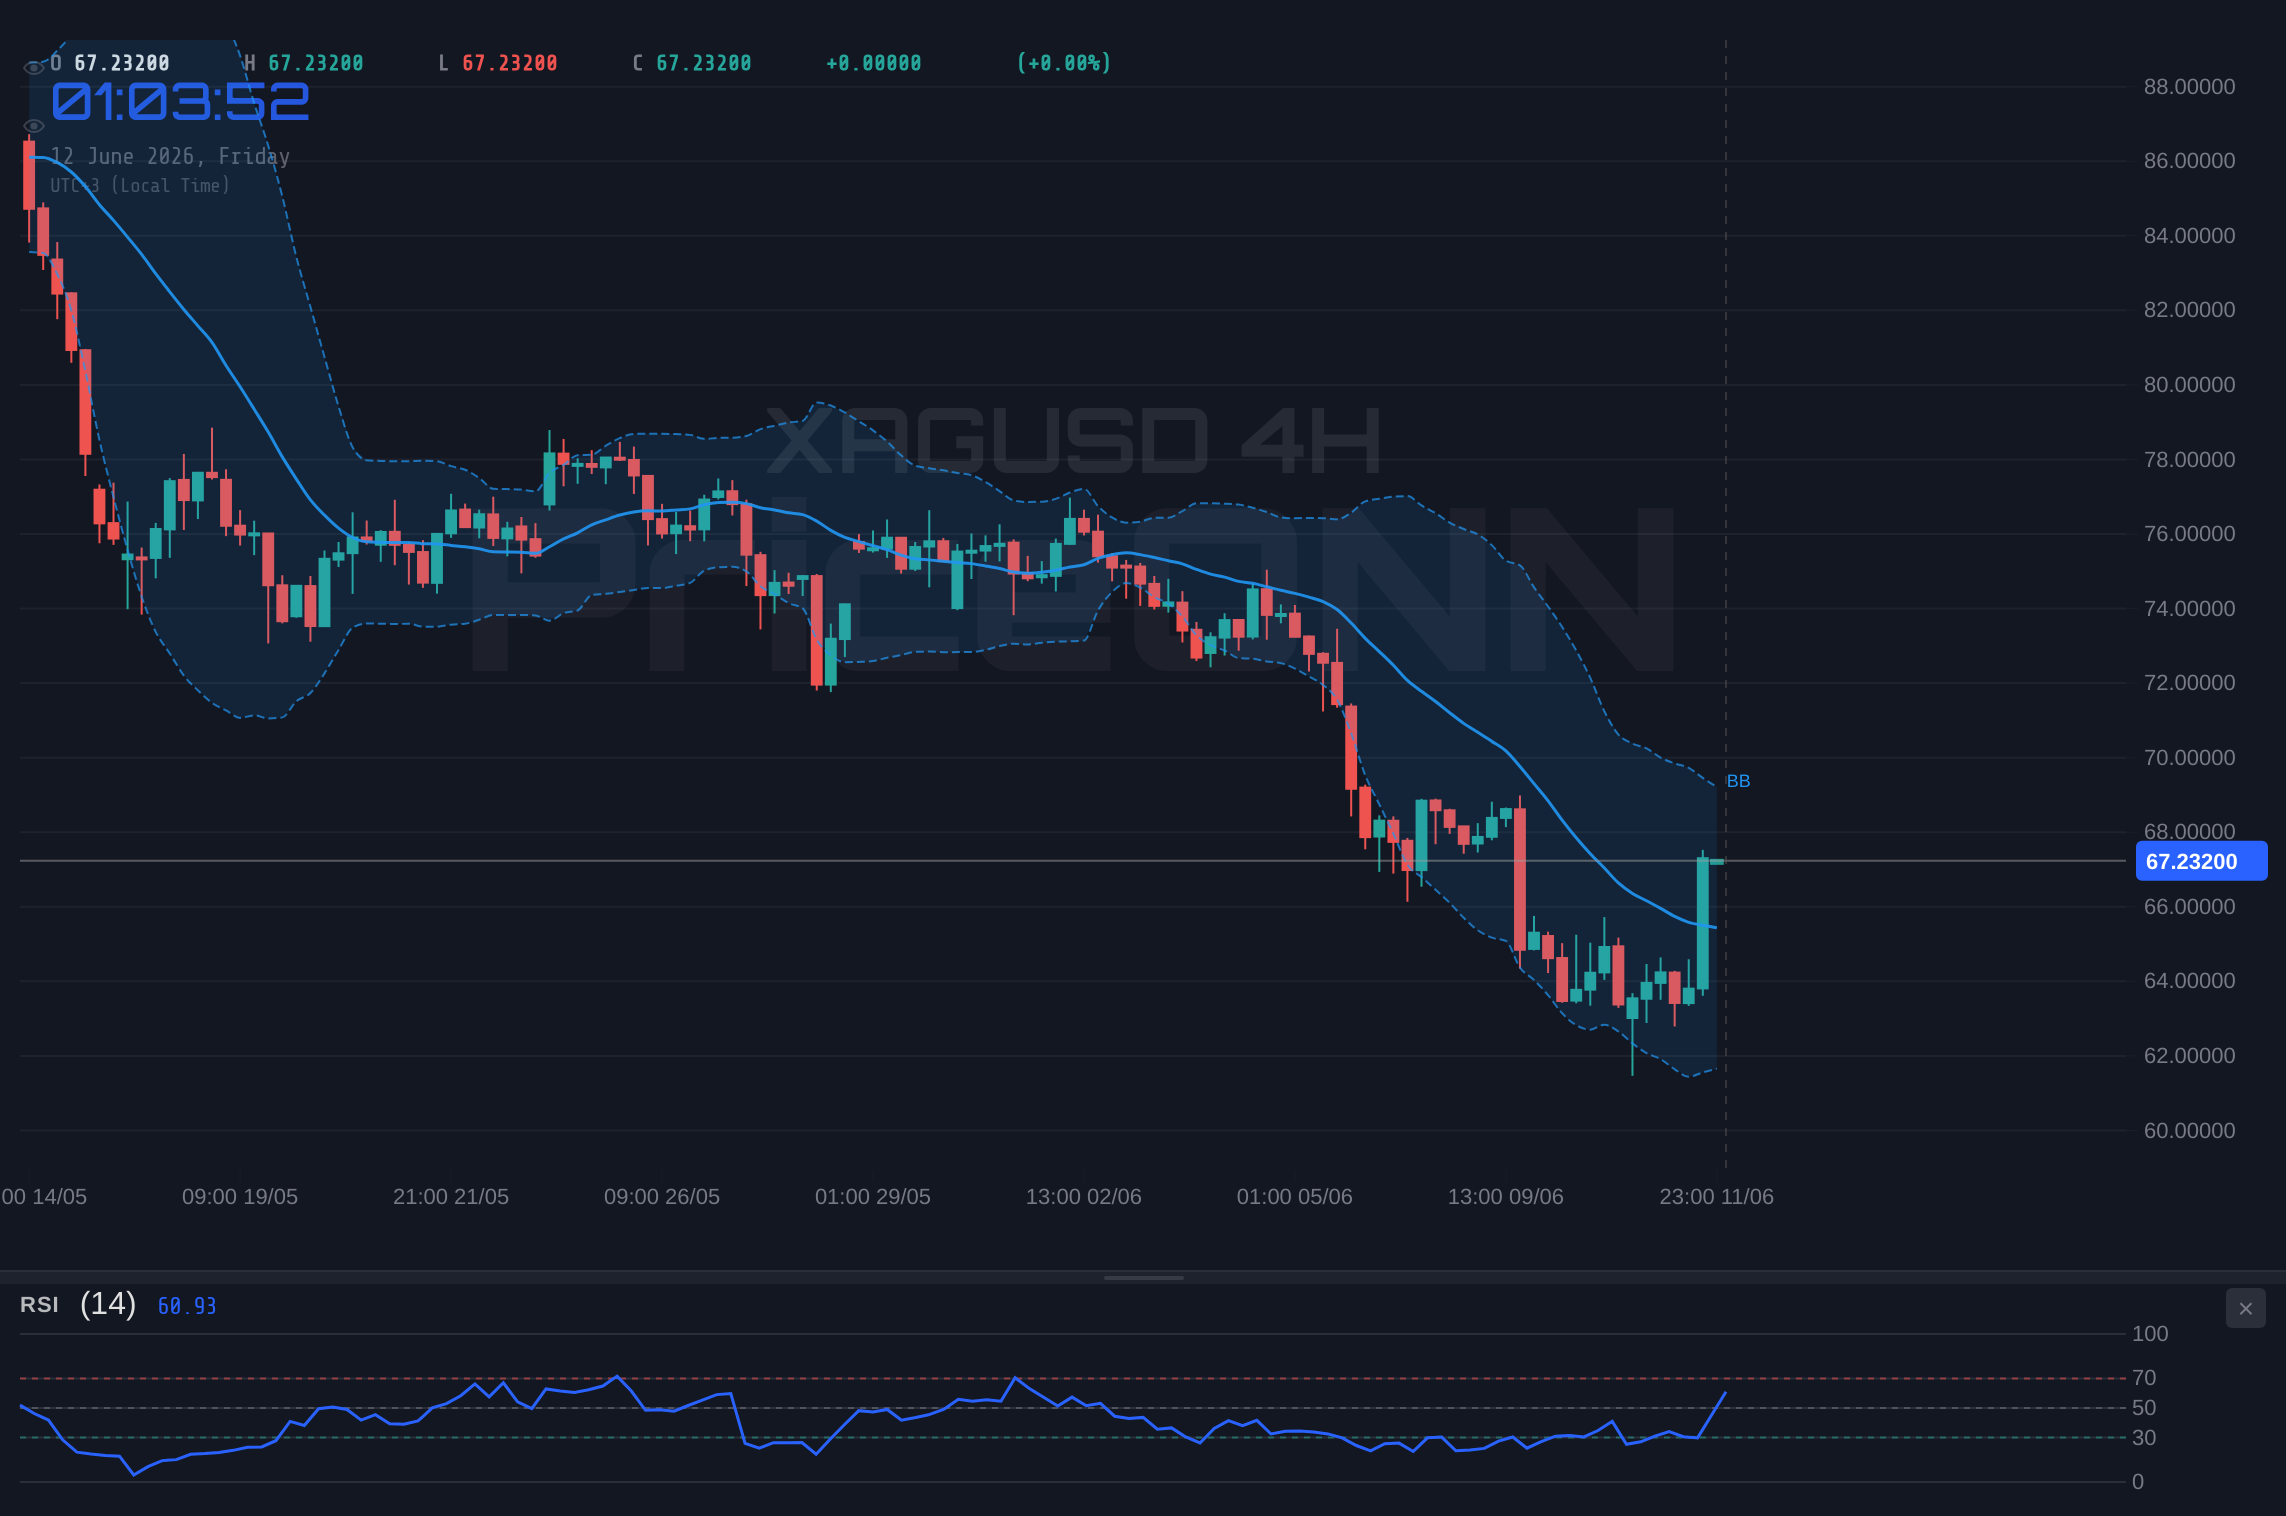
The relentless climb in silver prices, now challenging the $67.47 resistance, is intrinsically linked to the escalating inflation narrative. Recent economic data, including a headline CPI reading that met expectations at a 0.5% month-on-month increase in May, has kept inflation concerns at the forefront. While this figure was in line with forecasts, the persistent elevation of price pressures globally continues to bolster the case for precious metals as a hedge against currency devaluation. The 1H chart for XAGUSD shows a robust uptrend with an RSI reading of 71.77, teetering on the edge of overbought conditions. This suggests that while momentum is strong, a short-term correction or consolidation phase could be on the horizon as traders eye potential profit-taking opportunities. The ADX at 21.57 indicates a moderately strong uptrend, but the confluence of a high RSI and a Stochastic nearing extreme levels warrants caution for aggressive long positions without further confirmation.
Historically, periods of high inflation have seen silver outperform gold due to its dual nature as both a monetary asset and an industrial metal. As economies grapple with supply chain disruptions and geopolitical instability, demand for industrial inputs like silver can surge, adding another layer of support to its price. The recent news highlighting a potential US-Iran escalation, though primarily impacting crude oil, adds to the general geopolitical uncertainty that often drives investors towards tangible assets. This pervasive inflation, coupled with a weakening dollar, creates a potent cocktail for silver's ascent.
The current market sentiment appears cautiously optimistic for silver, with strong upward momentum on shorter timeframes (1H) clashing with potential overbought signals. The 4H chart offers a more neutral perspective with an RSI at 53.7, suggesting that while the immediate pressure is upwards, the longer-term trend might be consolidating before a decisive move. This dichotomy implies that while the bulls have control in the short term, the sustainability of the rally hinges on breaking through key resistance levels without triggering a significant sell-off from overextended indicators.
Cross-Market Correlations: DXY and Equities
The relationship between silver and the US Dollar Index (DXY) remains a cornerstone of its price action. Currently, the DXY is trading around 99.46, exhibiting a downtrend. This inverse correlation is a well-established phenomenon: a weaker dollar typically makes dollar-denominated assets, like silver, cheaper for holders of other currencies, thereby increasing demand and pushing prices higher. The 1H chart for DXY shows negative momentum with an RSI of 34.56, reinforcing the bearish outlook for the dollar in the short term. This dynamic provides a favorable backdrop for XAGUSD's upward trajectory.
Equities, particularly the S&P 500 and Nasdaq, serve as a barometer for risk appetite. The S&P 500 is currently trading at 6572.87, showing a strong upward move with a 0.74% daily gain. This suggests a healthy risk-on sentiment in the broader market, which might seem counterintuitive for a safe-haven asset like silver. However, the narrative around inflation and potential interest rate hikes complicates this picture. If inflation continues to accelerate, it could eventually prompt central banks to tighten policy more aggressively, which might cool equity markets and, paradoxically, boost demand for precious metals as a hedge against both inflation and potential recessionary fears. The Nasdaq's significant surge of 3.66% to 29471.59 further indicates a strong risk-on environment, but the underlying inflationary pressures could be sowing the seeds for future market corrections.
The interplay between DXY's weakness and the equity market's strength creates a complex environment for XAGUSD. While a weaker dollar is inherently bullish for silver, a robust risk-on sentiment in equities can sometimes draw capital away from safe havens. However, the dominant narrative of persistent inflation appears to be overriding this typical correlation, suggesting that both equities and precious metals might find support as investors seek protection against rising prices.
Geopolitical Undercurrents and Their Impact
Geopolitical tensions remain a significant, albeit often unpredictable, driver for precious metals. Reports of US-Iran escalation, even if not directly impacting XAGUSD's immediate price action, contribute to a general sense of global unease. Such events can trigger flight-to-safety flows, benefiting assets traditionally perceived as safe havens, including gold and, by extension, silver. While the immediate focus might be on oil prices, the ripple effect across financial markets cannot be ignored. Any escalation in global conflicts or trade disputes can lead to increased volatility and a renewed demand for assets that preserve wealth during uncertain times.
The economic calendar, while showing some recent data points, lacks high-impact releases in the immediate 3-day window that could significantly sway market sentiment. However, the absence of major economic catalysts does not imply a lack of underlying risk. Market participants are constantly scanning the horizon for potential geopolitical flare-ups or unexpected economic shifts. The ongoing discussions around central bank policies, particularly the Federal Reserve's stance on inflation and interest rates, remain a critical factor. Any hint of a more hawkish policy pivot could introduce headwinds for commodities, but for now, the inflation narrative appears to be the dominant force.
The Technical Battle at $67.47
From a technical standpoint, the $67.47 level for XAGUSD is a critical resistance point. The 1H chart shows a strong push towards this level, with RSI at 71.77 and Stochastic K line at 93.63, both signaling overbought conditions. This suggests that while the buying pressure has been intense, the market might be due for a pause or a pullback. The ADX on the 1H is 21.57, indicating a moderate uptrend, but the confluence of extreme oscillator readings calls for vigilance. Support on the 1H is identified at $66.39, $65.54, and $64.97. A decisive break above $67.81 (R1 resistance) would be needed to confirm a continuation of the bullish momentum, targeting $68.38 and potentially $69.24.
The 4H chart presents a slightly different picture, with a more neutral RSI of 49.01, suggesting less immediate overbought pressure but still within a broader consolidation phase. However, the ADX on the 4H chart stands at a strong 47.29, indicating a powerful trend, albeit one that the RSI reading seems to contradict. This divergence between trend strength and momentum indicators could signal a period of consolidation or a potential reversal if key levels are not maintained. The daily (1D) timeframe paints a starkly bearish picture with RSI at 35.97, MACD below its signal line, and Stochastic falling. This suggests that the longer-term trend is still bearish, and the current rally might be a retracement within a larger downtrend. This conflict across timeframes highlights the importance of careful trade management and the need for clear triggers.
The divergence across timeframes is a critical point. The 1H chart screams 'buy,' driven by momentum and a weaker dollar. However, the 1D chart warns of a potential longer-term downtrend. This conflict means that while short-term traders might find opportunities, longer-term investors should exercise extreme caution. Confirmation of a sustained move above the daily resistance at $64.97 is crucial for any significant bullish thesis to take hold on the daily chart.
The Bull's Roadmap: Breaking $67.81
For the bulls to maintain control and push silver higher, a clear break and hold above the immediate resistance at $67.81 is paramount. This level, derived from the 1H resistance data, acts as the first hurdle. If XAGUSD can decisively close above this price on the 1-hour chart, with strong volume and sustained buying pressure, the next target would be the 4H resistance level at $68.38. Beyond that, the R3 resistance on the 1H chart at $69.24 becomes the next significant objective. The success of this bullish scenario hinges on the continued weakness of the DXY (currently around 99.46 and falling) and a sustained risk-on sentiment in equities, despite the inflationary backdrop. The RSI on the 1H is already high, so a brief consolidation or pullback towards the $66.39 support might occur before attempting a sustained move higher. However, if the price can consolidate above $67.81, it would signal conviction from buyers and potentially set the stage for a move towards the $69.00 psychological level.
A sustained close above $67.81 on the 1-hour chart, coupled with a DXY holding below 99.50, would be a strong bullish trigger, potentially opening the door for targets at $68.38 and $69.24 within the next 24-48 hours.
Where Bears Take Control: Below $66.39
Conversely, the bearish scenario gains traction if XAGUSD fails to hold its ground at the current price levels and breaks below the immediate 1H support at $66.39. This level is critical as it represents the first line of defense for the bulls. A breach below $66.39, especially with increasing volume and negative divergence on the oscillators, would likely invite further selling pressure. The next support level to watch would be $65.54, followed by $64.97 on the 4H chart. If the price closes below $64.97, the bearish thesis would be significantly strengthened, potentially triggering a move towards the daily support levels identified at $62.54 and $61.70. This scenario becomes more probable if inflation fears subside, or if central banks signal a more aggressive stance on rate hikes, which would likely strengthen the dollar and dampen commodity demand. The daily chart's bearish signals (RSI 35.97, ADX 34.06) lend credence to this possibility, suggesting that the current rally might just be a retracement before a larger move lower.
A confirmed close below $66.39 on the 1-hour chart would be the initial signal for bears. However, a more robust confirmation would be a daily close below $64.97, which would align with the bearish indicators on the longer timeframes and potentially lead to a swift decline towards $62.54.
The Waiting Game: Consolidation Above $67.47
A third possibility is that XAGUSD enters a consolidation phase, trading within a defined range as market participants await clearer signals. This scenario could unfold if the price fails to decisively break above $67.81 resistance or hold above $66.39 support. In this case, we might see XAGUSD oscillate between these two levels, creating a choppy, range-bound market. The ADX readings across different timeframes show mixed signals – strong on 4H (47.29, but contradicting RSI), moderate on 1H (21.57), and weak on 1D (14.88). This suggests that the market lacks a clear directional conviction at this precise moment, especially if the price remains glued around the $67.47 mark. Such a phase could be characterized by lower volatility and a lack of strong directional trends, making it challenging for trend-following strategies but potentially offering opportunities for range traders.
This neutral scenario is often a precursor to a larger move. It allows oscillators to reset from their extreme readings – the 1H RSI could cool off from its overbought territory, and the Stochastic could move out of its extreme zones. The market would effectively be digesting the recent price action and waiting for new fundamental catalysts, such as upcoming inflation reports or central bank commentary, to provide direction. Until then, traders might adopt a cautious approach, focusing on price action at the boundaries of the established range ($66.39 to $67.81) and waiting for a decisive breakout or breakdown.
If XAGUSD consolidates between $66.39 and $67.81, range traders might look to buy near the lower bound and sell near the upper bound, managing risk tightly with stops placed just outside the range. However, the potential for a breakout means this strategy requires careful monitoring.
Which Scenario Is Most Likely?
Considering the current technical landscape and prevailing market narrative, the most likely scenario in the short to medium term appears to be a continuation of the bullish momentum, albeit with potential for consolidation or a minor pullback before further upside. The confluence of a weakening dollar (DXY at 99.46 and falling), strong inflationary pressures, and a risk-on sentiment in equities provides a supportive environment for silver. The 1H chart's strong buy signals, despite the overbought RSI, suggest that momentum traders are still in play. However, the conflicting signals from the daily chart and the potential for profit-taking at resistance cannot be ignored.
Therefore, I assign a 60% probability to the bullish scenario, assuming XAGUSD can consolidate briefly or pull back slightly before challenging and eventually breaking through the $67.81 resistance. A 30% probability is assigned to the neutral/consolidation scenario, where price grinds sideways between $66.39 and $67.81 as it awaits clearer direction. The bearish scenario, with a 10% probability, would only gain significant traction if key support levels are decisively broken or if the macroeconomic landscape shifts dramatically against commodities.
Bullish Scenario: The Ascent Continues
60% ProbabilityNeutral Scenario: The Waiting Game
30% ProbabilityBearish Scenario: The Retreat Begins
10% ProbabilityWhat I'm Watching This Week
My focus this week remains on the interplay between key price levels and the broader market sentiment. Firstly, I'll be watching the $67.81 resistance level. A decisive break and sustained hold above this point on the 1-hour chart, supported by positive DXY action (holding below 99.50), would validate the bullish scenario. Secondly, I'm closely monitoring the $66.39 support level. A failure to hold this level, particularly on increasing volume and with bearish signals on the daily chart, would flip the script towards a bearish outlook. Finally, I'll be keeping an eye on any geopolitical developments or significant economic data releases that could shift the narrative from inflation concerns to other market-moving factors. The market is ripe for a move, but patience and adherence to defined risk levels will be crucial.
Frequently Asked Questions: XAGUSD Analysis
What happens if XAGUSD breaks above the $67.81 resistance?
If XAGUSD breaks decisively above $67.81 on the 1-hour chart, it would trigger a bullish scenario targeting $68.38 and potentially $69.24. This would be supported by continued dollar weakness and strong inflationary signals.
Should I buy XAGUSD at current levels of $67.47 given the RSI at 71.77?
Buying at current levels carries risk due to the overbought RSI (71.77) on the 1H chart. A more prudent approach would be to wait for a slight pullback towards $66.39 support or confirmation of a break above $67.81, with tight risk management.
Is the RSI at 71.77 a sell signal for XAGUSD right now?
An RSI reading of 71.77 on the 1H chart indicates overbought conditions, which can precede a pullback or consolidation. While not an immediate sell signal in a strong uptrend, it suggests caution for new long entries and signals potential for short-term profit-taking.
How will the upcoming economic data affect XAGUSD this week?
While no high-impact events are immediately listed, any surprises in inflation or central bank commentary could significantly impact XAGUSD. Stronger-than-expected inflation data would likely support the bullish case, whereas signs of cooling inflation or hawkish policy shifts could pressure silver downwards.
| Indicator | Value | Signal | Interpretation |
|---|---|---|---|
| RSI (14) | 71.77 | Overbought | Approaching extreme levels, potential for pullback. |
| MACD Histogram | +0.61 | Positive | Momentum strengthening. |
| Stochastic | 93.63 / 74.39 | Overbought | K line in extreme zone, D line rising. |
| ADX | 21.57 | Moderate Trend | Uptrend is present and gaining some strength. |
| Bollinger Bands | Upper Band Break | Bullish Break | Price trading above the upper band, indicating strong upward momentum. |
Track markets in real-time
AI-powered analysis, technical indicators and real-time price data.
Join Our Telegram Channel
Breaking market news, AI analysis and trading signals instantly.
Join Channel