The surge in WTI crude oil prices to $91.58 is more than just a technical bounce; it's a clear signal of shifting market dynamics, driven by a potent cocktail of resurgent inflation fears and escalating geopolitical risks. Having witnessed a significant 2.2% jump today, WTI is not merely reacting to price action but is being fundamentally reshaped by global events that echo the inflationary pressures of recent years. As traders and analysts digest the latest economic data and the evolving geopolitical landscape, understanding the interplay between energy markets, macroeconomic indicators, and global stability becomes paramount. This analysis delves into the intricate web of factors influencing WTI's current trajectory, providing a comprehensive outlook for the days and weeks ahead.
- RSI at 54.86 indicates a neutral but rising momentum for WTI, suggesting potential for further upside if key resistance is breached.
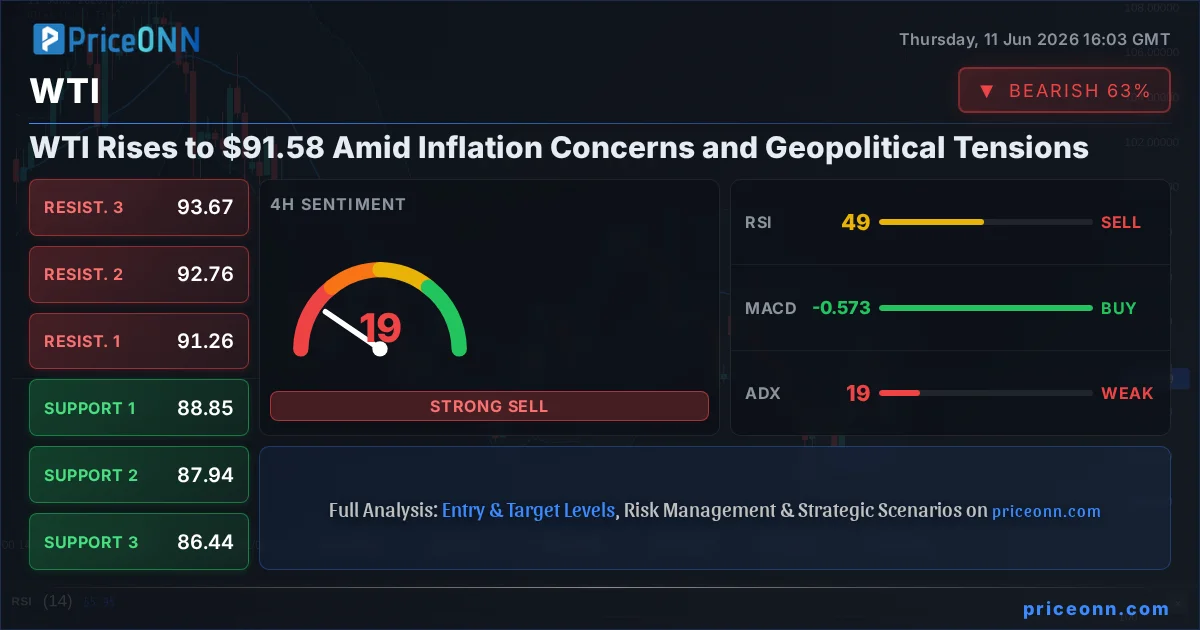
- Critical support for WTI is holding around $86.85, with the next significant level at $84.09, while resistance looms at $92.41 and $95.21.
- The strong upward correlation with the Dollar Index (DXY) at 99.99 suggests that a weaker dollar could further propel WTI prices.
- Geopolitical tensions, particularly in the Middle East, are adding a significant risk premium to oil prices, influencing supply-side expectations.
Navigating the Currents: WTI's Climb and Macroeconomic Crosscurrents
WTI crude oil is currently trading at $91.58, marking a notable 2.2% increase on the day. This upward momentum is occurring within a broader market context where inflation remains a central concern for global policymakers. The recent USD inflation data, showing a 0.5% month-on-month rise in the Consumer Price Index (CPI) and meeting forecasts, underscores the persistent inflationary pressures. While this might typically lead to a stronger dollar and put pressure on commodities, the current market narrative is more complex. The Dollar Index (DXY) itself is showing strength, currently at 99.99, which usually suggests headwinds for oil. However, WTI's resilience in the face of a strong dollar highlights the overwhelming influence of supply-side concerns and energy security fears. The market is grappling with the delicate balance between tighter monetary policy aimed at curbing inflation and the reality of energy prices being a significant driver of that inflation.
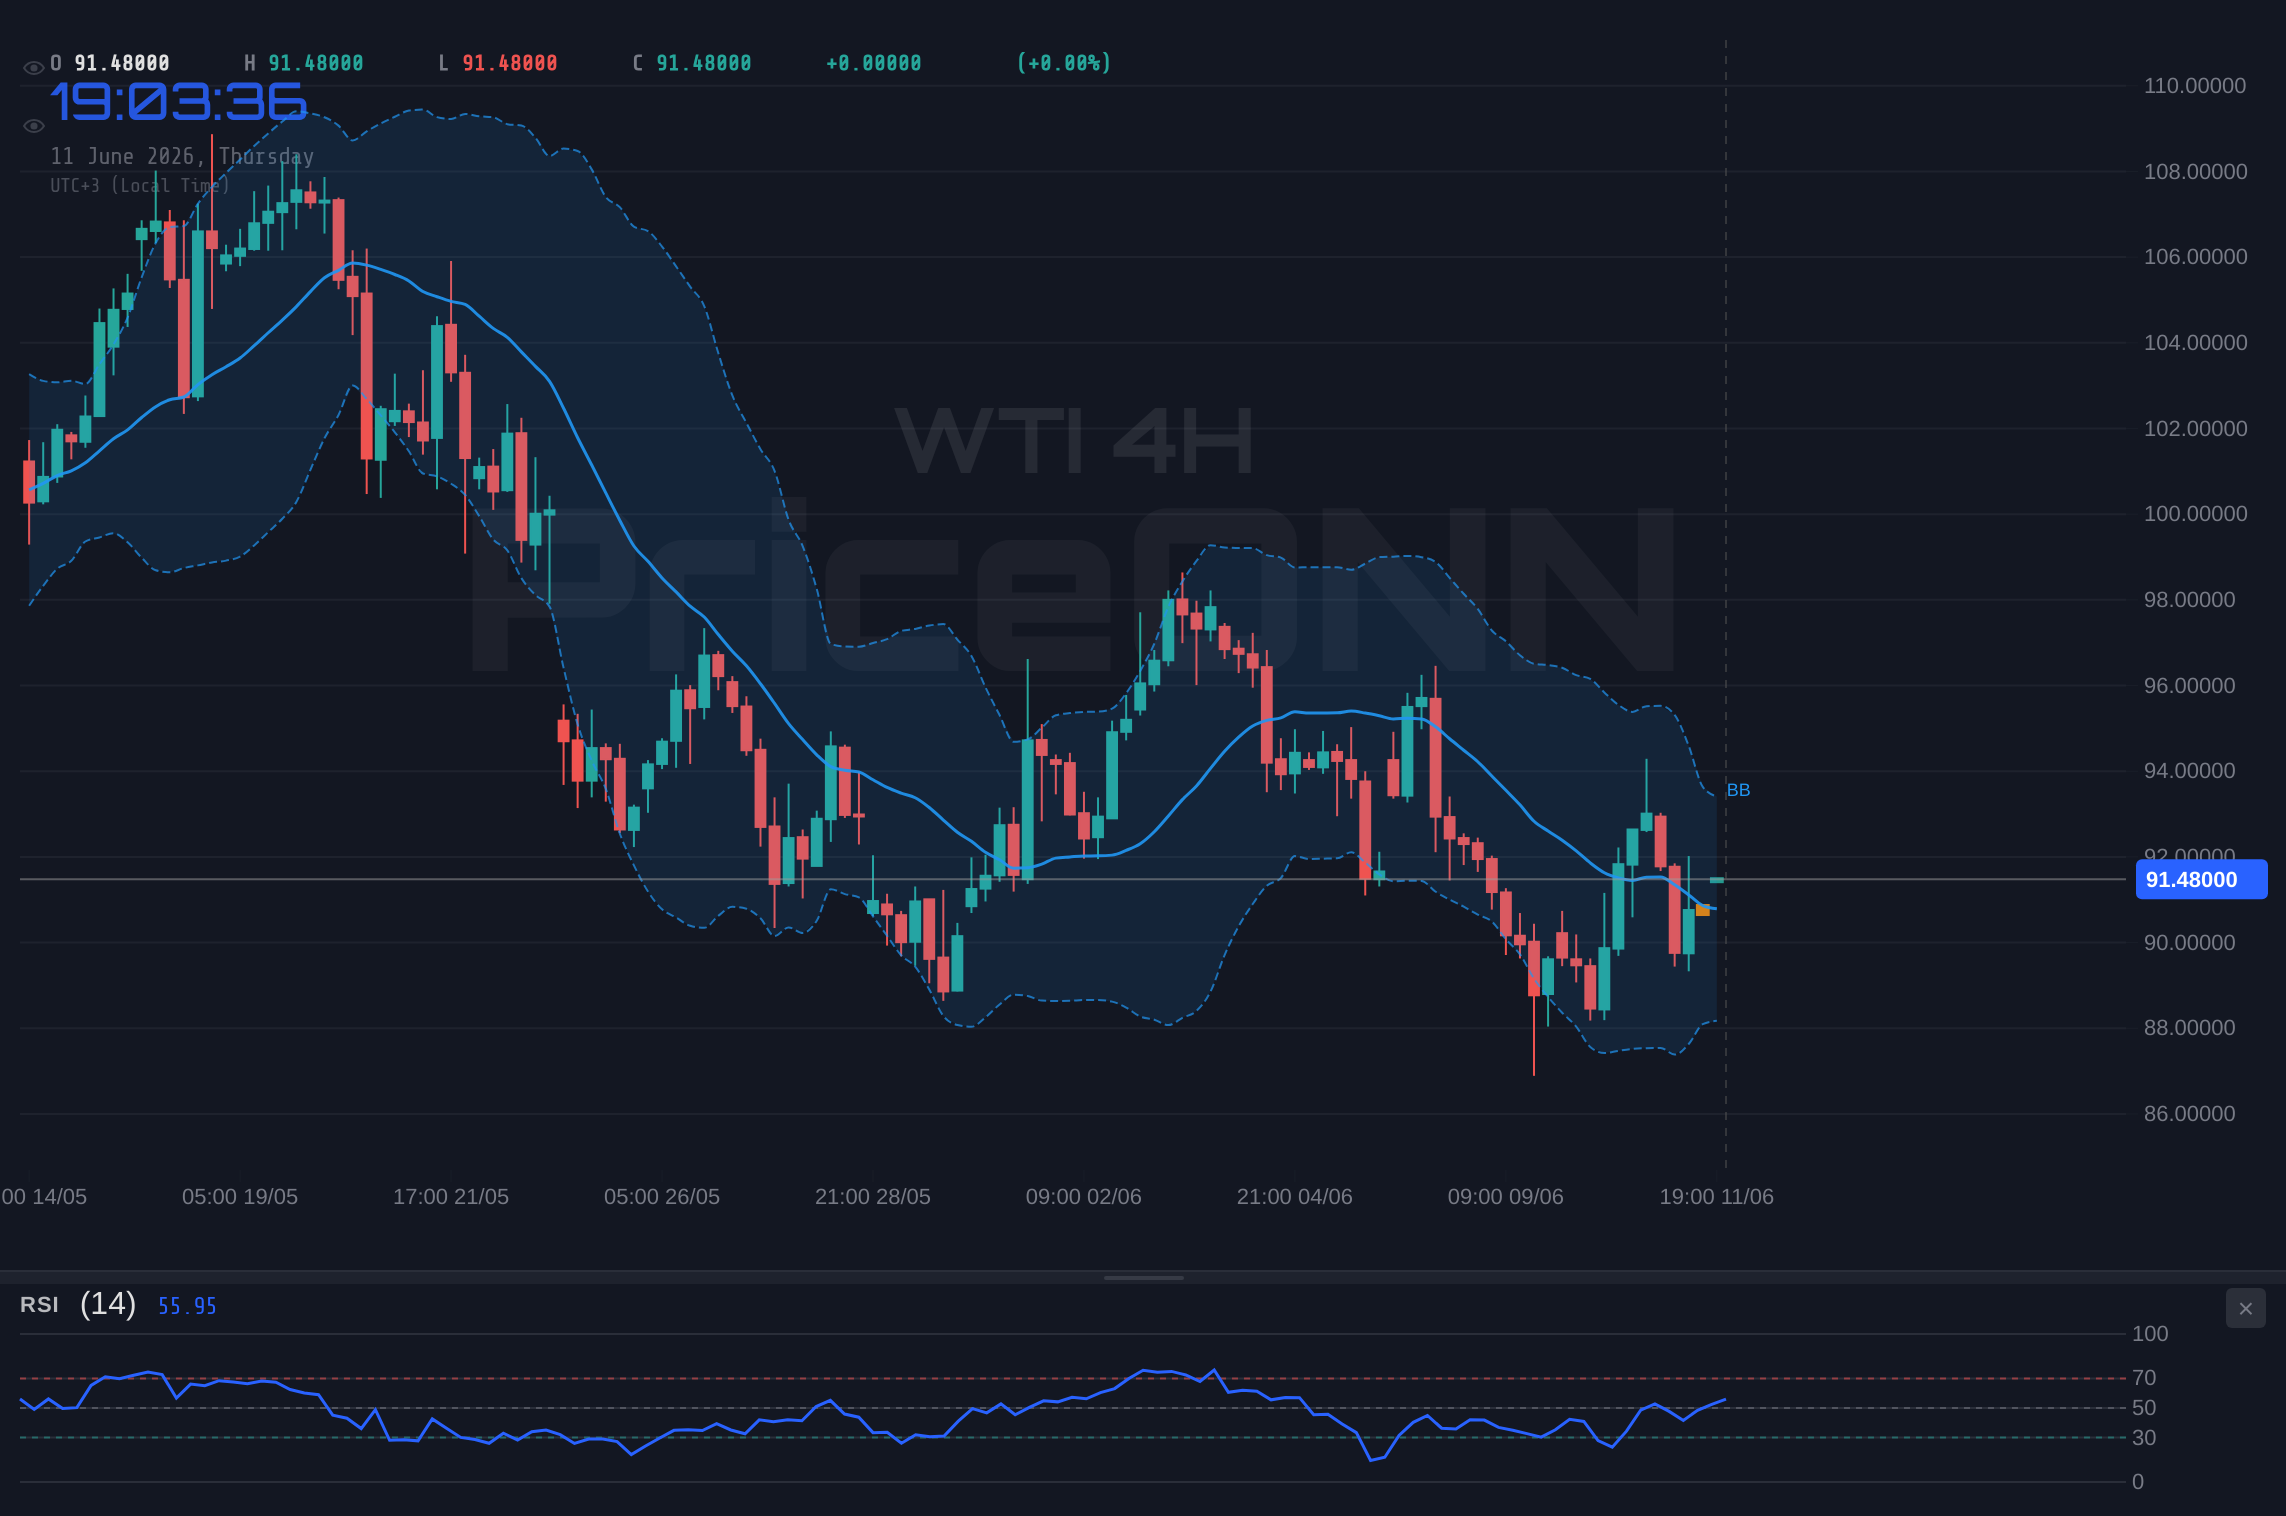
The technical indicators on the 1-hour chart paint a picture of cautious optimism, with the RSI at 54.86 suggesting that while momentum is positive, it's far from being overbought territory. This provides room for further upward movement. The ADX at 20.88 indicates a moderate trend strength, suggesting that the current move has some legs, though it's not yet a runaway trend. On the 4-hour chart, the picture becomes more neutral, with RSI at 49.27 and ADX at 18.62, pointing towards a market that is consolidating or transitioning. This divergence between timeframes underscores the importance of a multi-timeframe approach, where short-term bullish signals are tempered by the broader, more neutral or consolidating picture on longer timeframes. The key takeaway here is that while the immediate pressure is upwards, the sustainability of this rally hinges on breaking through immediate resistance levels without succumbing to broader risk-off sentiment.
Geopolitical Undercurrents: The Middle East Premium in Oil Prices
The energy markets, and WTI in particular, are highly sensitive to geopolitical developments, and recent events in the Middle East are casting a long shadow. The escalating conflict, as highlighted by news of the European Central Bank (ECB) raising interest rates while simultaneously acknowledging deepening Middle East conflicts and their impact on energy costs, directly influences crude oil prices. While the ECB's focus is on inflation within the Eurozone, the broader implication of increased energy costs due to geopolitical instability cannot be ignored. The market is pricing in a risk premium for crude oil, anticipating potential supply disruptions. This premium is difficult to quantify precisely but is a significant factor supporting prices above fundamental supply/demand balances. The fact that WTI is showing a strong upward trend on the 1-hour chart, with signals leaning towards a 'BUY', while the 1D chart shows a neutral trend with mixed signals, suggests that short-term traders are reacting more to the immediate geopolitical headlines, while longer-term investors are perhaps awaiting more clarity on the sustained impact on global energy flows.
This elevated geopolitical risk environment means that even minor flare-ups can trigger significant price swings. Traders are constantly assessing the probability of supply chain interruptions, and any news that suggests instability in major oil-producing regions can lead to rapid price increases. The current ADX of 20.88 on the 1-hour chart, while indicating a moderate trend, doesn't fully capture the volatility that geopolitical news can inject. It's crucial to remember that these are not just abstract price movements; they reflect real-world fears about energy security, which have profound economic implications. The correlation with the Dollar Index (DXY) at 99.99 also plays a role. While a stronger dollar often dampens oil prices, the current risk-on sentiment driven by geopolitical fears can sometimes override this inverse correlation, especially if the strength in the dollar is perceived as a safe-haven move rather than a reflection of strong economic fundamentals.
Technical Battleground: Key Levels and Indicator Divergence
Examining the technical landscape, WTI finds itself at a critical juncture. On the 1-hour timeframe, the immediate resistance is flagged at $92.41, with further levels at $95.21 and $96.57. These are the immediate hurdles that bulls need to clear for sustained upward movement. Conversely, support is robustly established around $86.85, followed by $84.09 and $81.29 on the daily chart. The current price of $91.58 sits uncomfortably between these significant levels, highlighting the potential for volatility. The RSI(14) on the 1-hour chart is at 54.86, indicating a neutral-to-bullish bias, but the Stochastic oscillator's %K (53.41) crossing below %D (26.58) on the 1-hour chart signals a potential pullback, even as the 4-hour Stochastic shows a bullish crossover. This divergence is a key area of focus; it suggests that while short-term momentum might be building, the underlying trend is not yet definitively established, and caution is warranted.
The daily chart presents a more consolidated view, with RSI at 43.94 and ADX at 12.57, suggesting a weak trend and a market in consolidation or ranging conditions. This is a crucial point for traders. The strong immediate uptrend on the 1-hour chart, driven by headlines, might be lulling some into a false sense of security. However, the longer-term indicators suggest that significant upside might be capped unless there's a clear catalyst to break out of this consolidation. The Bollinger Bands on the daily chart are below the middle band, indicating a bearish tendency, yet the Stochastic is showing a bullish signal, implying a potential bottoming formation or a relief rally within a larger downtrend. This mix of signals is precisely why clear levels and confirmation are vital. Without a decisive break above the $92.41 resistance, the risk of a pullback towards the support levels remains significant.
Market Sentiment and Correlation: DXY, Equities, and the Risk Appetite
Understanding WTI's price action requires looking beyond the crude oil market itself. The Dollar Index (DXY) is currently trading at 99.99, showing a strong upward trend on the 1-hour chart. Historically, a strengthening dollar tends to put downward pressure on dollar-denominated commodities like WTI. However, as noted, the current geopolitical premium is somewhat overriding this inverse relationship. If the DXY were to break significantly higher, it would likely add headwinds to oil prices, especially if it signifies a broader risk-off sentiment. Speaking of risk appetite, the S&P 500 is showing a 0.74% gain to 6572.87, while the Nasdaq 100 is down 0.94% to 28821.79. This divergence between the indices suggests a mixed market sentiment. The Nasdaq's weakness could be a precursor to a broader risk-off move, which would typically be bearish for commodities like WTI, despite the geopolitical tailwinds. The Dow Jones Industrial Average is also down 1.14% to 50236, reinforcing the notion of a cautious or even risk-averse sentiment in the broader equity markets.
This mixed sentiment is reflected in WTI's own technical indicators. While the 1-hour chart shows bullish signals, the longer-term daily charts suggest a more cautious approach. The ADX on the daily chart is a mere 12.57, indicating a lack of strong trend. This means that the current upward move might be a short-term reaction rather than the start of a sustained rally. If global equities continue to weaken, it could easily pull WTI prices down, irrespective of geopolitical headlines. The market is at an interesting crossroads where conflicting forces - geopolitical fear pushing oil up, and potential economic slowdown/risk-off sentiment pulling it down - are battling for dominance. This is why focusing on the key support and resistance levels is crucial for navigating such choppy conditions. The $91.58 price point is currently testing the upper bounds of a range that has been in play, and a decisive break higher or lower will likely be dictated by these broader market forces and geopolitical developments.
The Trader's Perspective: Navigating Uncertainty with Data
For traders looking to position themselves in WTI, the current environment demands a disciplined approach. The 1-hour chart suggests a potential for a short-term bullish move, targeting resistance levels around $92.41 and $95.21. A break above $92.41, supported by increasing volume and positive confirmation from longer-term indicators, could signal further upside. However, the neutral signals on the 4-hour and daily charts, coupled with a weak ADX on the daily timeframe, suggest that this bullish thesis is fragile. A more conservative approach would be to wait for confirmation, perhaps a strong daily close above $92.41, or a decisive break below the $86.85 support level, which would signal a shift to a more bearish outlook.
The Stochastic oscillator divergence across different timeframes is particularly noteworthy. On the 1-hour chart, %K is below %D, suggesting a near-term pullback, while on the 4-hour chart, %K is above %D, indicating a bullish signal. This conflict highlights the choppiness of the market. The ADX values also tell a story: strong on the 1-hour (20.88), weak on the 4-hour (18.62), and very weak on the daily (12.57). This suggests that while there's short-term momentum, the overall trend lacks conviction. For swing traders, the current price of $91.58 is in a 'no man's land' between significant support and resistance. A patient approach, waiting for a clear breakout or breakdown with confirmation from multiple indicators and broader market sentiment, would be prudent. The market is offering opportunities, but clarity is currently lacking, making risk management paramount.
Economic Calendar Watch: Inflation Data and Central Bank Signals
The economic calendar reveals that the US CPI data for May came in as expected at 0.5% month-on-month, with the core CPI also meeting forecasts. This consistent inflation reading presents a dilemma for central banks. While the Federal Reserve (Fed) is aiming to bring inflation under control, persistent readings like this suggest that the path to their target may be longer than anticipated. The market is closely watching for any signals from the Fed regarding future monetary policy. Although no immediate Fed announcements are listed in the provided data, the implications of this inflation data are significant. If the Fed maintains a hawkish stance or signals a slower pace of rate cuts, it could strengthen the dollar and potentially put pressure on WTI. Conversely, if inflation persists and energy prices continue to climb, it could force central banks to adopt even more aggressive tightening measures, which might eventually dampen economic growth and demand for oil.
The ECB's recent move to hike rates, despite acknowledging the impact of Middle East conflicts on energy costs, shows the tightrope central banks are walking. They are attempting to control inflation without triggering a severe economic downturn. This delicate balancing act adds another layer of uncertainty to the WTI outlook. The correlation between energy prices and inflation is a feedback loop: higher oil prices contribute to inflation, which prompts tighter monetary policy, potentially slowing economic growth and reducing oil demand. The current WTI price of $91.58 is a crucial factor in this loop. If prices remain elevated, it will continue to fuel inflationary concerns, influencing central bank decisions and, consequently, broader market sentiment and the performance of assets like WTI.
The Path Forward: Scenarios for WTI
Considering the confluence of technical signals, geopolitical events, and macroeconomic factors, several scenarios emerge for WTI. The current price of $91.58 finds itself in a zone of significant indecision. The short-term bullish momentum, driven by geopolitical headlines, faces headwinds from longer-term technicals and mixed equity market sentiment.
Bearish Scenario: $91.58 Under Pressure
65% ProbabilityNeutral Scenario: Consolidation Around $91.58
25% ProbabilityBullish Scenario: Breakout Above Resistance
10% ProbabilityFrequently Asked Questions: WTI Analysis
What happens if WTI breaks below the $90.13 support level?
If WTI closes below $90.13, it would invalidate the short-term bullish momentum and likely trigger a move towards the next key daily support at $86.85. This scenario becomes more probable if broader market sentiment turns risk-off or if geopolitical tensions de-escalate unexpectedly.
Should I consider buying WTI at current levels of $91.58 given the RSI at 54.86?
Buying at $91.58 is a high-risk proposition given the conflicting signals. While the 1-hour RSI is neutral-to-bullish, the daily ADX is very weak, suggesting range-bound conditions. A more prudent approach would be to wait for a confirmed break above $92.41 resistance or a test of support near $86.85, with confirmation from longer-term indicators.
Is the RSI at 54.86 a buy signal for WTI right now?
An RSI of 54.86 on the 1-hour chart is not a definitive buy signal; it indicates neutral momentum with a slight upward bias. True buy signals require confluence with other indicators, such as a bullish crossover in Stochastic, a break above resistance, and ideally, a confirmation from longer-term charts that show a strengthening trend.
How will the May CPI data affect WTI prices this week?
The May CPI data, which met expectations, reinforces the inflation narrative. Persistent inflation could lead central banks to maintain or increase interest rates, potentially strengthening the dollar and pressuring oil prices. However, if energy prices remain a key contributor to inflation, as seen with WTI at $91.58, it creates a complex feedback loop that might see oil prices supported despite broader anti-inflationary policy intentions.
The market is currently defined by uncertainty, where geopolitical fears are propping up prices against a backdrop of potential economic slowdown and mixed technical signals. Traders must remain vigilant, focusing on the key levels identified and waiting for confirmation before committing to significant positions. Patience and disciplined risk management are not just advisable; they are essential for navigating this complex environment.
| Indicator | Value | Signal | Interpretation |
|---|---|---|---|
| RSI (14) | 54.86 | Neutral | Neutral momentum, slight upward bias. |
| MACD Histogram | -0.01 | Bearish | Momentum is fading. |
| Stochastic | K=53.41, D=26.58 | Bearish Crossover | %K crossed below %D, suggesting potential pullback. |
| ADX | 20.88 | Moderate Trend | Moderate trend strength on 1H, weak on longer timeframes. |
| Bollinger | Middle Band | Watching | Price trading above the middle band on 1H, below on 4H/1D. |
Track markets in real-time
AI-powered analysis, technical indicators and real-time price data.
Join Our Telegram Channel
Breaking market news, AI analysis and trading signals instantly.
Join Channel