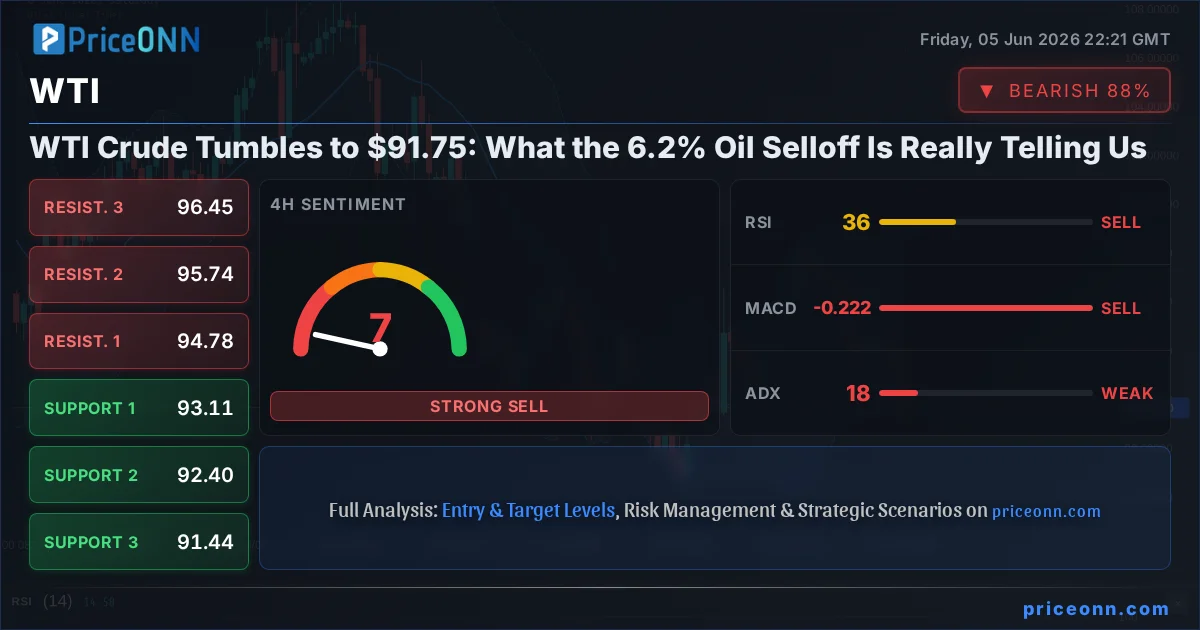
Forget the headline number for a second. Yes, WTI crude sank 6.21% to $91.75, its worst single-session bleed in weeks. But the real tell isn't the size of the drop; it's the company oil is keeping on the way down. Ethereum off 10%, Nasdaq down 5.37%, silver hammered 6.58%, gold lower by 2.4%. When everything from crypto to grain-adjacent commodities gets sold on the same candle, you're not looking at an oil-specific catalyst. You're looking at a liquidity event, and that changes how a WTI today analysis should be read entirely.
- WTI collapsed 6.21% to $91.75, with Brent close behind at $95.65 (-5.24%), a synchronized move that points to macro flows rather than a barrel-specific shock.
- The 1-hour RSI at 26.39 and Stochastic at K=13.49 flag deeply oversold conditions, but the daily ADX at just 12.99 says the broader trend has no conviction yet.
- The dollar index ripped to 99.80 (+0.57%) with a 1H RSI of 80.95, and a stronger DXY mechanically pressures every dollar-priced barrel.
- First intraday support sits at $91.30, with the heavier shelf at $90.49; reclaiming $92.52 is the bulls' first real hurdle.
Time Horizon: This commentary covers the intraday-to-swing window, roughly the next one to two weeks of WTI price action.
Why This WTI Selloff Smells Like Deleveraging, Not Demand Destruction
Here's the thing about a genuine oil demand shock: it shows up in the curve, in refinery margins, in the spread between Brent and WTI. What we got instead was a clean, vertical flush across the entire risk complex on the same session. WTI today analysis only makes sense when you zoom out to the cross-market picture. Brent fell 5.24% to $95.65. Silver, which trades half as an industrial metal and half as a risk proxy, got obliterated for 6.58%. Even the Nasdaq 100, which had been the market's darling, cratered 5.37% to 28,804. That is the signature of forced selling and margin calls, not a sober reassessment of global crude balances.
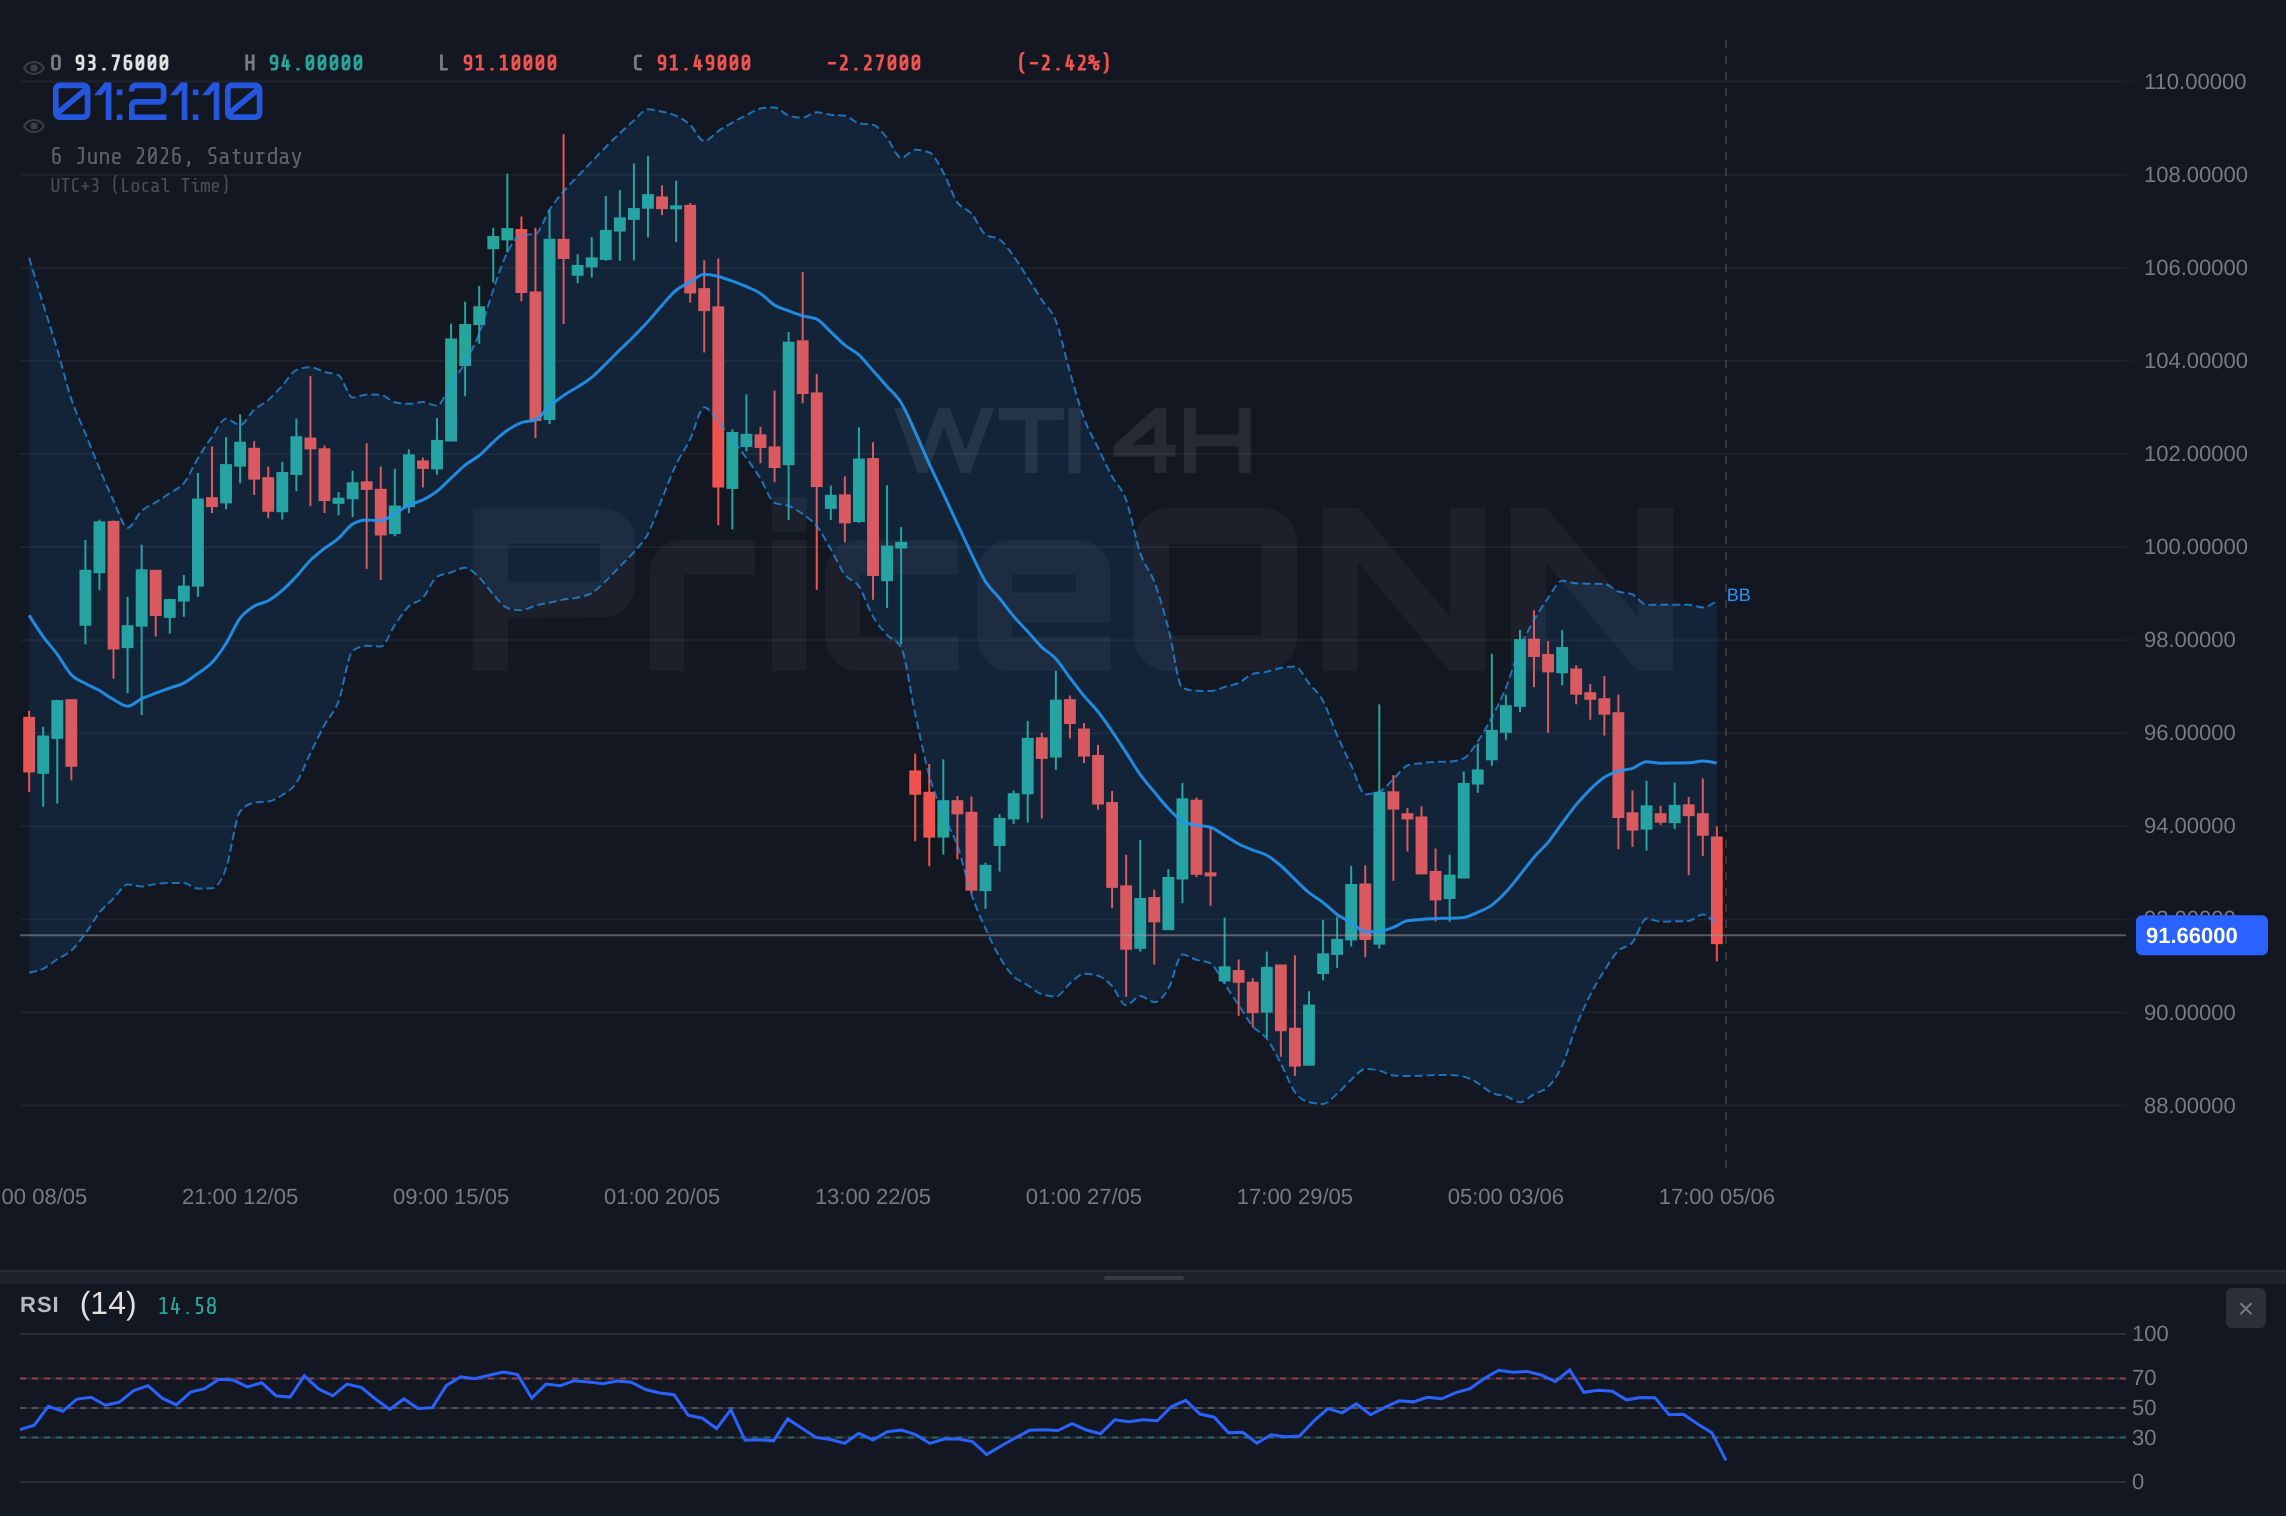
Having watched how these episodes unfold through prior rate cycles, the pattern is familiar. When the dollar surges and leveraged positions get squeezed, the most crowded longs get liquidated first, and commodities sitting in trend-following books are right at the top of that list. The fact that WTI gave back 6.21% in a day, with the daily range stretching from 93.48 down to the current 91.75, tells you stops were run hard. This was a liquidity grab, plain and simple.
An oversold reading is not a buy signal on its own. The 4H ADX at 18.13 confirms a weak, directionless trend, which means knife-catching here carries real risk of getting chopped up before any bounce materializes.
The Dollar Is the Hand on the Scale
You cannot talk about a barrel of oil without talking about the currency it's priced in. The dollar index pushed up 0.57% to 99.80, and on the 1-hour chart its RSI is screaming at 80.95, deep into overbought territory with a strong-trend ADX of 35.49. According to reporting from the session, the dollar strengthened broadly after a much stronger-than-expected US employment report reinforced Fed patience, with USD/JPY clearing the 160 handle. That payrolls beat is the proximate trigger here. A hot labor market means the Fed has zero urgency to cut, real yields stay firm, and the dollar grinds higher.
For WTI, this is a double squeeze. A stronger greenback makes crude more expensive for every buyer holding euros, yen, or rupees, which mechanically dents demand at the margin. And firm real yields raise the opportunity cost of holding any non-yielding commodity. So when you ask why WTI broke lower precisely now, a big part of the answer is sitting in that DXY candle. The dollar's strength is doing a lot of the heavy lifting on the short side, and until that 1H overbought condition in DXY unwinds, oil bulls are swimming against a strong current.
Geopolitics Stopped Paying the Risk Premium
There's a fundamental layer here too, and it cuts the same direction. For weeks, crude had been carrying a geopolitical risk premium tied to tensions around the Strait of Hormuz. That premium is now bleeding out. Last week's optimism on a reopening of the Strait faded, but this week both US and Iranian officials reportedly toned down the rhetoric, and de-escalation is poison for a long position built on fear. When the war premium drains, you don't get a gentle drift; you get exactly the kind of air-pocket move WTI just printed.
Layer on the structural demand worries. India launched a new fuel blend with an 85% ethanol component this week as part of its flex-fuel mobility push, an explicit move to cut oil import dependence. One blend won't move the global balance overnight, but the direction of travel matters: the world's third-largest oil importer is systematically engineering crude out of its energy mix. From an infrastructure standpoint, these substitution programs compound over years, not days, and they sit in the back of every long-term crude buyer's mind.
And here's a nuance worth sitting with. A recent Federal Reserve study found that the US still feels oil shocks, just not the way it did decades ago when the economy was far more energy-intensive per unit of output. That structural shift matters for how this selloff transmits. Cheaper crude is now less of a clean tailwind for growth and less of a clean headwind for inflation than the old playbook assumes. The economy's energy efficiency has muted the macro feedback loop, which is part of why equities and oil can decouple and recouple so violently inside a single deleveraging session.
What the WTI RSI and MACD Signal Are Actually Saying
Now this is where it gets interesting, because the timeframes are telling slightly different stories and you need to hold them together. On the 1-hour chart, WTI is genuinely stretched: RSI at 26.39 sits below the 30 line, and the Stochastic at K=13.49, D=14.44 is pinned in oversold territory. Momentum to the downside has been relentless, with the 1H ADX at 36.49 confirming a strong, well-established intraday downtrend. In isolation, those oscillators whisper that a snapback bounce is overdue.
But step up to the 4-hour and the picture cools off. The 4H RSI at 36.41 has already lifted out of the extreme, the trend reads neutral, and crucially the 4H ADX at just 18.13 tells you there is no real trend conviction at this degree. That is the single most important number in this WTI trend analysis. A sub-20 ADX means the market is choppy and range-prone, the kind of environment where oversold bounces fail and breakouts get faded. The daily timeframe reinforces it: a daily ADX of 12.99 is about as trendless as it gets, even though the daily bias still tilts lower with RSI at 43.25 and MACD below its signal line.
So what do you do with conflicting signals? You wait for confirmation rather than front-running the bounce. The 1H oversold read is real, but with the higher-timeframe trend strength this weak, any rally off these levels needs to prove itself by reclaiming and holding above the near-term pivots before it means anything. Buying purely because RSI flashed 26 is exactly the mistake the tape is set up to punish here.
WTI Support and Resistance: The Levels That Matter Now
Let's get concrete about the WTI key levels traders should have marked. On the downside, the first intraday floor is $91.30, the 1H S1. Lose that on a closing basis and the next shelves are $90.90 and then the more meaningful $90.49, which is the line that separates an ordinary pullback from a deeper capitulation toward the daily support band near $89 to $90. The $90 round number will carry psychological weight on any test.
On the upside, bulls have work to do. The immediate cap is $92.11, and only a clean break and hold above $92.52 would suggest the oversold bounce has any legs. Above that, the 4-hour structure stacks resistance at $94.78 and $95.74, levels that align with where the heavier supply sits after this week's breakdown. Realistically, reclaiming the $95 zone is what it would take to argue this selloff was an overshoot rather than a regime change.
How Different Traders Should Read This Tape
The right response to $91.75 depends entirely on your timeframe. For the scalper, this is a momentum and mean-reversion playground: with the 1H Stochastic at single digits, fast bounces toward $92.11 are tradable, but only with tight risk and zero romance about catching the exact low. For the swing trader, patience is the edge. The weak 4H and daily ADX readings argue against committing to a directional swing until either the oversold bounce confirms above $92.52 or a fresh breakdown below $90.49 opens the daily air pocket. Forcing a swing position into a trendless, high-volatility flush is how accounts get ground down.
For the longer-term, infrastructure-minded participant, the question isn't this candle at all; it's whether $90 to $92 represents value relative to global production costs and the demand trajectory. With substitution programs like India's ethanol push and a fading geopolitical premium, the structural case for crude is murkier than the technicals alone suggest. That doesn't mean lower forever, but it does mean any long thesis here needs a fundamental anchor, not just an oversold oscillator.
The number to obsess over isn't $91.75; it's the DXY at 99.80 with a 1H RSI of 80.95. When that dollar overbought condition finally unwinds, oversold crude gets its cleanest shot at a relief bounce. Watch the dollar, not the barrel.
What Could Flip the Script This Week
The economic calendar is the wildcard. The market is digesting a stronger-than-expected US jobs print that has reinforced the Fed patience narrative and powered the dollar higher. Looking forward, the focus shifts to upcoming US inflation data, which Fed Chair Warsh's incoming meeting will lean on heavily. A hotter inflation read would extend dollar strength and keep pressure on WTI; a softer print could finally let the greenback exhale and hand oversold commodities room to bounce. With several high-impact USD releases clustered on the calendar, including ISM-adjacent prints around the 50.9 forecast level and consumer sentiment near 70.7, volatility is unlikely to settle soon.
The honest read is this: WTI at $91.75 is oversold on the short timeframes but trapped in a trendless, dollar-driven environment where conviction is scarce. This thesis of a relief bounce fails if price closes below $90.49 and the dollar keeps grinding higher. Until the inflation data resolves the Fed picture and the DXY overbought condition unwinds, caution beats heroics. The market always gives a second chance; the discipline is waiting for the tape to confirm rather than guessing the bottom.
Frequently Asked Questions: WTI Analysis
What happens if WTI breaks below $90.49 support?
A confirmed close below $90.49 would mark a deeper capitulation and open the path toward the daily support band near $89 to $90, with the $90 round number acting as the key psychological line. Given the daily ADX at just 12.99, such a move would likely be volatile and choppy rather than a clean trend, so confirmation on a closing basis matters more than an intraday wick.
Is the WTI RSI at 26.39 a buy signal right now?
The 1-hour RSI at 26.39 is technically oversold, but it is not a standalone buy signal. With the 4H ADX at 18.13 and daily ADX at 12.99 both showing a weak, trendless market, oversold bounces frequently fail here. A safer read waits for price to reclaim and hold above the $92.52 pivot before treating the oversold condition as actionable.
Why did WTI and Brent fall together by more than 5% on the same day?
WTI dropped 6.21% to $91.75 while Brent fell 5.24% to $95.65, a synchronized move that points to macro deleveraging rather than a barrel-specific supply shock. The same session saw the Nasdaq down 5.37% and silver off 6.58%, the classic signature of broad risk-off liquidation amplified by a surging dollar index at 99.80.
How will this week's US inflation data affect WTI?
Upcoming US inflation data is the key catalyst, since it shapes the Fed patience narrative that is currently powering the dollar. A hotter-than-expected print would likely extend dollar strength and keep WTI pressured below $92.52, while a softer reading could let the overbought DXY unwind and give oversold crude room to bounce toward the $94.78 resistance zone.
The barrel will find its footing once the dollar stops doing the selling for it. For now, the smart play is to let the macro dust settle, mark $90.49 and $92.52 as your decision lines, and let the market come to you. Volatility this sharp always leaves opportunity in its wake for those who wait for the setup instead of chasing the move.
Track markets in real-time
AI-powered analysis, technical indicators and real-time price data.
Join Our Telegram Channel
Breaking market news, AI analysis and trading signals instantly.
Join Channel