Two camps are staring each other down at $4,331.62, and neither is blinking. On one side, the bulls point to a 1H RSI buried at 20.25 and scream that gold is too cheap to ignore. On the other, the bears wave a daily downtrend running at 93% strength and a dollar index ripping toward fresh highs. This is the kind of standoff that defines the next leg, and XAUUSD today analysis suggests the resolution will not be gentle.
Gold has bled 2.31% on the session, shedding 102.62 points to settle at $4,331.62. The metal has been falling steadily from 4,889.24, and according to recent market commentary the precious metal had spent the past week coiled and waiting on the US jobs report. That report landed, and it landed heavy. So now we have a genuine tug of war: a deeply oversold instrument inside a powerful downtrend, with a freshly emboldened dollar leaning on the sell side. Let's break down who actually has the better hand.
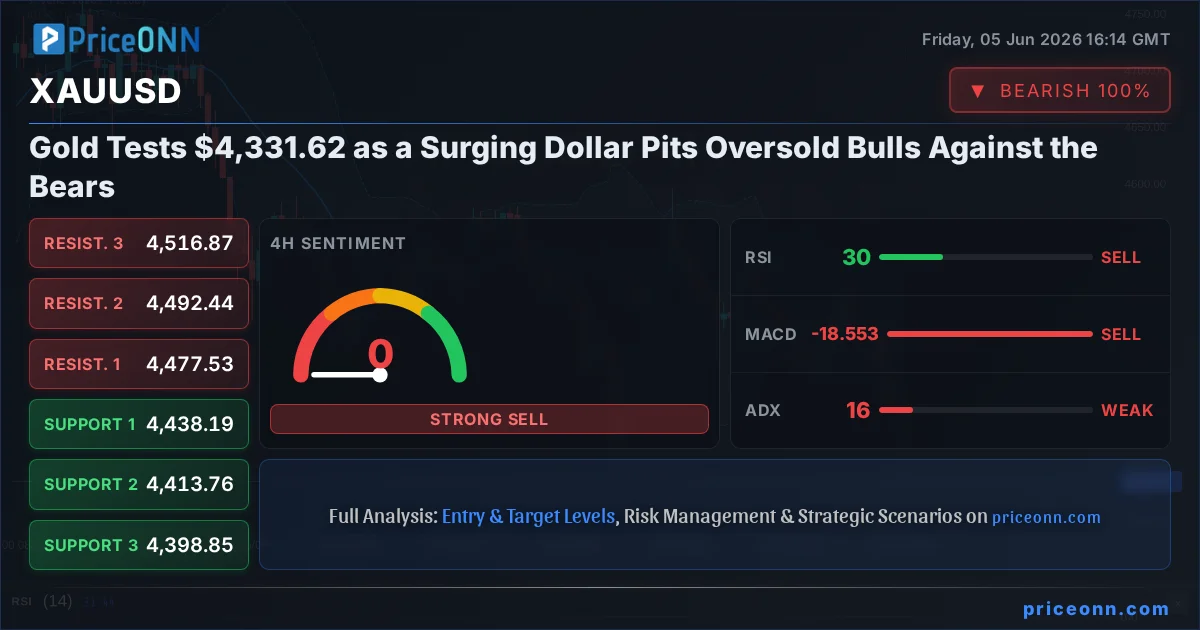
- XAUUSD trades at $4,331.62 after a 2.31% drop, sitting below its own daily range of 4,423.93 to 4,515.08.
- The 1H RSI at 20.25 and 4H RSI at 29.88 flag deeply oversold conditions, the bulls' single strongest argument.
- The daily chart prints a 93% bearish trend with an ADX of 26.63, confirming sellers remain firmly in control of the bigger picture.
- A DXY at 99.77, with a 1H RSI of 80.13, is the dollar headwind keeping gold pinned after strong US payrolls reinforced Fed patience.
Time Horizon: This analysis blends the 1H, 4H and daily timeframes for swing and intraday traders watching how an oversold bounce squares off against a dominant bearish trend.
Why $4,331.62 Has Both Sides Dug In
Here is what makes this level so contested. Price has dropped clean through its daily range and is now trading beneath where it opened the session, which tells you the selling has been relentless rather than orderly. When an asset closes near the bottom of a wide range like 4,423.93 to 4,515.08, it usually signals that sellers refused to let buyers regroup. Yet at the same time, the oscillators are flashing exhaustion. That combination, heavy selling plus extreme oversold readings, is precisely the recipe for a violent fight. Neither a clean continuation nor a clean reversal is guaranteed, and that uncertainty is the whole story.
The Bull Case: An Oversold Spring Wound Too Tight
If you are looking for reasons to buy gold here, the technicals hand you several. Start with momentum. The 1H RSI sits at 20.25, which is not just oversold, it is the kind of reading that often precedes a sharp snapback as short sellers take profit. Drop to the 4-hour chart and the RSI at 29.88 tells the same story, while even the daily RSI at 33.19 is leaning toward the lower end of its range. Across three timeframes, momentum is screaming that the rubber band is stretched.
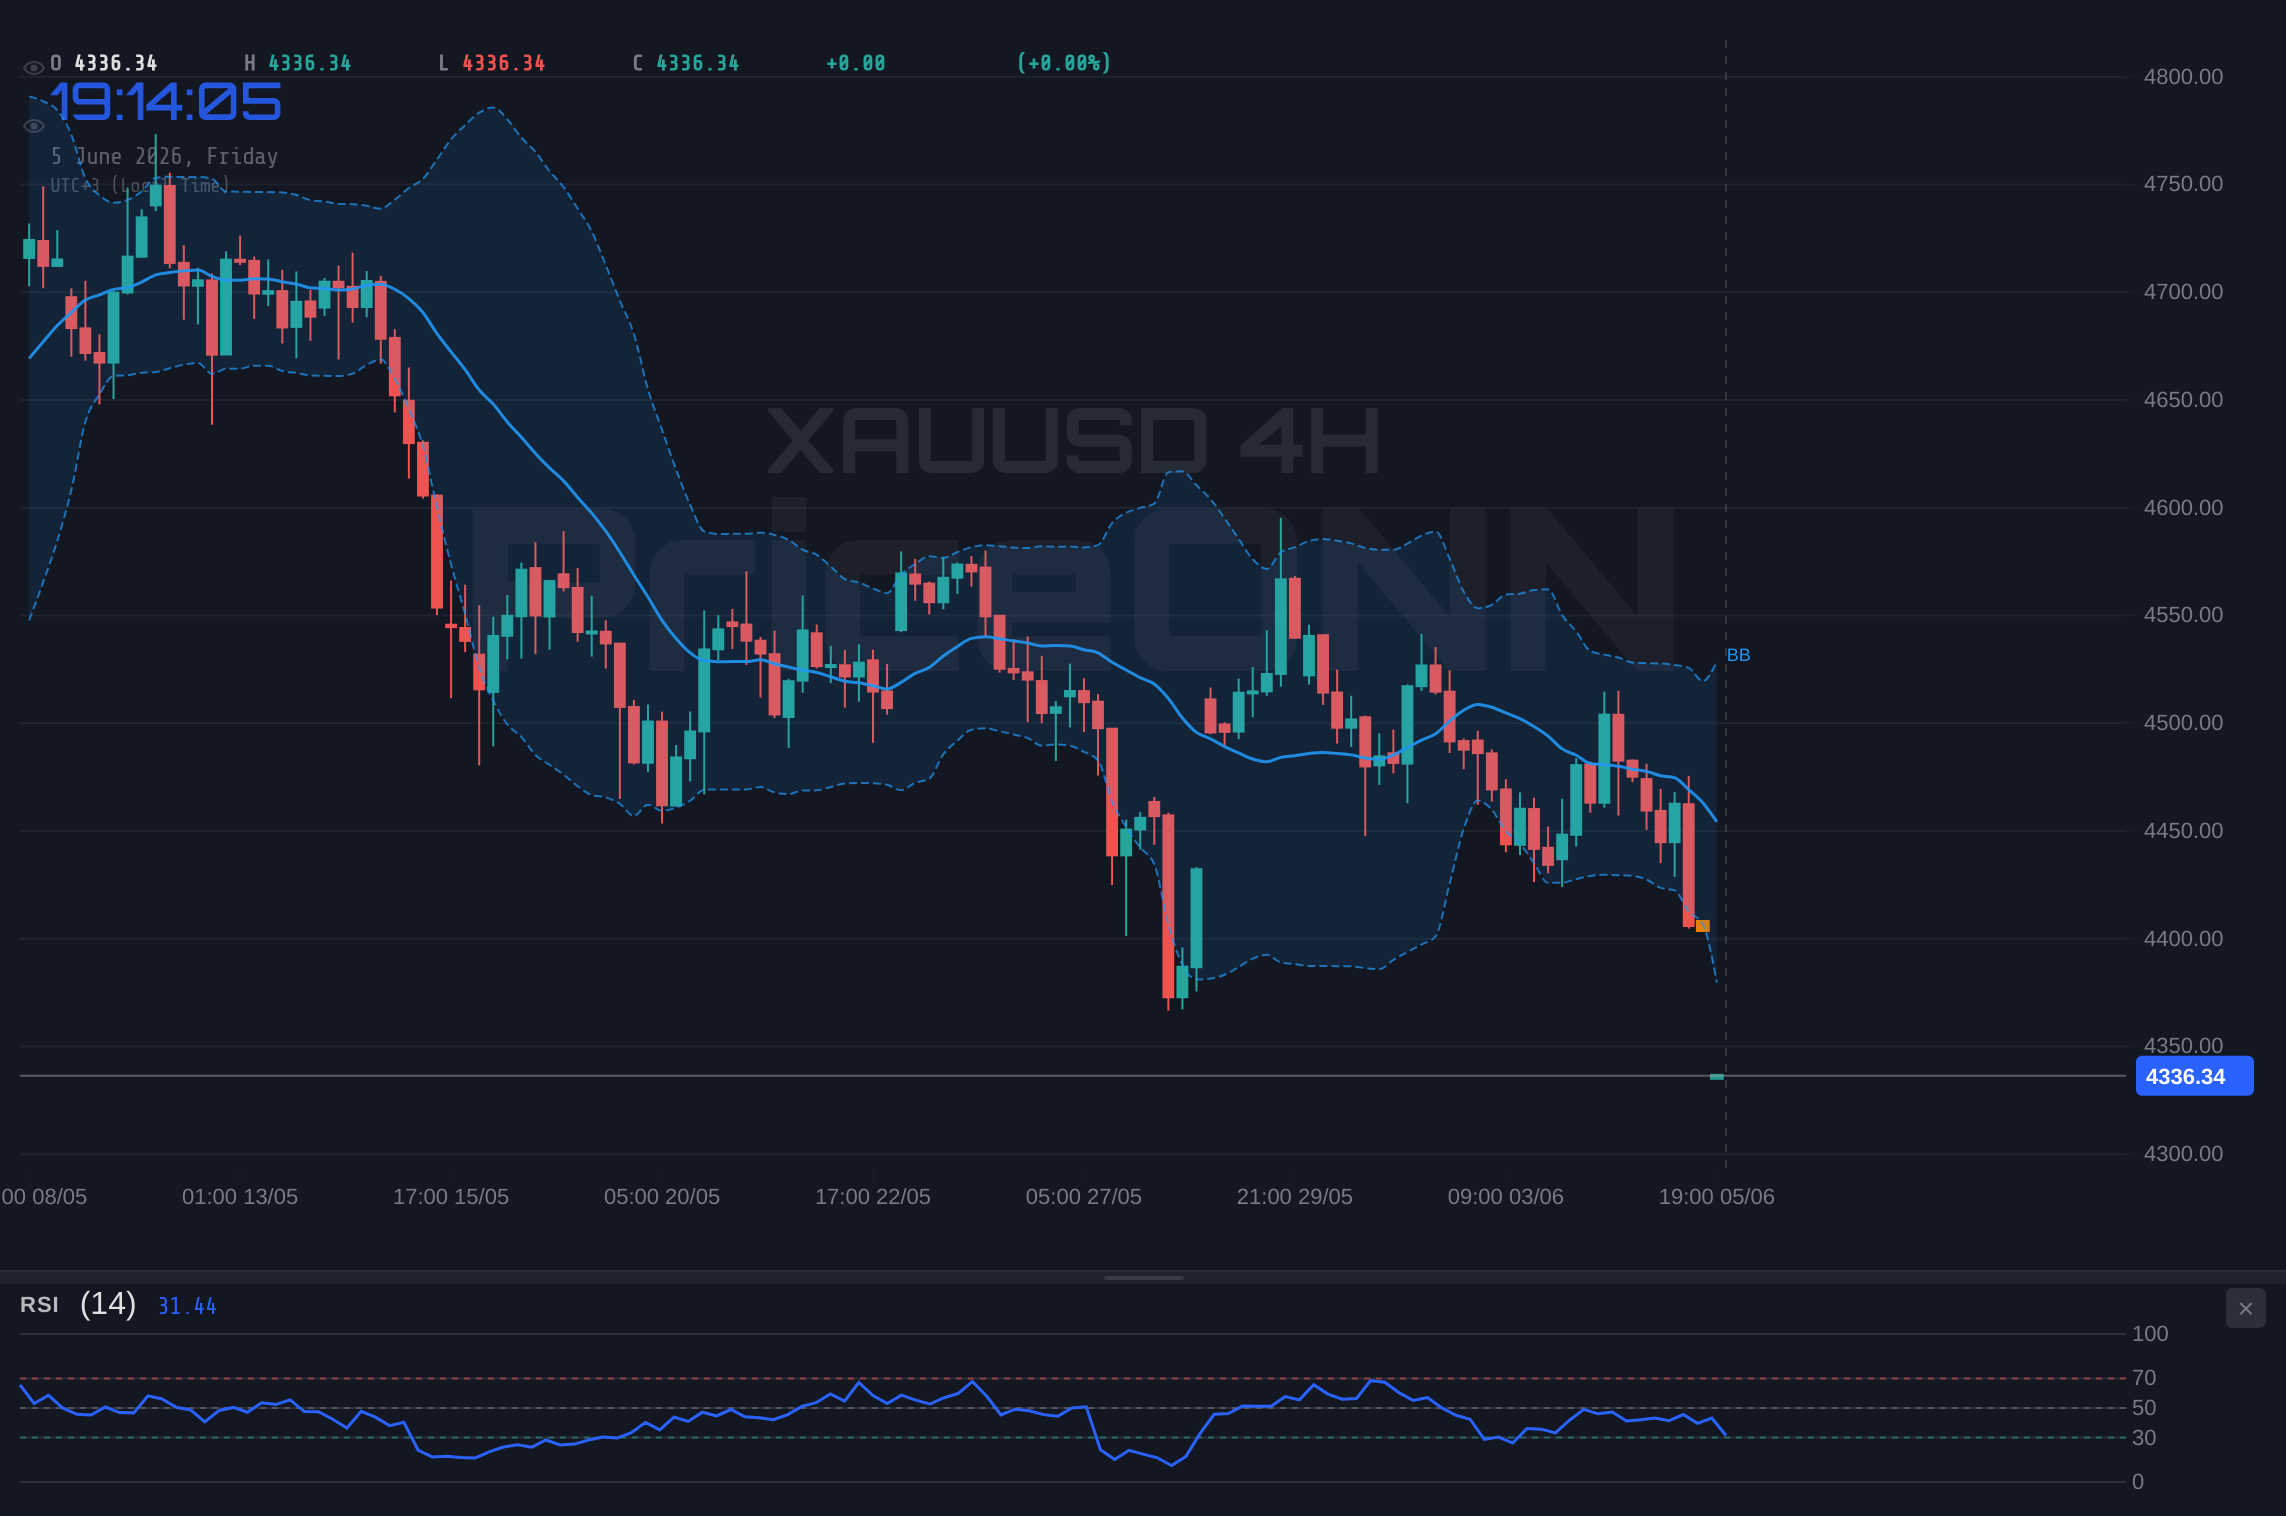
Then there is the Bollinger picture. On both the 1H and 4H charts, price has punched below the lower band, a classic stretched-too-far signal. Bulls will argue that gold rarely stays glued beneath the lower band for long without at least a mean-reversion bounce back toward the midline. Add the safe-haven dimension: equities are taking a beating, with the Nasdaq100 down 2.93% to 29,547.69 and Bitcoin cratering 7.36% to 60,228. In a genuine risk-off panic, gold is supposed to catch a bid. The bull thesis is that once the dollar's payroll-fueled rally cools, capital rotates back into the metal and this oversold reading becomes the launchpad.
An RSI of 20.25 on the hourly with price below the lower Bollinger band is textbook capitulation territory. If buyers step in near $4,315, the first bounce target is the 1H resistance cluster around $4,384.
The Bear Case: A Dollar on Fire and a 93% Downtrend
Now flip the chart and the bears look formidable. The single biggest factor is the dollar. The DXY has surged 0.53% to 99.77, and its 1H RSI of 80.13 confirms aggressive buying momentum, not a fluke spike. Gold and the dollar trade inversely, so a dollar this strong is a wrecking ball for XAUUSD. The catalyst is fundamental and fresh: a much stronger-than-expected US employment report reinforced confidence that the Fed can stay patient on cuts. As one forex desk noted Friday, the dollar strengthened broadly and USD/JPY cleared 160, a level that confirms broad greenback dominance. When the dollar is this aggressive, oversold gold can stay oversold.
The trend structure backs the bears, too. The daily timeframe prints a 93% bearish trend, the 4H sits at 83% bearish, and the daily ADX at 26.63 marks a strong, committed downtrend. This is not a market drifting sideways; it is one with directional conviction to the downside. MACD reinforces it, sitting in negative territory below its signal line across every timeframe we are watching. And the consensus signal on the daily is brutal: 8 sell signals, 0 buy, 0 neutral. When the higher timeframe is that lopsided, fading it has historically been an expensive habit.
A daily downtrend at 93% strength with a unanimous 8-to-0 sell signal is not noise. Until the dollar rally stalls, every oversold bounce risks becoming a fresh selling opportunity for trend traders.
Reading the Tape: When the Indicators Disagree
Here is where it gets interesting, because the timeframes are not telling a single clean story. The 1H trend reads as neutral at 50% strength even though the daily is overwhelmingly bearish. The 4H ADX is the detail most traders will miss: at just 16, it signals a weak trend on that intermediate timeframe, hinting that the immediate selling pressure may be losing organization even as the daily structure stays heavy. Compare that to the 1H ADX of 29.39, which still reads as a strong short-term down impulse. So you have a strong daily trend, a fading 4H trend, and an exhausted hourly momentum profile all stacked on top of each other.
What does a trader actually do with conflicting signals like these? The honest answer is wait for confirmation rather than front-running the bounce. The Stochastic underlines the caution: on the 1H it reads K=6.36 against D=47.34, a deeply depressed reading where %K has cratered below %D. That is the extreme-zone timing problem in a nutshell. Oversold can stay oversold, and trying to catch the exact bottom of a 93% downtrend is how accounts get hurt. The cleaner tell is a reclaim of the 1H resistance at $4,384.10; until that happens, the oversold readings are a warning of two-way volatility, not a green light.
The Cross-Market Picture: Risk-Off, but Gold Isn't the Hero Today
Normally a day this ugly for risk assets would be gold's moment to shine. The Nasdaq100 is down 2.93%, Brent crude has collapsed 4.61% to 96.28, WTI has shed 5.62% to 92.33, and crypto is in freefall with Ethereum down a stunning 11.62% to 1,572.52. That is a classic flight-from-risk tape. Yet gold is falling right alongside them, which tells you something important about market structure: this is a dollar-and-liquidity story, not a pure fear story. When the dollar surges and leverage gets flushed across asset classes, even safe havens get sold as traders raise cash and cover margin.
This decoupling matters. The usual inverse relationship between gold and risk appetite is temporarily overridden by the sheer force of the DXY move. With the dollar index pushing 99.77 and equities under pressure simultaneously, the metal is caught in a squeeze where its safe-haven bid is being outmuscled by dollar strength. Silver tells the same grim tale, with XAGUSD down 5.39% to 68.77 and its own 1H RSI at a battered 17.34. The entire precious metals complex is being repriced lower in dollar terms at once.
The Macro Backdrop: A Fed Countdown and a Patient Central Bank
The fundamental engine behind all of this is policy expectation. The strong payrolls print did more than lift the dollar for an afternoon; it reinforced the narrative that the Fed has room to be patient rather than rushing to cut. Higher-for-longer rate expectations raise the opportunity cost of holding a non-yielding asset like gold, which is the textbook headwind weighing on XAUUSD right now. Looking forward, market chatter points to a Fed countdown beginning, with Fed Chair Warsh's first meeting approaching and key US inflation data on the horizon that could reshape expectations all over again.
The economic calendar carries a cluster of high-impact US releases in the days ahead, and that is the wildcard. The forecasts on deck lean toward steady-to-firm US data, and any upside surprise on inflation would pour more fuel on the dollar and, by extension, more pressure on gold. A downside miss, however, would be the bulls' best hope, since softer data could revive rate-cut bets, knock the DXY off its perch, and let that oversold spring finally release. Until those numbers print, this remains a market holding its breath.
The Verdict: Bears Hold the Edge, but Respect the Spring
Weigh both sides honestly and the bears have the stronger hand for now. A 93% daily downtrend, a unanimous daily sell signal, MACD negative across the board, and a dollar on fire is a lot of weight to fight. The bull case rests almost entirely on oversold readings, and oversold alone has never been a reason to step in front of a freight train. That said, the spring is wound dangerously tight. With the 4H ADX fading to 16 and momentum this stretched, a sharp counter-trend bounce can erupt without warning, especially if the dollar rally pauses. The professional read here is patience over prediction: let the market show whether it can reclaim $4,384.10 before betting on a turn, and respect that this thesis flips if a soft inflation print knocks the DXY back below its breakout. This is choppy, headline-driven terrain, and that is exactly why disciplined observation beats forcing a trade.
XAUUSD Scenarios: Mapping the Next Move
Trend Continuation: Dollar Dominance Persists
60% ProbabilityOversold Stall: A Volatile Range Forms
25% ProbabilityMean-Reversion Snapback: The Spring Releases
15% ProbabilityXAUUSD Support and Resistance: The Key Levels
Frequently Asked Questions: XAUUSD Analysis
What happens if XAUUSD breaks below $4,315 support?
A clean break below the 1H support at $4,315 would confirm the 93% daily downtrend is extending and likely accelerate selling. With MACD negative across all timeframes and the dollar surging, a breakdown there opens the door to a deeper move as oversold conditions get pushed even further.
Is the RSI at 20.25 a buy signal for gold right now?
Not on its own. An RSI of 20.25 flags deeply oversold conditions, but inside a 93% bearish daily trend with a DXY at 99.77, oversold can stay oversold for a long time. The cleaner confirmation is an hourly close back above $4,384.10 before treating the bounce as real.
Why is gold falling at $4,331.62 even as stocks sell off?
Because this is a dollar-and-liquidity move rather than a pure fear trade. With the DXY up 0.53% to 99.77 and assets from the Nasdaq100 to Ethereum being liquidated, traders are raising cash and the dollar's strength is overriding gold's usual safe-haven bid.
How will upcoming US inflation data affect XAUUSD this week?
It is the key catalyst. After strong payrolls reinforced Fed patience, a hot inflation print would likely extend dollar strength and pressure gold further. A softer-than-expected reading is the bulls' best hope, since it could revive rate-cut bets, weaken the DXY, and finally release the oversold spring back toward $4,384.
Track markets in real-time
AI-powered analysis, technical indicators and real-time price data.
Join Our Telegram Channel
Breaking market news, AI analysis and trading signals instantly.
Join Channel