Friday's US employment report did not just move the dollar. It detonated under the entire precious metals complex, and silver took the hardest hit of them all. A jobs print strong enough to keep the Fed comfortably on pause sent the Dollar Index screaming to 99.81, and when the greenback roars like that, hard assets priced in dollars rarely escape unscathed. XAGUSD today analysis tells a brutal story: a 5.05% single-session collapse to $69.02, the kind of move that flushes out leveraged longs and rewrites every short-term chart.
Time Horizon: This analysis covers the intraday-to-swing window, blending the 1H, 4H, and daily timeframes for both active traders and position holders.
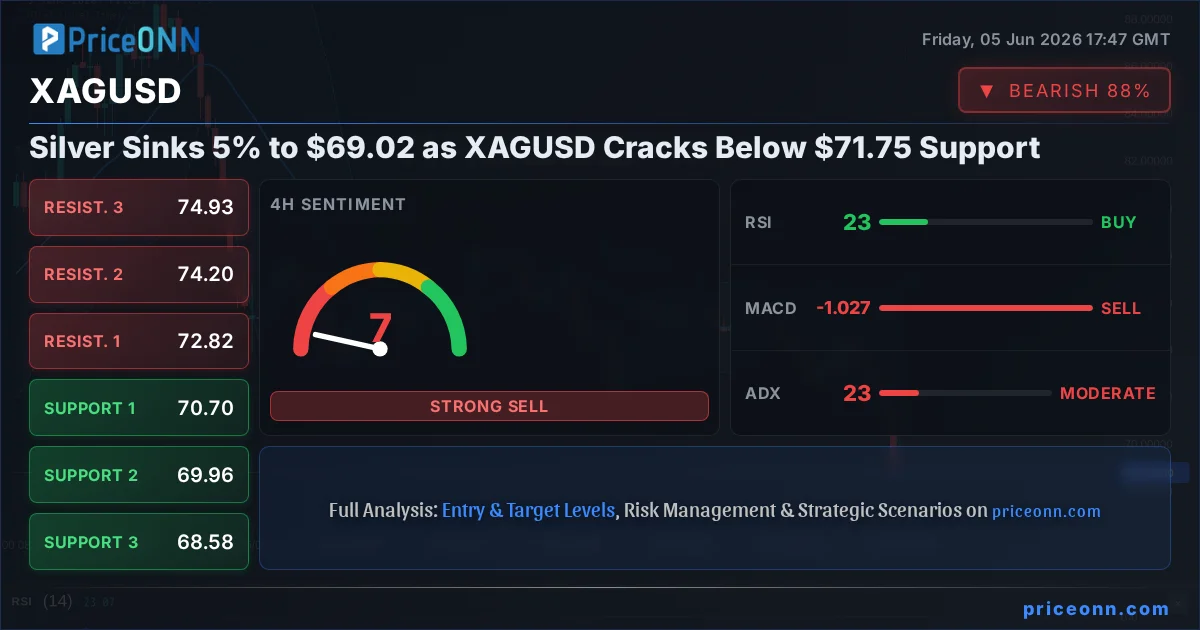
- Silver collapsed 5.05% to $69.02, decisively breaking below the $71.75 daily support that had held the prior range.
- The 1H RSI at 21.63 and 4H RSI at 23.67 both sit deep in oversold territory, yet a 100% strength 1H downtrend warns against catching the falling knife.
- DXY surged 0.57% to 99.81 with its own RSI at 80.97, the dollar strength that is mechanically pressuring every metal.
- ADX at 46.78 on the hourly confirms this is a powerful, committed sell-off, not random noise; first resistance to reclaim is $69.28.
When the Dollar Roars, Silver Pays the Toll
Let's start with the catalyst, because the technicals only make sense once you understand what lit the fuse. The dollar strengthened broadly in the early US session after a much stronger-than-expected employment report reinforced confidence that the Fed has every reason to stay patient. USD/JPY cleared 160 and the Dollar Index ripped higher to 99.81, up 0.57% on the day with a daily range that stretched from 98.90 all the way up to 99.27 before extending. When the dollar appreciates this aggressively, dollar-denominated metals like silver become more expensive for holders of every other currency, and demand mechanically softens.
Now this is where it gets interesting. Silver is not pure monetary metal the way gold is. Roughly half of silver demand is industrial, which means XAGUSD carries a double sensitivity: it bleeds when the dollar rises, and it bleeds again when growth-sensitive risk appetite sours. Look across the board on this session and you see exactly that dynamic playing out. Brent crude cratered 5.22% to $95.67, WTI dumped 6.37% to $91.60, and the Nasdaq 100 shed 3.30% to 29,435. That is a textbook risk-off, growth-fear cocktail, and silver got hit from both barrels. Gold fell too, but only 2.05% to $4,343.35. Silver lost more than double that. The metal's industrial DNA turned a dollar headache into a full-blown rout.
The gold-silver ratio sits near 62.9 after this session. Silver's steeper 5% drop versus gold's 2% reflects its industrial exposure: with Brent down 5.22% and equities selling off, the market is pricing softer industrial demand on top of the dollar headwind.
Why $71.75 Was the Line in the Sand
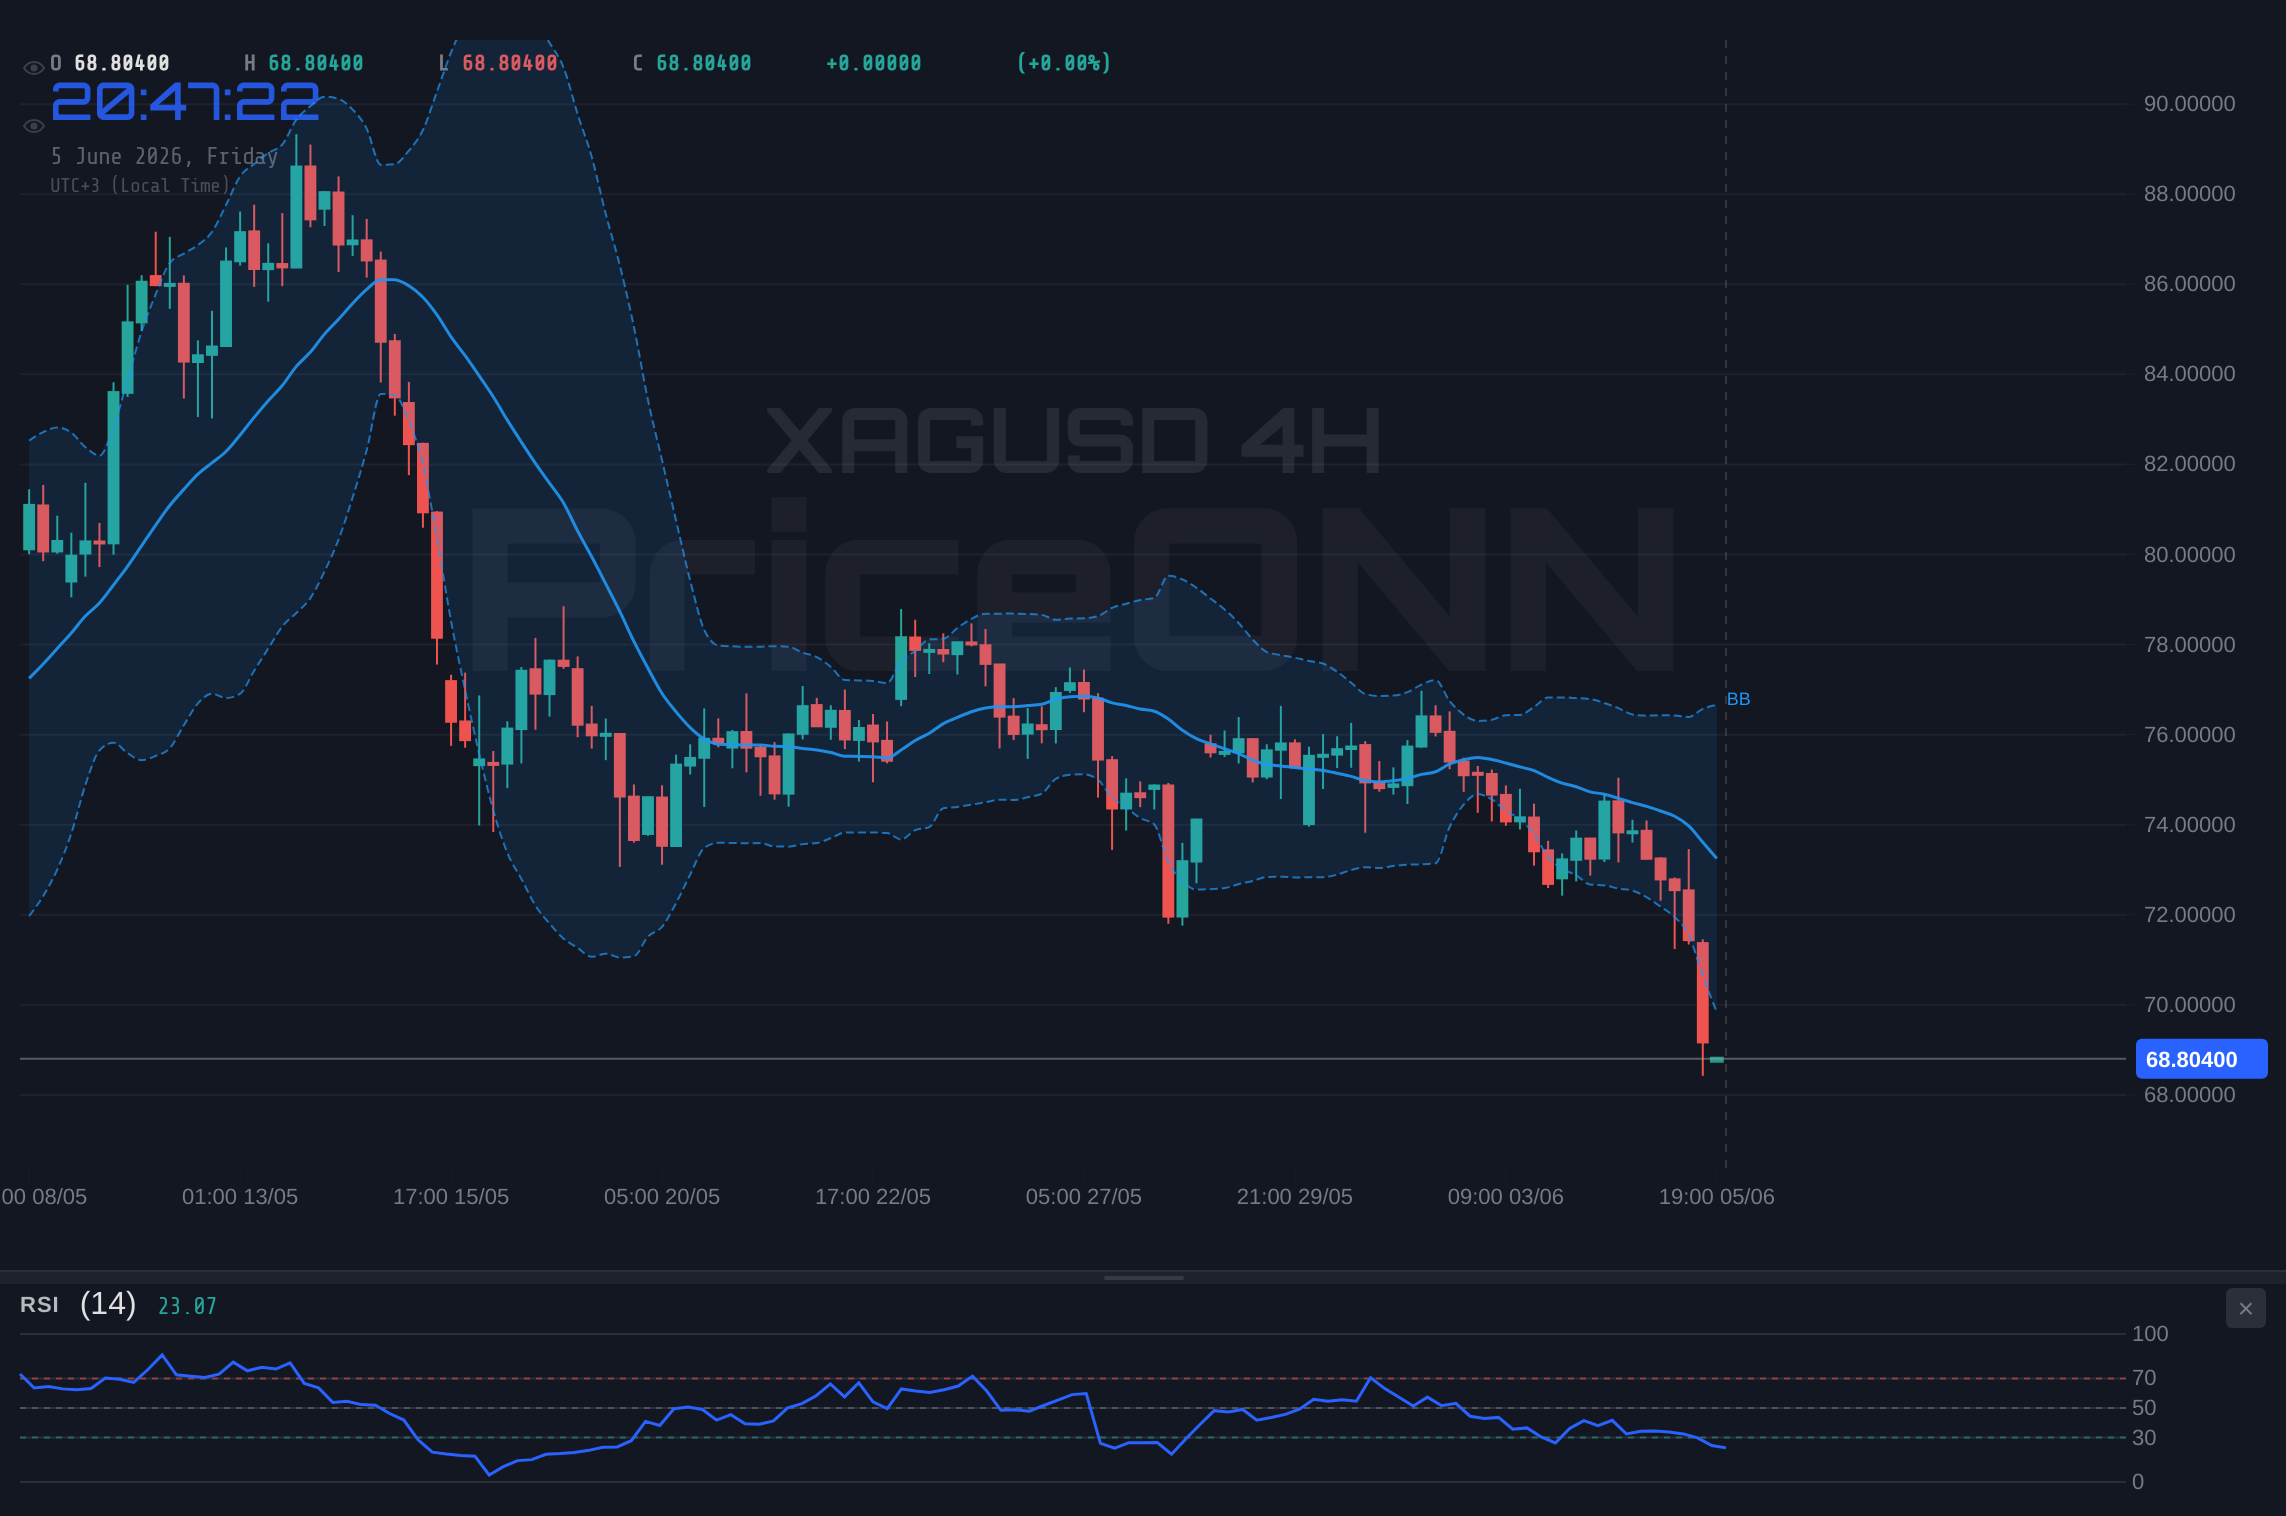
Every meaningful breakdown has a level that, once it cracks, changes the character of the chart. For silver, that level was $71.75, the first daily support pivot. Through the prior sessions, bulls leaned on it. Friday's selling steamrolled straight through. The daily candle's range tells the whole tale: a high of $75.04 collapsing to print at $69.02, a span of nearly six dollars in a single day for an instrument where a dollar move is already significant.
Losing $71.75 matters because it flips the entire daily structure. The daily pivot supports now read $71.75, $70.82, and $69.04, and price has effectively chewed through all three, with $69.04 sitting right at current levels acting as the last thin ledge before air. Above, the daily resistance band of $74.46, $76.24, and $77.18 now looms as overhead supply that bulls would need to fight back through to repair the damage. That is a long climb from $69.02. The break did not just dent the trend; it rebuilt the map with sellers holding the high ground.
Reading the Oversold Signal: Floor or Trapdoor?
Here is the question every trader is asking right now, and the honest answer requires holding two contradictory ideas at once. On the hourly chart, the RSI has plunged to 21.63, parked firmly in oversold territory. The 4H RSI at 23.67 echoes the same exhaustion, and even the daily RSI has cooled to 36.38. Classic textbook reading says oversold equals bounce. But look, this is exactly where you need to pay attention, because oversold in a violent downtrend is not a buy signal. It is a warning that momentum is overwhelming, and in strongly trending markets the RSI can stay pinned in oversold far longer than any counter-trend trader can stay solvent.
The ADX is the real story that resolves the tension. At 46.78 on the hourly, the ADX is not just elevated; it is screaming that this downtrend has genuine, committed force behind it. A reading north of 45 means the bears are not merely strong, they are openly aggressive, and the path of least resistance remains lower until that conviction fades. Compare that to the 4H ADX at 22.76, which reads as a more moderate trend, and the daily ADX at a limp 17.46, which technically signals a weak, almost rangebound posture on the higher timeframe. That divergence is the whole puzzle: the daily picture is neutral and undecided, while the intraday picture is a freight train heading downhill.
The Stochastic adds another layer of caution for would-be dip buyers. With the hourly %K at 10.12 sitting below %D at 35.87, the fast line is still pointing down and has not yet crossed back up to signal even a short-term momentum shift. The MACD across all three timeframes remains negative and below its signal line, and price is trading beneath the lower Bollinger Band on both the 1H and 4H. When price rides the underside of the lower band, it reflects a panic-driven extension, not a stable accumulation zone. The bears are clearly in control, and bulls have not yet shown a single shred of evidence they are ready to press back.
Oversold RSI plus a 100% strength 1H downtrend and ADX at 46.78 is a confluence that says "wait," not "buy." The high-probability play is patience: let the dust settle and demand confirmation before assuming $69.02 is a floor rather than a trapdoor.
What Would Actually Signal a Bottom for XAGUSD
Since the technical picture is mixed enough to justify caution, let's define what a valid setup would actually require rather than guessing at it. Right now silver scores low on any momentum-confluence checklist, which is why this is a watch-and-wait situation, not an entry. The setup is simply not there yet.
For the falling-knife thesis to invalidate, the first thing bulls need is a reclaim of the $69.28 hourly resistance on a clean close, followed by acceptance back above $69.86 and ideally $70.28. A daily close back above the $70.82 pivot would be the first genuinely constructive signal that the $71.75 breakdown was a stop-hunt liquidity grab rather than a true regime change. Until that happens, every bounce should be treated as a potential bull trap inside a strong downtrend. On the momentum side, watch for the hourly Stochastic %K to cross back above %D and for the RSI to climb out of the sub-25 zone with conviction. Those would be the early fingerprints of buyers stepping in, not just sellers pausing to breathe.
The cleaner tell, frankly, lives in the dollar. With the DXY's own hourly RSI stretched to a frothy 80.97 and its 4H RSI at 72.67, the greenback itself is extremely overbought. Dollar strength is the engine driving silver's pain, so the moment DXY runs out of steam and starts to mean-revert from 99.81, silver gets its first real chance to breathe. Watching the dollar's exhaustion is arguably a higher-quality signal for timing a silver turn than staring at silver's own oscillators in isolation. This is multi-timeframe analysis and cross-asset confluence working together: silver will not sustainably bottom while the dollar is still ripping.
Three Scenarios for XAGUSD's Next Move
Let's lay out the probability-weighted roadmap. Given the 100% strength hourly downtrend, the ADX at 46.78, and a dollar that is still climbing, the bearish case carries the most weight, but the higher-timeframe neutrality keeps the door open for a snapback.
Continuation: Bears Press the Advantage
60% ProbabilityConsolidation: Oversold Stalemate
25% ProbabilityReversal: Dollar Exhaustion Snapback
15% ProbabilityThe Macro Calendar Is the Real Wildcard
The technical map is only half the equation; the next dollar catalyst will likely decide which scenario wins. The week ahead is a Fed countdown, with markets bracing for key US inflation data that could reshape rate expectations. Fed Chair Warsh's first meeting is approaching, and as one market summary put it, geopolitical risks and elevated oil prices remain part of the backdrop even after Friday's energy slump. The high-impact US calendar carries upcoming consumer confidence readings forecast near 110 versus a prior 109, and sentiment surveys clustered around the 50-53 zone. Any inflation surprise that hardens the Fed-patience narrative would pour more fuel on the dollar and, by extension, keep the pressure on silver.
The flip side is just as important for risk management. If upcoming data comes in soft enough to revive rate-cut hopes, the overbought dollar could unwind quickly from 99.81, and that is precisely the kind of catalyst that turns an oversold silver chart into a violent short-covering rally. Having watched these dynamics through prior rate cycles, the pattern is consistent: silver's sharpest rallies tend to ignite from exactly these deeply oversold, dollar-exhausted moments. That does not mean the bottom is in. It means the asymmetry is worth respecting, and that chasing shorts down here into a 21 RSI carries its own risk.
XAGUSD Technical Outlook Summary
| Indicator | Value | Signal |
|---|---|---|
| RSI (14) 1H | 21.63 | Oversold / downtrend |
| RSI (14) 4H | 23.67 | Oversold |
| MACD (all TFs) | Negative | Below signal line |
| Stochastic 1H | K 10.12 / D 35.87 | %K below %D |
| ADX 1H | 46.78 | Strong downtrend |
| ADX Daily | 17.46 | Weak / rangebound |
| Bollinger 1H | Below lower band | Extended sell-off |
How Different Traders Should Play XAGUSD Now
Your timeframe changes everything here. For the scalper, the hourly downtrend with 100% strength and ADX at 46.78 favors selling rallies into resistance rather than buying the dip, but the deep oversold reading means stops must be tight and profit targets quick, because a snapback from $69.02 could be sharp and unforgiving. For the swing trader, this is firmly a watch zone: the daily ADX at 17.46 says the larger trend has not committed, so the disciplined move is to wait for either a reclaim of $70.82 or a fresh breakdown below $68.28 before acting. For the long-term accumulator, silver near $69.02 with the gold-silver ratio around 62.9 may eventually present value, but trying to time the exact bottom against this much downside momentum is a low-probability game. Layered, patient accumulation beats a single hero entry.
The thread connecting all three is the same: respect the strength of this trend while acknowledging the daily picture is undecided. The market is handing out a clear message right now, and it is not "buy aggressively." It is "prove it first."
Frequently Asked Questions: XAGUSD Analysis
What happens if XAGUSD breaks below $68.28 support?
A confirmed hourly close below $68.28 would open the path toward the next supports at $67.86 and the deeper $67.28 level. With the 1H ADX at 46.78 confirming a strong downtrend and price already beneath the lower Bollinger Band, continuation is the highest-probability scenario at roughly 60% unless the dollar reverses.
Is RSI at 21.63 a buy signal for XAGUSD right now?
Not on its own. An RSI of 21.63 on the 1H is deeply oversold, but in a downtrend with 100% strength the RSI can stay pinned for a long time. A valid long setup would need price to first reclaim $69.28 resistance and the Stochastic %K to cross back above %D, which has not happened yet.
Why did silver fall harder than gold this session?
Silver dropped 5.05% to $69.02 while gold fell only 2.05% to $4,343.35, widening the gold-silver ratio to about 62.9. Silver's roughly 50% industrial demand makes it doubly sensitive: it got hit by both the DXY surge to 99.81 and the growth-fear selloff that also crushed oil and the Nasdaq.
How will the upcoming US inflation data affect XAGUSD this week?
With the Fed countdown underway, a hot inflation print would reinforce Fed patience, likely pushing the already-overbought DXY higher from 99.81 and pressuring silver toward $67.86. A soft print could trigger dollar mean-reversion and spark a short-covering bounce in oversold silver back toward $70.28.
The dust from this 5% flush has not settled, but volatility creates opportunity for those who stay disciplined. Silver at $69.02 is a market that has shown its hand on the downside while leaving the daily timeframe undecided, and that combination rewards patience over heroics. Watch the dollar for exhaustion, watch $69.28 for a reclaim, and let the market prove the bottom rather than guessing at it. The setup will come to those who wait for it.
Track markets in real-time
AI-powered analysis, technical indicators and real-time price data.
Join Our Telegram Channel
Breaking market news, AI analysis and trading signals instantly.
Join Channel