Strip the geopolitics out of crude for one session, and you see what oil is really worth right now. That is exactly what happened today.
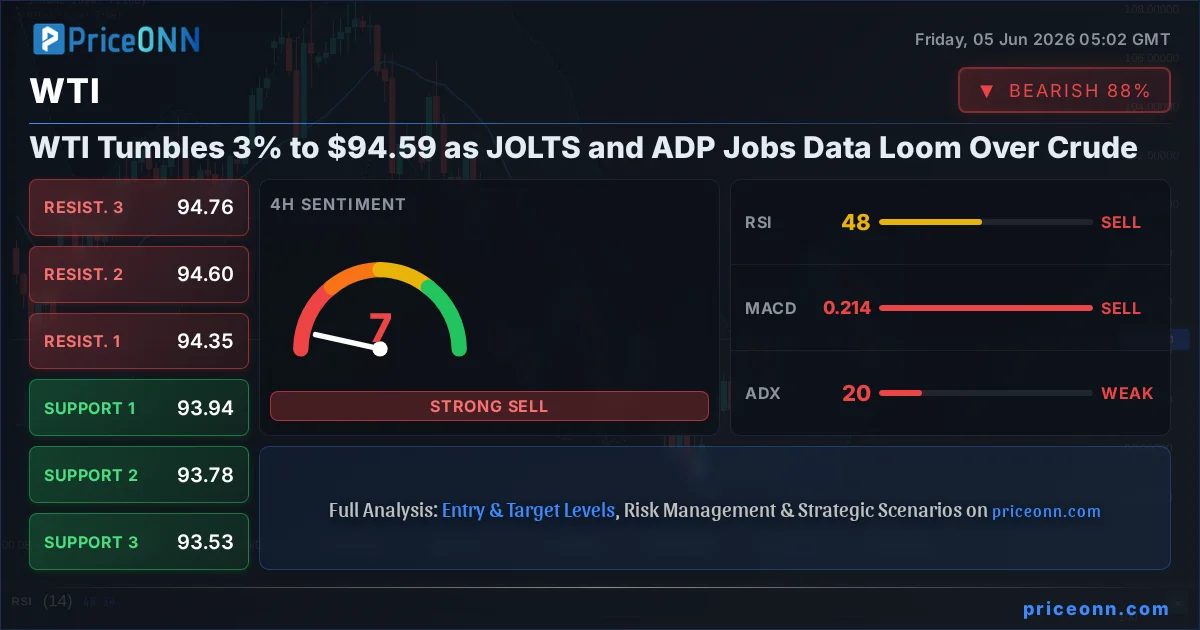
WTI today analysis shows the contract down a sharp 3.31% at $94.59, a $3.24 drop that drained most of the fear premium traders had been paying for barrels. The selloff pulled price from a daily high of $97.46 all the way to $93.48 before a modest bounce settled it near $94.59. This was not a slow bleed. It was a repricing, and the catalyst sat squarely on the fundamental side of the ledger.
Time Horizon: This analysis covers the intraday-to-swing window, roughly the next one to five trading sessions around the JOLTS and ADP releases.
- WTI fell 3.31% to $94.59, sliding from a daily high of $97.46 as the geopolitical risk premium drained out of crude.
- The 1H ADX at 25.61 confirms a committed intraday downtrend, while the daily ADX at just 12.66 shows the broader structure is still range-bound.
- First intraday support sits at $94.33 and $93.61; reclaiming $95.11 is the bulls' first real task to stop the bleeding.
- JOLTS job openings and the ADP employment report are the next demand-side catalysts that will decide crude's direction.
What Drained the Risk Premium Out of WTI Today
The honest read on this drop is that it was geopolitics unwinding, not demand collapsing. Earlier in the week, optimism around a reopening of the Strait of Hormuz had given crude a bid. That optimism faded fast. As the Weekly Focus note from the forex desk put it, last week's enthusiasm over the Strait reopening cooled as both US and Iranian officials toned down their rhetoric. When the threat of a supply disruption softens, the barrels that traders were hoarding against that risk suddenly look overpriced. The premium leaks out, and you get a session like this one.
There is a structural footnote worth adding here, and it came from the Federal Reserve itself. A Fed study released this week found that the United States still feels oil shocks, but it does not feel them the way it did decades ago. Shale production, a more diversified energy mix, and a less oil-intensive economy have all blunted the transmission. For traders, the takeaway is subtle but important: a crude spike no longer guarantees the same inflationary jolt or the same equity reaction it once did. That partly explains why today's 3% crude drop coexisted with a Dow Jones up 1.64% and the S&P 500 up 0.74%. Oil and risk assets are not moving in lockstep the way the old playbook would predict.
Brent confirmed the move, sliding 2.72% to $98.18. When both benchmarks fall together by similar magnitudes, you know the driver is a broad shift in the supply-risk narrative rather than a single regional dislocation. The whole curve repriced lower in tandem.
Why WTI Trend Analysis Hinges on the ADX Split
Here is where it gets interesting. The single most revealing number in the WTI technical picture today is not RSI or MACD. It is the ADX, and specifically how differently it reads across timeframes. On the 1-hour chart, ADX sits at 25.61, a strong-trend reading that confirms this intraday slide has real conviction behind it. Sellers were not nibbling. They were pressing.
Drop to the daily chart, though, and ADX collapses to 12.66. That is a weak, trendless reading. The plain interpretation: today's aggressive flush is happening inside a market that, on the bigger picture, is still range-bound and undecided. The daily trend strength reads bearish at 81% in the data, but the trend-strength gauge itself is feeble. So this is a sharp move within a larger consolidation, not the confirmed launch of a sustained downtrend. That distinction matters enormously for how you size and time anything here.
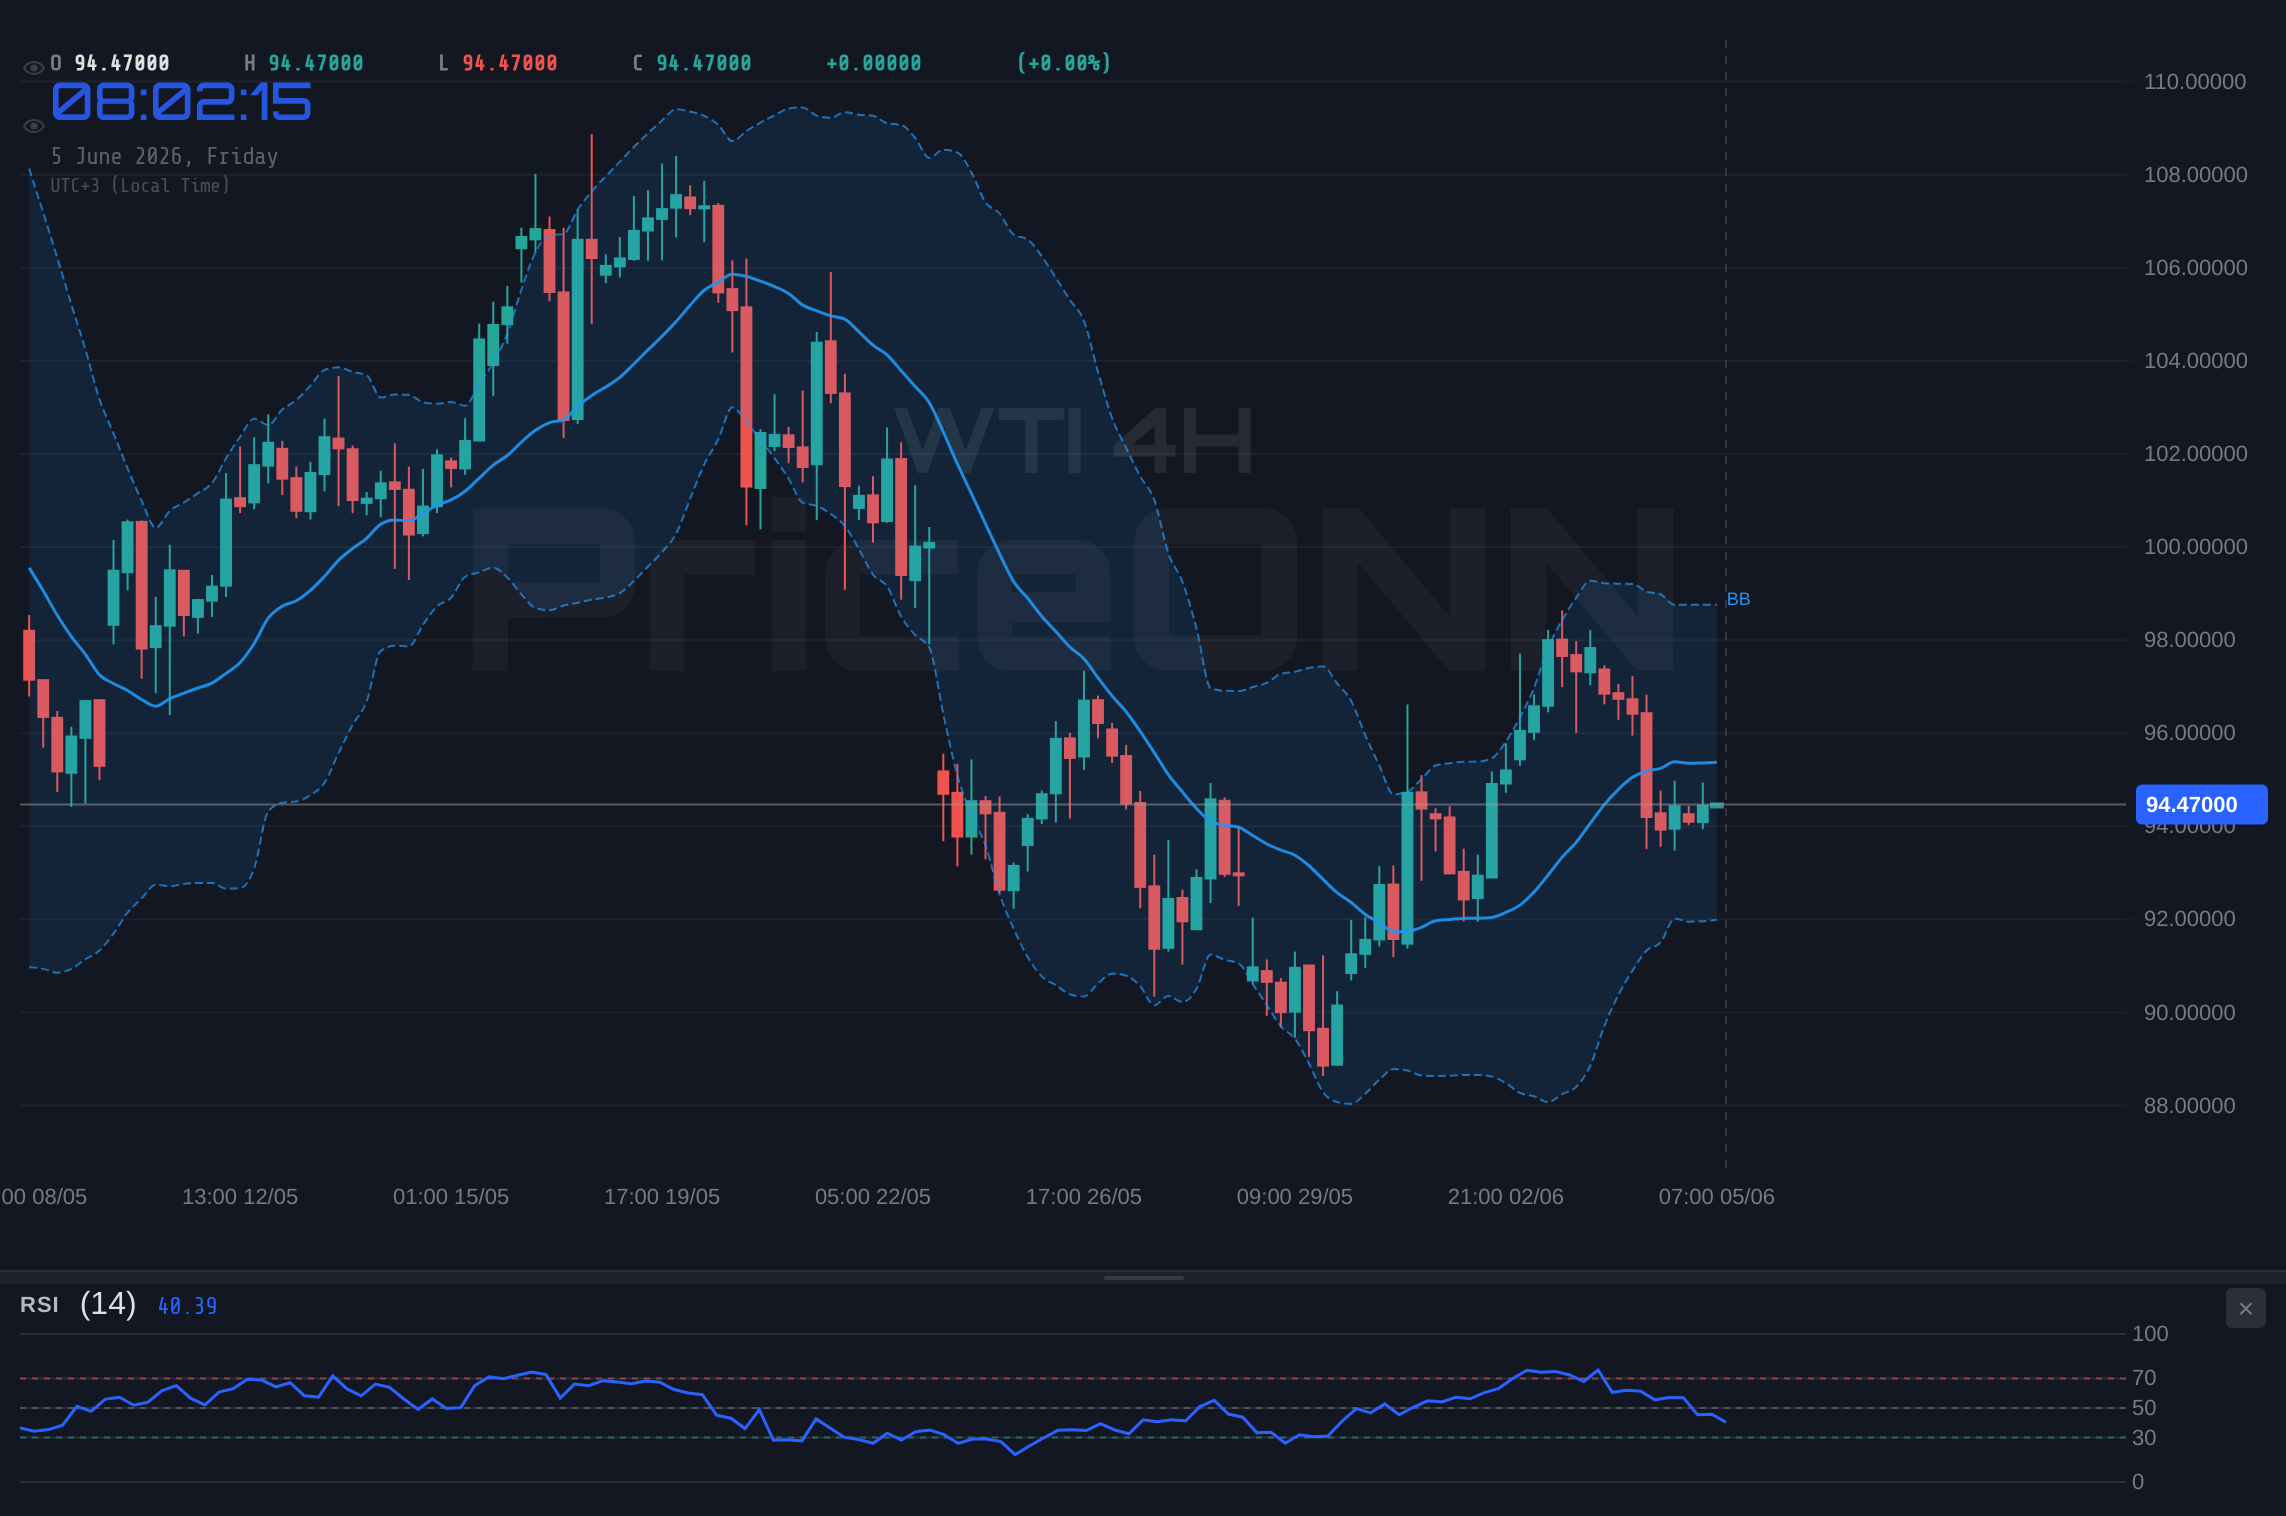
Momentum backs up the caution. The 1H RSI at 44.68 carries a downward tilt but sits comfortably in neutral territory, nowhere near the oversold capitulation that often marks a tradable bottom. The 4H RSI at 48.22 and the daily RSI at 46.34 tell the same balanced story: bearish lean, no exhaustion yet. MACD is negative and below its signal line on the 4H and daily, confirming the downside momentum, though on the 1H the MACD is actually holding positive above its signal line. That is a small but real divergence, a hint that the very-short-term selling pressure may be losing a little steam even as the broader momentum stays heavy.
The Stochastic readings add another wrinkle. On the 1H, the Stochastic is elevated at K=78.11 over D=61.32, which is closer to overbought than oversold despite the price drop, a classic sign that the intraday bounce off $93.48 lifted the oscillator quickly. But on the 4H, Stochastic has rolled over to K=16.67 below D=33.66, sitting near oversold with a bearish cross. Conflicting signals across timeframes are the rule today, not the exception, and that is precisely why confirmation matters more than any single indicator print.
The 1H Stochastic is near overbought while the 4H is near oversold, and 1H MACD is positive while 4H and daily MACD are negative. When timeframes disagree like this, a single oscillator reading is not a trade. Wait for price to confirm by breaking a level, not for an indicator to flash.
WTI Support and Resistance: The Levels That Matter Now
Let us map the battlefield with the exact levels from the data. On the intraday frame, the first line of defense sits right under price at $94.33, followed by $94.14. These are the 1H supports, and they are thin. A clean hourly close below $94.14 would hand control to the 4H support shelf, where the more meaningful floors live: $93.61, then $92.80, then $92.11. That $92.53 area also shows up as a daily support, so the $92 to $93.61 band is the real demand zone where dip-buyers are most likely to defend.
To the upside, the bulls' first task is reclaiming $95.00 and then $95.11. That $95.11 level is the pivotal one, because it is both the 1H resistance extension and the first 4H resistance. Clear it convincingly and the path opens toward $95.80 and $96.61. Above that, the daily resistance does not appear until $99.21, which tells you just how much room crude gave back today and how far the recovery would need to travel to repair the daily damage.
Look, this $95.11 level is absolutely critical. As long as crude trades below it, every rally is a candidate for being faded by sellers who are still in control of the intraday structure. Flip above it on volume and the bearish thesis loses its footing fast.
The Dollar Backdrop and Why JOLTS and ADP Are the Real Catalysts
Crude does not trade in a vacuum, and the dollar context is supportive of oil rather than hostile right now. The Dollar Index is at 99.16, down 0.08% on the day, with price sitting near a daily pivot. A softer dollar normally cushions commodities priced in greenbacks, which means today's WTI drop happened despite a mild dollar tailwind, not because of dollar strength. That reinforces the read that this was supply-premium unwinding, pure and simple. Reuters-style flow this week framed it as the dollar slipping as peace hopes returned, even while officials cautioned that the underlying risks had not vanished.
Now the focus pivots hard to the demand side, and that is where the economic calendar takes over. The market is bracing for JOLTS job openings and the ADP employment report, both of which speak directly to the health of the US labor market and, by extension, the growth trajectory that ultimately drives oil demand. The calendar shows high-impact US data clustered ahead, including an ADP-style private payrolls figure with a forecast around 211K against a prior 215K, and labor-market gauges that traders will parse line by line.
The logic is straightforward. A soft JOLTS print and a weak ADP number would feed the slowdown narrative, suggesting cooling hiring and softer future fuel demand, which would keep the pressure on crude and likely send it probing that $93.61 to $92.80 support band. A strong labor read flips the script: it revives risk appetite, supports the growth-demand story, and gives WTI the fuel to reclaim $95.11 and stabilize. Until that data resolves the tension, the $94 handle is best treated as a decision zone, not a trend.
Historically, when crude sells off on a fading geopolitical premium rather than a demand shock, the move tends to stall once the premium is fully priced out, then chops sideways until the next macro catalyst. With ADX trending intraday but flat on the daily, this looks like that kind of premium-unwind. The labor data is the catalyst that breaks the chop.
WTI Scenarios Into the Data
With the levels and catalysts framed, here is how the next sessions could realistically unfold. These are analytical roadmaps, not trade instructions, and each carries a clear invalidation so you know when the idea is wrong.
Continuation: Premium Keeps Bleeding
55% ProbabilityChop: The Range Reasserts
30% ProbabilityRecovery: Strong Jobs Revive Demand
15% Probability| Indicator | Value | Signal | Interpretation |
|---|---|---|---|
| RSI (14, 1H) | 44.68 | Neutral | Bearish tilt, no oversold yet |
| MACD (4H) | Negative | Bearish | Below signal, downside momentum |
| Stochastic (4H) | K 16.67 / D 33.66 | Bearish | Near oversold, K below D |
| ADX (1H) | 25.61 | Strong trend | Committed intraday downtrend |
| ADX (1D) | 12.66 | Weak trend | Bigger picture still range-bound |
Frequently Asked Questions: WTI Analysis
What happens if WTI breaks below $93.61 support?
A clean 4-hour close under $93.61 would expose the next shelf at $92.80 and then $92.11, the deeper 4H supports. That zone also lines up near the daily support cluster around $92.53, so it is where dip-buyers are most likely to step in if the selloff extends.
Is WTI a sell at $94.59 with RSI at 44.68 on the 1-hour chart?
Not outright. The 1H RSI at 44.68 sits in neutral territory with a downward tilt, not in oversold capitulation, and the 1H signal score reads 5 sells to 3 buys. Momentum favors sellers short term, but you want a break below $94.14 to confirm before assuming the move continues rather than mean-reverts.
Why is the WTI ADX so different across timeframes right now?
The 1H ADX at 25.61 marks a strong, committed intraday downtrend, while the daily ADX at just 12.66 signals a weak, range-bound bigger picture. That split means today's 3% drop is an aggressive intraday flush inside a market that is still broadly directionless on the higher timeframe.
How will JOLTS and ADP data affect WTI this week?
Both are demand-side catalysts. Softer JOLTS openings and a weak ADP print would feed growth-slowdown fears and pressure crude toward $93.61, while strong numbers could revive risk appetite and help WTI reclaim $95.11. Until that data lands, the $94 area is best treated as a decision zone rather than a trend.
The setup into the back half of the week is unusually clean for crude. The geopolitical premium has largely been priced out, the dollar is soft, and the technical structure has narrowed the question to a single band between $93.61 and $95.11. Now the labor data gets to answer it. Patience looks like it will be rewarded here: let JOLTS and ADP resolve the demand question, respect the $93.61 floor, and watch $95.11 as the line that flips the intraday tone. Crude has handed traders a sharper map than it has in weeks, and the market always gives a second chance to those who wait for confirmation.
Track markets in real-time
AI-powered analysis, technical indicators and real-time price data.
Join Our Telegram Channel
Breaking market news, AI analysis and trading signals instantly.
Join Channel