Five percent. That is how much Brent crude shed in a single session, and the chart did not stutter on the way down. BRENT today analysis opens with a market that has dropped from a daily high of $100.34 straight into the $95.73 handle, and the question every energy desk is asking is simple: was this a one-off liquidation, or the start of something deeper? Crude rarely moves this hard without a reason, and on this session there were several stacked on top of each other.
Time Horizon: This analysis covers the intraday-to-swing window, blending the 1-hour, 4-hour and daily charts for traders watching BRENT support and resistance over the coming sessions.
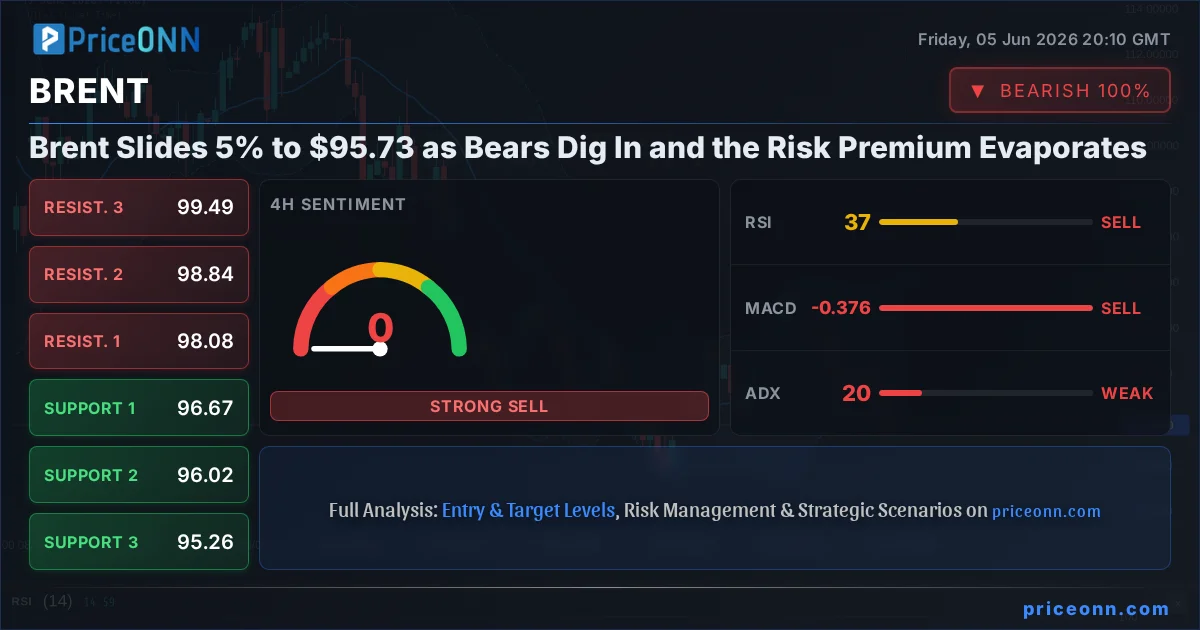
- Brent collapsed 5.16% (-$5.21) to $95.73, slicing below the $96 round number and the daily low of $96.78 in the process.
- On the 1-hour chart RSI sits at 24.76, deep in oversold territory, while ADX at 38.56 confirms a strong, committed downtrend rather than random noise.
- First support sits at $95.39, with the line in the sand at $94.86; reclaiming $96.45 is what bulls need to neutralize the damage.
- A 0.57% jump in the Dollar Index to 99.80 plus fading Strait of Hormuz risk stripped the geopolitical premium out of crude in hours.
Why BRENT's 5% Crash to $95.73 Is About More Than Oil
Here is the part most headlines miss. Brent did not fall in isolation. Look across the board on this session and you see a textbook risk-off purge: Ethereum down 11.55%, Bitcoin off 7.15%, the Nasdaq 100 bleeding 4.77%, even gold giving back 2.66%. When everything sells at once, that is not a story about oil fundamentals; that is a story about liquidity leaving the building. WTI fell even harder than Brent, down 6.21% to $91.75, which tells you the selling was concentrated in energy as a risk asset, not just a commodity.
From a field perspective, this is where the infrastructure-first lens matters. Physical crude balances do not shift 5% in a day. Refinery runs, tanker schedules and production quotas move on a timescale of weeks, not hours. So when price gaps lower this aggressively, the move is being driven by the paper market: futures positioning, margin calls and the unwinding of a risk premium that had been priced in on geopolitical fear. The barrels in the ground did not change. The narrative around them did.
The catalyst stack is worth unpacking. Reuters-tracked desk commentary this week noted that last week's optimism around a reopening of the Strait of Hormuz had faded, with both US and Iranian officials toning down the rhetoric. That de-escalation cuts both ways: less supply-disruption fear means less reason to hold a premium in crude. Strip out the war premium and price reverts toward the supply-demand baseline, which on a strong-dollar day is meaningfully lower.
What BRENT RSI and MACD Signals Reveal Across Timeframes
Now this is where the multi-timeframe analysis earns its keep, because the three charts are not telling the same story, and that disagreement is the whole game right now.
On the 1-hour, the picture is one of capitulation. RSI has crashed to 24.76, well inside the oversold zone, and the Stochastic is practically scraping the floor with %K at 10.70 and %D at 17.54. Normally a reading that washed out screams bounce. But here is the catch that separates a disciplined read from a naive one: the 1-hour ADX is sitting at 38.56, which is a strong-trend reading. When ADX is that elevated and pointing down, oversold does not mean reversal; it means the trend is powerful enough to stay oversold longer than a counter-trend buyer can stay solvent. MACD remains negative and pinned below its signal line. The sellers are not just present, they are in firm control.
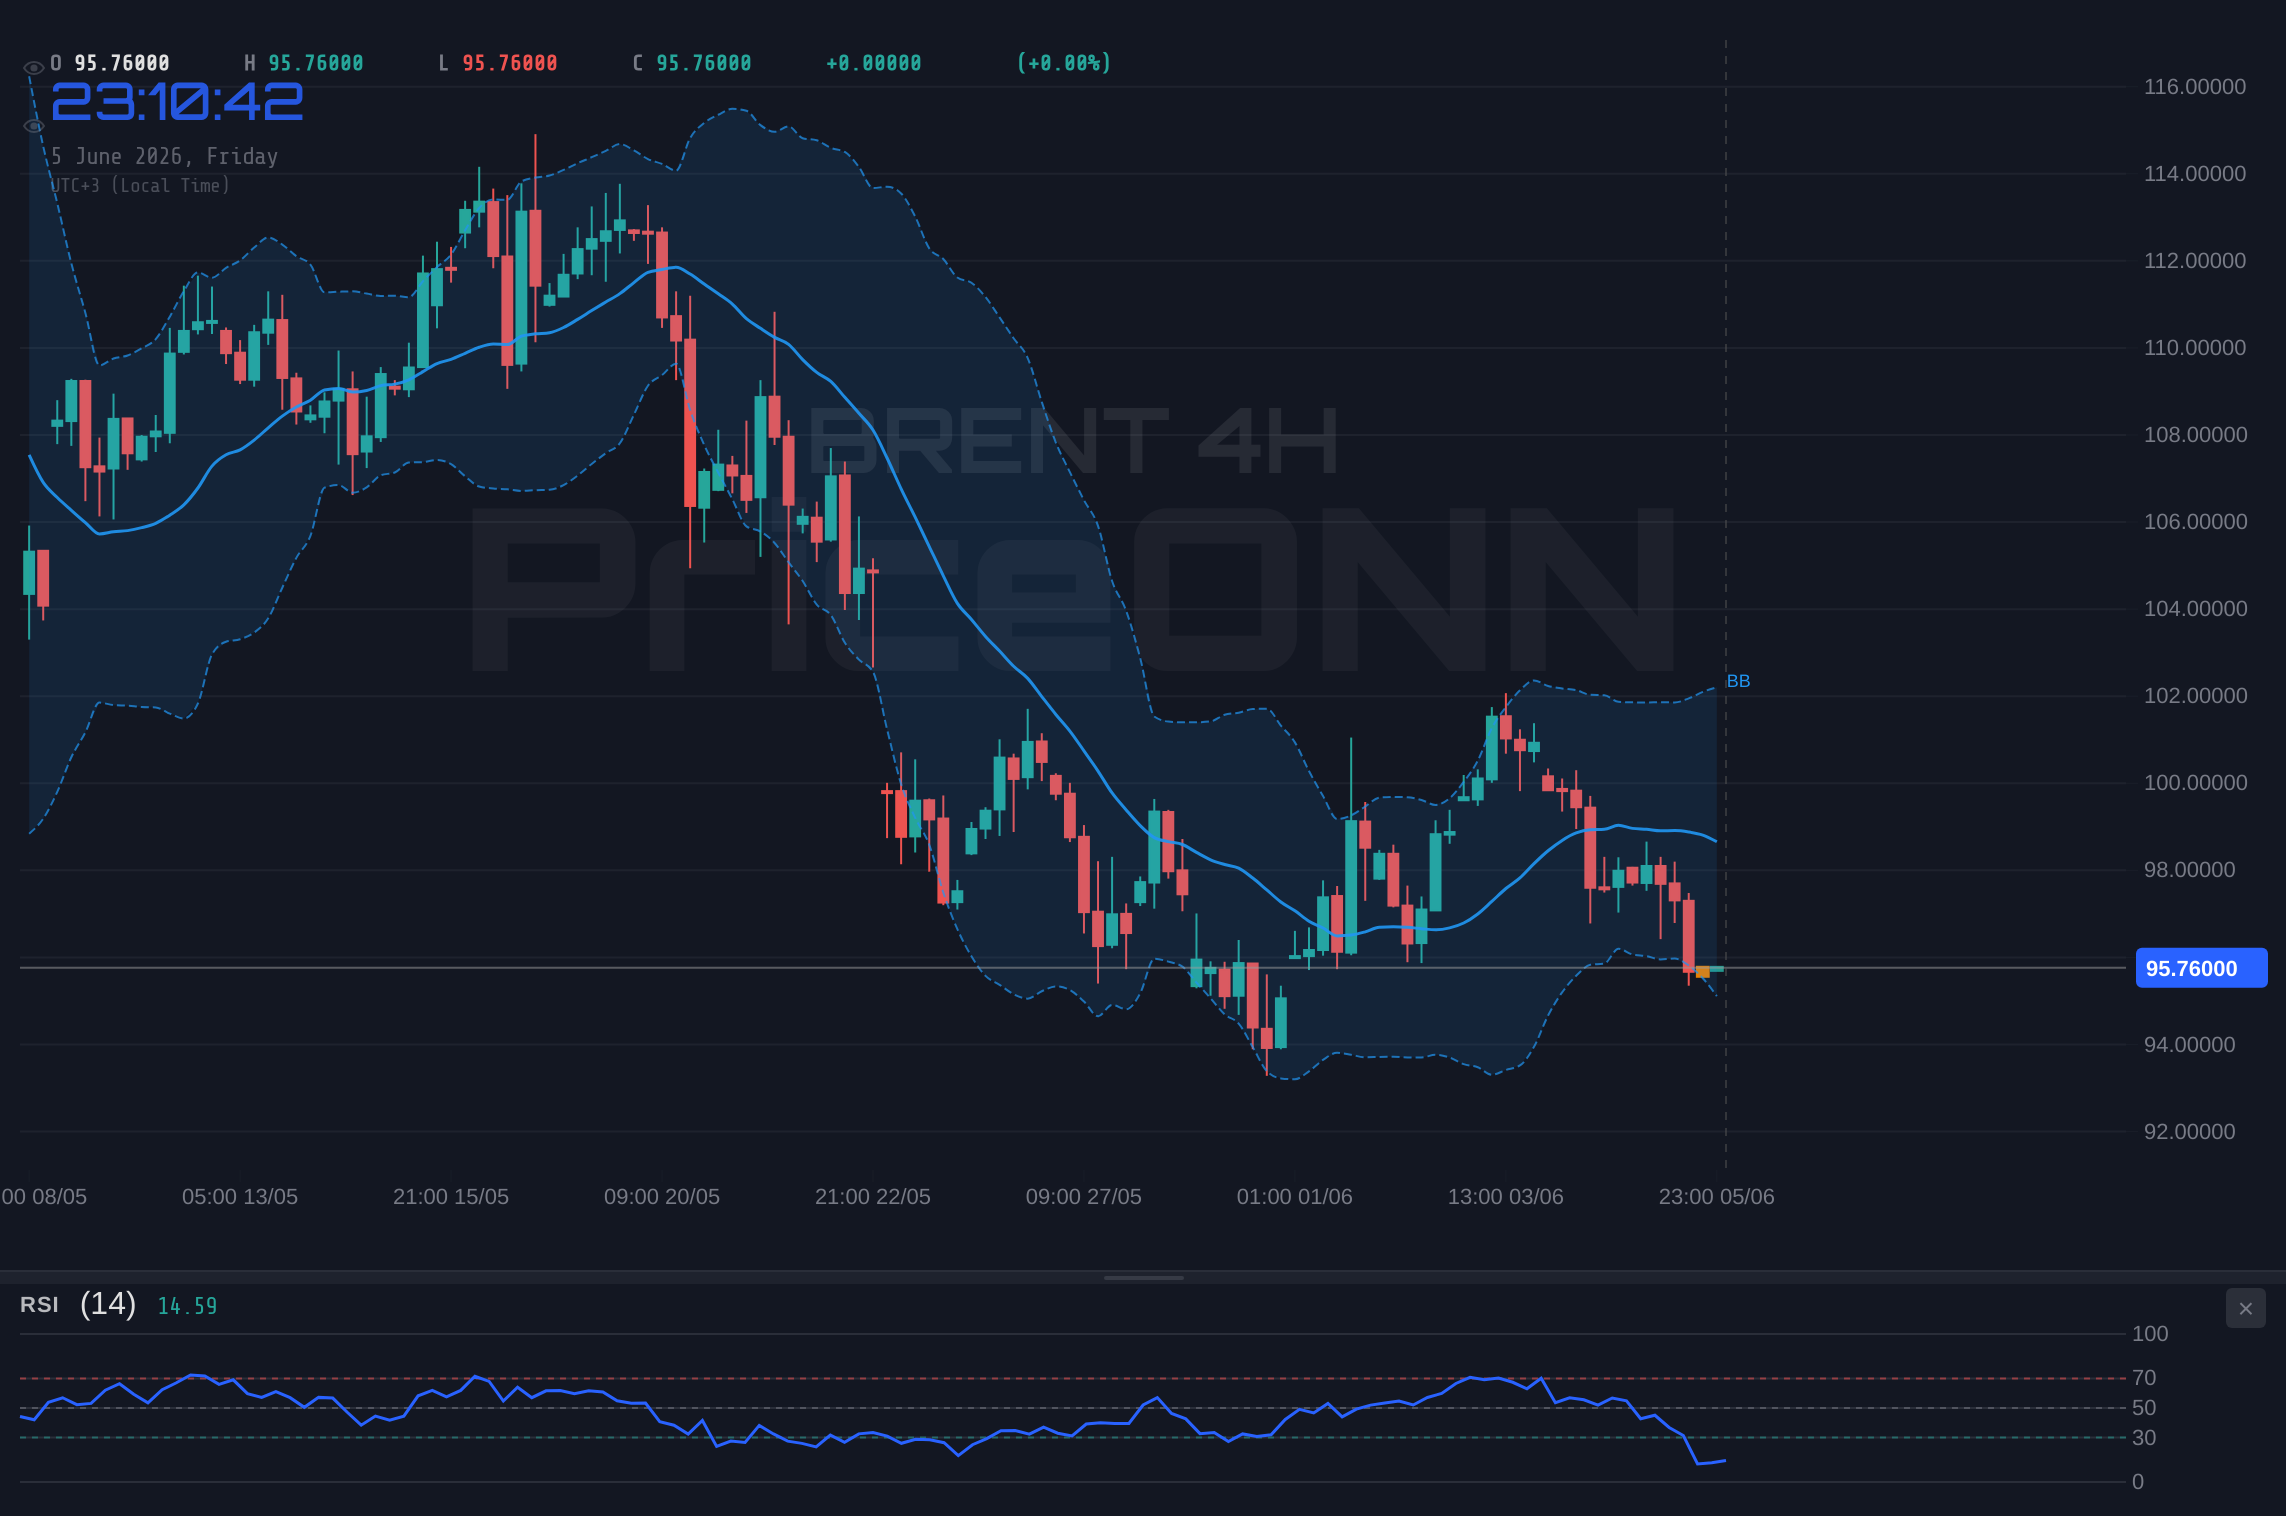
Step out to the 4-hour and the conviction softens. RSI recovers to 36.12, off the extremes, and ADX drops to a limp 19.94. That sub-20 print is the real story on this timeframe: it says the broader trend has not yet committed. The 4-hour Stochastic at K=20.97, D=22.95 is low but not screaming, and price has pierced below the lower Bollinger band, which often marks an exhaustion zone where the first relief rally hides. The contradiction is deliberate to note: the 1-hour says strong downtrend, the 4-hour says choppy and undecided. That is precisely the kind of conflict that keeps NO_TRADE on the table for cautious operators until one side resolves.
The daily chart adds the longer arc. RSI at 40.62 is neutral-to-soft, MACD is negative, and ADX at 15.89 confirms that on the bigger picture, Brent has been ranging rather than trending hard. The daily Stochastic actually shows a faint bullish cross with K=37.59 above D=21.63, a small flicker that the daily structure is not yet broken. So the read is layered: a violent intraday flush inside a daily range that is wobbling but not yet collapsed.
Do not treat the 1-hour RSI at 24.76 as a simple buy signal. With ADX at 38.56 driving the short-term trend and the 4-hour ADX at just 19.94, the indicators are openly contradicting each other. Oversold in a strong downtrend is a warning, not an invitation. Confirmation, not anticipation, is what this tape demands.
BRENT Support and Resistance: The Levels That Matter Now
Let us get concrete on the BRENT key levels, because at $95.73 the price action is balanced on a knife edge between intraday supports.
The immediate floor is $95.39. That is the first line that has to hold for any stabilization, and a clean break below it opens the door to $95.15 and then the deeper $94.86. Lose $94.86 with conviction and there is little structural support visible on the short-term chart until the move finds fresh demand lower down. On the upside, the first hurdle is $95.92, barely above spot, followed by $96.21 and the more meaningful $96.45. That $96.45 zone is the one to circle: reclaiming it would neutralize much of the intraday bearish damage and force the short-term sellers to rethink.
Zoom out and the resistance gets heavier. The 4-hour chart places real supply at $98.08, then $98.84 and $99.49, which also lines up with the psychological $100 level and the session high near $100.34. That is a wall of confluence. For BRENT trend analysis purposes, the bulls have a long climb back: even a strong bounce runs into stacked resistance well before it recovers the day's losses.
The Dollar, Demand and the Disappearing Risk Premium
No commodity trades in a vacuum, and on this session the Dollar Index was the gravitational force. DXY climbed 0.57% to 99.80, and on the 1-hour chart it is running hot with RSI at 80.95, deep into overbought, and ADX at 35.49 confirming a strong dollar uptrend. A stronger greenback makes dollar-denominated crude more expensive for the rest of the world, and the inverse relationship did exactly what the textbook predicts: dollar up, oil down. With DXY at 99.80 and pressing higher, Brent was swimming against a powerful current.
The macro engine behind the dollar is the US labor market. Breaking commentary this session flagged a much stronger-than-expected US employment report, which reinforced the case for Fed patience and sent USD/JPY clearing the 160 level for the first time in this cycle. A patient Fed means a firmer dollar for longer, and a firmer dollar is a persistent headwind for crude. The economic calendar reinforces the theme: with US consumer confidence forecast at 110 versus a prior 109 and ISM-style readings holding around 50.9, the data is not weak enough to force rate cuts, which keeps real yields and the dollar supported.
On the demand side, structural signals are quietly turning. Reports this session noted that India launched a new fuel blend with an 85% ethanol component as part of its flex-fuel mobility program, an explicit policy move to cut oil import dependence. One headline does not move the barrel, but it fits a pattern: the world's fastest-growing major crude importer is actively engineering demand destruction at the margin. For an energy market already nervous about the pace of the transition, that is another reason to fade rallies rather than chase them.
There is also a sober reminder from the policy side. A Federal Reserve study released this session found that the US still feels oil shocks, but no longer the way it did in the disco era, as domestic shale production has reshaped the economy's sensitivity to crude swings. Translated into market terms: the feedback loop that once turned every oil spike into an inflation panic is weaker now, which removes one more pillar of structural support under prices.
On paper, capacity and balances look stable. In practice, price is being set by positioning and the dollar, not by barrels. When the geopolitical premium deflates and the greenback strengthens in the same window, crude has nowhere to hide. The infrastructure has not changed; the money flow has.
BRENT Trade Scenarios: Mapping the Next Move
Given the conflicting signals, the smart posture here is to map scenarios rather than force a position. The 1-hour downtrend is dominant, but the oversold readings and the soft 4-hour ADX mean a violent snap-back is always a risk in a market this stretched. Here is how the probabilities stack up.
Continuation Lower: Bears Press the Advantage
60% ProbabilityOversold Stabilization: The Range Holds
30% ProbabilityOversold Reversal: Bulls Claw Back
10% ProbabilityWhat Different Traders Should Watch
The right read of this tape depends entirely on your timeframe. For the scalper, the 1-hour ADX at 38.56 is a green light to trade with the trend, but the deeply oversold Stochastic means chasing shorts into $94.86 is asking for a stop hunt. Better to wait for a failed retest of $95.92 or $96.21 than to sell the hole. For the swing trader, the 4-hour ADX at 19.94 is the cautionary flag: a sub-20 reading says the bigger trend is unresolved, so patience until price either breaks $94.86 or reclaims $98.08 is the disciplined path. For the longer-term participant, the daily range remains intact above its supports, and the faint daily Stochastic cross hints that this flush may yet prove to be noise within a larger consolidation.
The honest assessment is that this is a NO_TRADE environment for anyone who needs clean confirmation. The directional signals on the 1-hour and the trend-strength signals on the 4-hour are openly at war, and the Stochastic is pinned in an extreme zone where entry timing is treacherous. When the indicators contradict each other this sharply, the highest-probability move is often to step aside and let the market show its hand.
Frequently Asked Questions: BRENT Analysis
What happens if BRENT breaks below $95.39 support?
A confirmed hourly close below $95.39 opens the path to $95.15 and then the key floor at $94.86. With 1-hour ADX at 38.56 confirming a strong downtrend, momentum favors continuation, so losing $94.86 would remove the last visible short-term support and risk an extension lower.
Is BRENT RSI at 24.76 a buy signal right now?
Not on its own. While 24.76 is deeply oversold, the 1-hour ADX at 38.56 signals a powerful downtrend, and oversold readings can persist for a long time in a strong trend. A safer confirmation is a reclaim of $96.45 paired with a Stochastic cross up from its current K=10.70 reading.
Why did Brent crude fall 5% to $95.73 in one session?
Three forces aligned: the Dollar Index jumped 0.57% to 99.80 on a strong US jobs report, fading Strait of Hormuz tensions stripped out the geopolitical risk premium, and a broad risk-off purge hit everything from the Nasdaq to crypto. The selloff was driven by positioning and the dollar, not by a change in physical supply.
How will a stronger dollar and Fed patience affect BRENT this week?
With DXY at 99.80 and overbought at an RSI of 80.95, continued dollar strength keeps pressure on dollar-priced crude. A patient Fed, reinforced by the strong payrolls print, supports the dollar for longer, which acts as a persistent headwind unless Brent can reclaim the $98.08 resistance zone.
Volatility like this is not a threat to the prepared, it is an opportunity in waiting. The barrels have not vanished, the demand has not collapsed, and a market that falls 5% in a session is a market handing out clearer levels than it did yesterday. Watch $95.39 on the downside and $96.45 on the upside; let one of them break with conviction, and the next move will announce itself. Patient operators who respect the contradiction in these signals and wait for confirmation will find the second chance the market almost always provides.
| Indicator | Value | Signal | Interpretation |
|---|---|---|---|
| RSI (14) | 24.76 | Oversold | Stretched, but trend-strong |
| MACD | Negative | Bearish | Below signal line |
| Stochastic | K 10.70 / D 17.54 | Oversold | Floor-scraping, bounce risk |
| ADX | 38.56 | Strong Trend | Downtrend committed |
| Bollinger | Below Mid | Watch | Downside bias intact |
Track markets in real-time
AI-powered analysis, technical indicators and real-time price data.
Join Our Telegram Channel
Breaking market news, AI analysis and trading signals instantly.
Join Channel