A stronger-than-expected US jobs print did not just move the dollar last week. It rewired the entire risk landscape, and the Australian dollar paid the bill. When Reuters reported that the dollar rose as strong payrolls reinforced Fed patience and pushed USD/JPY clear of 160, that single headline told you almost everything you needed to know about why AUDUSD finished the week pinned near its lows.
This is a weekend weekly review, so markets are closed and the tape is frozen for now. That makes it the perfect moment to step back from the candle-by-candle noise and ask the bigger question: was last week's slide in the Aussie a one-off reaction to a hot data point, or the start of something with more follow-through? AUDUSD today analysis has to begin with the macro engine, because for a risk-sensitive commodity currency, the macro engine is the chart.
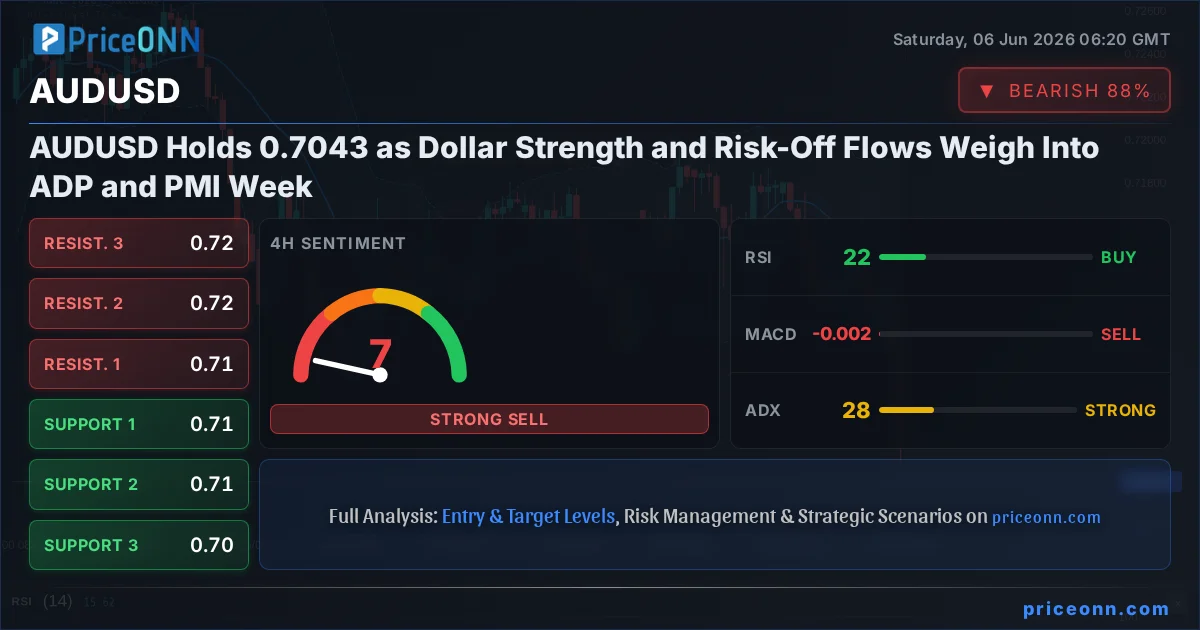
- AUDUSD closed last Friday at 0.70428, down 1.17% (-0.00833) on the day, after trading a weekly range of 0.71214 to 0.71478.
- The Dollar Index closed at 99.80, up 0.57%, with a 1-hour RSI of 80.95 deep in overbought territory: dollar strength was the single biggest weight on the Aussie.
- Momentum is stretched to the downside; the 1-hour RSI sits at 19.97 and Stochastic at K=4.05/D=6.45, both screaming oversold even as the 4-hour ADX at 27.76 confirms a genuine, committed downtrend.
- First support to defend is 0.70380; the line in the sand for any bounce is reclaiming 0.70507. ADP employment and US PMI data dominate the week ahead, alongside the Bank of Canada decision.
Time Horizon: This review covers the swing-trading window, looking back at last week's close and forward across the coming five sessions.
Why the Dollar Wrecking Ball Set the Tone for AUDUSD
Let us start with the catalyst, because price action without context is just numbers. The US employment report came in much stronger than expected, and the market read it the only way it could: if the labor market is still this resilient, the Fed has every reason to stay patient and keep policy restrictive for longer. Rate-cut hopes got pushed further out on the calendar, and money flowed straight back into the dollar.
You can see the fingerprints all over the data. The Dollar Index closed at 99.80, up 0.57% on the day, after pushing its daily range from 98.90 up to 99.27 and then extending higher. On the 1-hour chart the DXY RSI is at a blistering 80.95, with Stochastic at K=94.55/D=91.48 and ADX at 35.49. Translation: the greenback was not drifting higher, it was being aggressively bid, and the trend behind that move had real strength. When the dollar runs this hot, every major pair quoted against it feels the squeeze, and AUDUSD, sitting on the more vulnerable risk-sensitive side of the ledger, felt it more than most.
Here is the part that matters for the week ahead. An overbought reading like an 80-plus RSI on the dollar is not a sell signal on its own, but it does tell you the move is mature. The forex week-ahead commentary from the wires framed it well: the Fed countdown is now underway, and incoming US inflation and growth data could either justify this dollar strength or expose it as overextended. For AUDUSD, that means the Aussie's fate next week is only half its own story. The other half is written in Washington.
How Risk-Off Flows Turned the Aussie Into a Casualty
The Australian dollar is, at its core, a leveraged bet on global risk appetite and the commodity cycle. When traders feel brave and growth optimism is high, the Aussie tends to fly. When fear creeps in, it is one of the first currencies sold. Last week, fear did more than creep. It stormed in.
Look across the risk complex on Friday's close and the picture is stark. The Nasdaq 100 cratered 5.37% to 28804.39, with its 1-hour RSI collapsing to 13.20, an extraordinarily oversold reading that signals genuine panic selling rather than orderly profit-taking. Bitcoin dropped 4.14% to 61008, and Ethereum was absolutely hammered, down 11.56% to 1567.76 with a daily RSI of just 13.93. Crude oil joined the rout, with WTI sinking 6.21% to 91.75 and Brent off 5.24% to 95.65. This was a broad, synchronized liquidity grab across equities, crypto and commodities all at once.
Now connect the dots. A risk-sensitive currency cannot swim against that current. With equity indices in freefall and oil being dumped, the safe-haven bid flowed into the dollar and the yen, while pro-cyclical currencies like the Aussie, the Kiwi and the loonie got left holding the bag. NZDUSD fell 1.09% to 0.57949 and the broader commodity-currency bloc moved in lockstep. The Aussie's 1.17% drop was not an isolated technical event. It was AUDUSD doing exactly what it is built to do in a risk-off storm: bleed.
With the Dollar Index closing at 99.80 and the Nasdaq 100 down 5.37% in a single session, AUDUSD was caught in a double squeeze: a soaring safe-haven dollar on one side and collapsing risk appetite on the other. Until at least one of those two forces eases, rallies in the Aussie are likely to be sold.
What Last Week's Close Revealed in the AUDUSD Trend Analysis
Now this is where the multi-timeframe analysis gets interesting, because the technicals are telling a layered story rather than a single one. On the surface, every timeframe carries a SELL signal, but the texture underneath each one is different, and that difference is exactly what swing traders need to read.
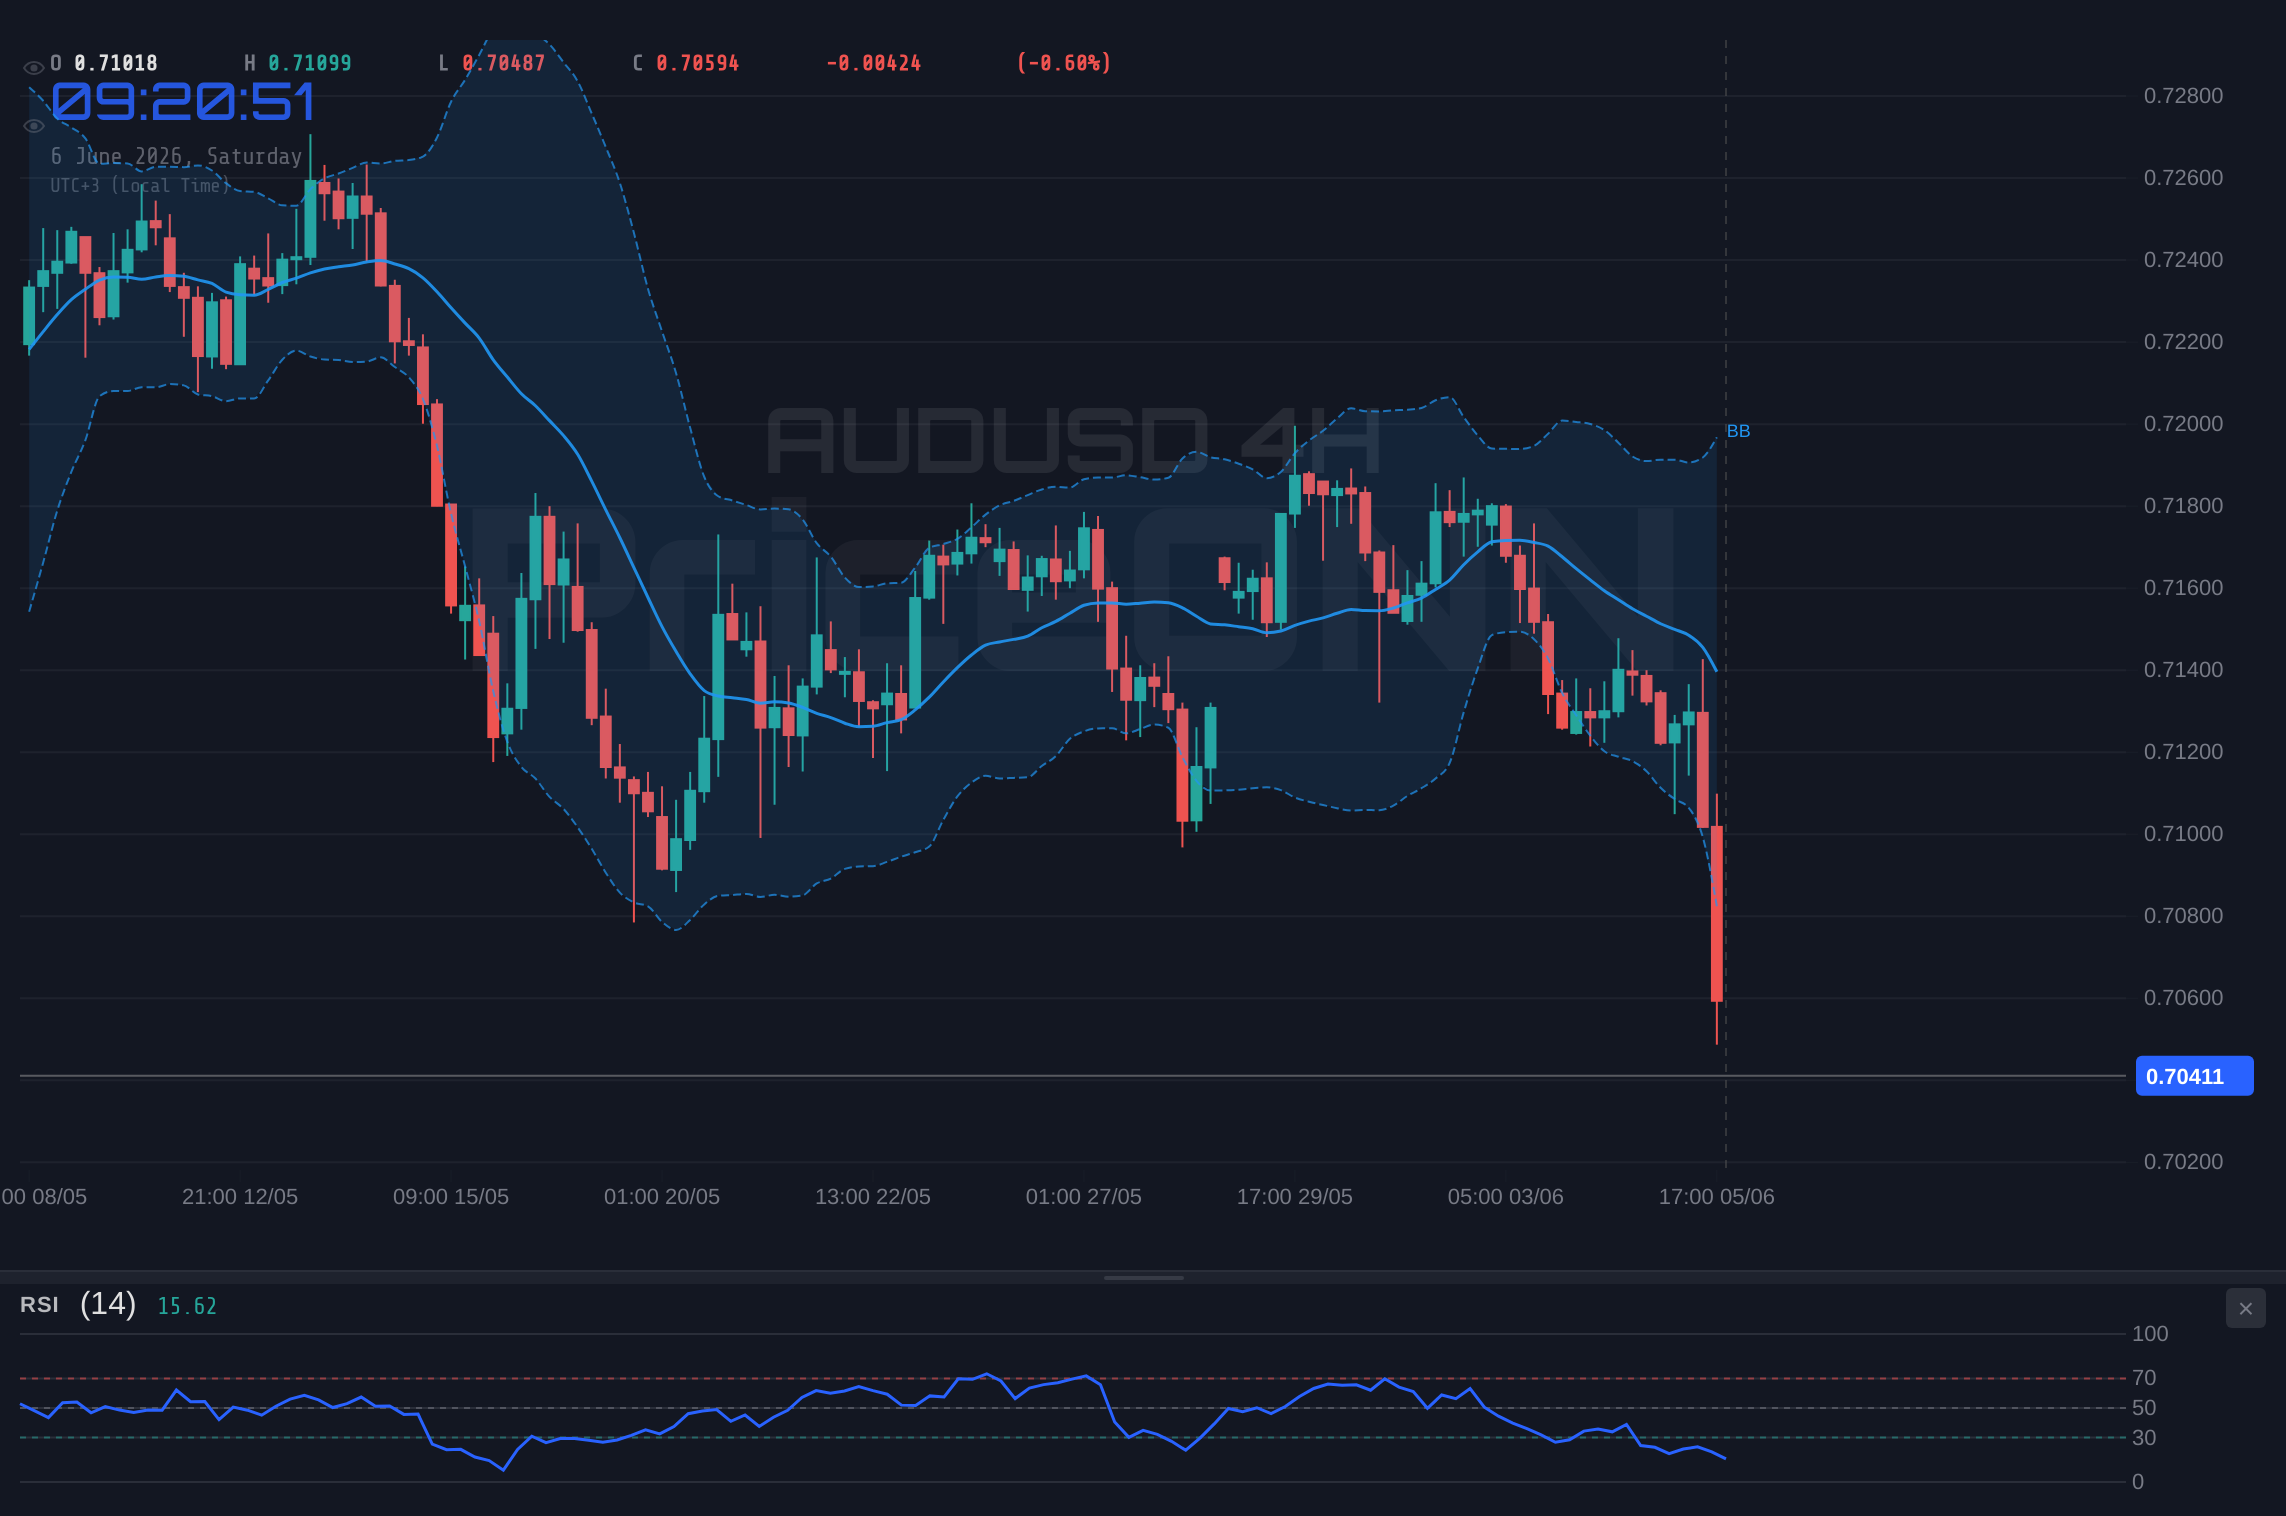
On the 1-hour chart, the downtrend is running at full throttle: trend strength is pegged at 100%, the ADX sits at a forceful 42.72, and the RSI has been driven down to 19.97. That is deep oversold. The Stochastic at K=4.05/D=6.45 confirms it. When you see a strong-trend ADX above 40 paired with a sub-20 RSI, you are looking at sellers who are in complete control but also stretched thin in the very short term. That combination often produces a sharp relief bounce inside a still-bearish structure, the classic bear-flag retest that traps late shorts before resuming lower.
Step out to the 4-hour chart and the trend is still firmly down at 89% strength, but the ADX cools to 27.76. Above 25 still counts as a strong, committed trend, so this is not a market that has lost conviction. The 4-hour RSI at 21.70 echoes the oversold theme, and price closing below the lower Bollinger band tells you the move has been violent enough to break out of its normal volatility envelope. That is a hallmark of capitulation, not a quiet drift.
The daily chart is where the nuance lives. Here the trend reads as neutral with 50% strength, the RSI is a balanced 47.02, and the ADX has faded to 18.42, a weak-trend, range-bound reading. In plain English: zoom out far enough and last week's drop, however dramatic intraday, has not yet broken the bigger picture. The Aussie is still inside a wider daily range, and the lower-timeframe carnage has not converted into a daily trend break. That tension between a screaming-bearish 1-hour and a neutral daily is the single most important thing on this chart right now.
The 4-hour ADX at 27.76 is the real story. A strong-trend reading like this means the breakout has committed on the swing timeframe, yet the daily ADX at 18.42 says the bigger range is still intact. When lower timeframes scream and the daily shrugs, the highest-probability play is to trade the bounce-and-fade rather than chase the breakdown blind.
AUDUSD Support and Resistance: The Levels That Actually Matter
Levels are only useful when they are drawn from real data, so every number below comes straight from last Friday's readings. With AUDUSD parked at 0.70428, the immediate battleground is tight. The first layer of support sits at 0.70380, then 0.70334, with a more meaningful shelf at 0.70253. Lose that 0.70253 floor on a closing basis and the next downside reference opens up, because the buyers who tried to defend the round-number zone will have been swept out.
On the upside, the first hurdle is 0.70507. This is the level bulls must reclaim just to argue that the relief bounce has legs. Above it, 0.70588 and 0.70634 form the next band of resistance, and that 0.70634 area lines up closely with where the 4-hour structure starts to get heavy. Step up to the 4-hour map and the larger resistance shelf at 0.71291 marks the ceiling of last week's breakdown, while the daily resistance cluster sits up at 0.71626 and beyond. Those higher levels are not in play for an immediate bounce, but they define where a genuine trend reversal would have to prove itself.
Why do these tight levels matter more than the wider ones this week? Because with momentum this oversold, the first 30 to 50 pips of any move will tell you who won the weekend. A clean reclaim of 0.70507 with follow-through hints that the oversold bounce is real. A rejection there, followed by a slip back under 0.70380, says the sellers were simply reloading. AUDUSD key levels rarely get more binary than this.
The Week Ahead: ADP, PMI and a Loaded US Calendar
Here is where patience gets tested, because the coming week is front-loaded with exactly the kind of US data that can either supercharge the dollar or finally let some air out of it. The headline acts are ADP employment and the US PMI releases, and for a dollar-driven pair like the Aussie, these are the events that will set the tone.
On the labor side, the ADP private payrolls figure is forecast around 211 thousand against a prior near 215 thousand, a slight cooling but still a solid number if it lands. After Friday's hot official jobs report, the market is primed to treat any further labor-market strength as confirmation that the Fed can keep waiting. The unemployment rate is expected to hold at 4.3%. On the growth side, the PMI prints carry a manufacturing reading near 50.9 and a services-side figure around 53.6, both hovering at or just above the 50 line that separates expansion from contraction. A services PMI holding comfortably above 50 would reinforce the soft-landing, sticky-inflation narrative that has been the dollar's best friend.
There is also a regional commodity-currency angle worth flagging. The wires noted that the Bank of Canada is widely expected to hold interest rates as prices rise but the economy wobbles. While that decision is about the loonie, it matters for the Aussie too, because the whole commodity-currency bloc tends to trade as a sentiment cluster. A dovish or downbeat tone from one central bank in that group can spill over into broader pro-cyclical-currency weakness.
With ADP, PMI and a Bank of Canada decision all clustered into the same week, AUDUSD volatility analysis points to elevated headline risk. Oversold readings can stay oversold when a strong data run keeps the dollar bid. Do not assume the bounce is automatic just because the RSI is low.
So how should you frame the data? If ADP beats and PMI stays firm, expect the dollar to find fresh fuel and the Aussie's oversold bounce to get sold quickly. If, on the other hand, ADP disappoints and PMI slips toward 50, the market may finally question whether the dollar has run too far too fast, and that is the scenario where AUDUSD's deeply oversold momentum could spring a sharper relief rally. The data is the gatekeeper. The chart just tells you where the doors are.
Three Scenarios for AUDUSD: Mapping the Probabilities
Pulling the macro and the technical threads together, here is how the week sets up. The base case leans bearish because the dollar trend is strong and risk appetite is fragile, but the deeply oversold short-term momentum means a relief bounce is a live risk for anyone short. These three scenarios cover the realistic paths, and the probabilities sum to 100%.
Downtrend Resumes: Sellers Keep the Whip Hand
60% ProbabilityOversold Consolidation: The Market Catches Its Breath
25% ProbabilityRelief Bounce: Oversold Springs a Snapback
15% ProbabilityNotice the asymmetry. The bearish scenario carries the highest probability because it is aligned with both the dominant dollar trend and the risk-off backdrop. But the bullish snapback is not zero, precisely because the oversold readings are so extreme. That is the confluence puzzle traders have to solve this week: strong bearish trend versus exhausted bearish momentum.
What Different Traders Should Watch This Week
Not every trader reads this chart the same way, and that is by design. For the scalper working the 1-hour, the story is all about that 0.70380-to-0.70507 box. With the RSI at 19.97 and Stochastic near the floor, fading the extremes of that range is tempting, but the 42.72 ADX is a loud warning that the trend can keep grinding lower. Scalpers should respect tight risk and let the level break before committing, rather than knife-catching a falling market.
For the swing trader, the 4-hour structure is the anchor. A close below the lower Bollinger band with a 27.76 ADX says the trend is real, so the higher-probability swing approach is to wait for the oversold bounce into the 0.70507 to 0.70634 resistance band and look for rejection signals to rejoin the downtrend, rather than buying weakness blindly. The invalidation is clean: a sustained reclaim of the 4-hour structure above 0.71291 would change the thesis entirely.
For the longer-term, position-oriented trader, the daily chart's neutral 50% trend reading and 47.02 RSI are the key. This trader should not over-react to one volatile week. The bigger range is still intact, and the real signal will come from whether the dollar's overbought condition resolves into a deeper correction or simply consolidates before another leg up. Until the daily ADX climbs back above 25 in either direction, the long-term picture stays a wait-and-see range play.
Patience looks like it will be rewarded here. With a loaded US calendar and price sitting on tight support, the market is likely to give a cleaner setup once the data resolves the dollar's overbought condition. Let the level break or the bounce reject before committing, and manage risk around the well-defined 0.70380 and 0.70507 pivots.
Tying the Macro and the Chart Back Together
The thread running through every part of this review is the same one Reuters captured in that opening headline: a strong jobs report reinforced Fed patience, the dollar surged, risk appetite buckled, and the Aussie, sitting at the crossroads of both forces, slid to 0.70428. The technicals did not lead this move. They confirmed it. The strong 4-hour ADX, the broken Bollinger band, the sub-20 RSI: these are the chart's way of recording a fundamentally driven sell-off, not predicting one out of thin air.
That is why the week ahead hinges on data more than on any single support line. The levels tell you where the reactions will happen. The ADP and PMI prints tell you which direction those reactions will favor. Combine PriceONN's multi-timeframe analysis with a clear read of the dollar's overbought condition, and you have a framework rather than a guess.
Frequently Asked Questions: AUDUSD Analysis
What happens if AUDUSD breaks below 0.70380 support this week?
A sustained hourly close below the 0.70380 first support, especially on a strong ADP or PMI beat, would open the path toward 0.70334 and then the deeper 0.70253 floor. With the 1-hour ADX at 42.72 confirming a powerful downtrend, that break carries roughly a 60% probability as the base case for the week.
Is the AUDUSD RSI at 19.97 a buy signal at current levels of 0.70428?
Not on its own. A 1-hour RSI near 20 signals an oversold, stretched market, but the 42.72 ADX shows the downtrend is still strong, so oversold can stay oversold. The higher-probability play is to wait for a reclaim of 0.70507 as confirmation before treating the bounce as real, rather than catching the falling knife.
Why did AUDUSD fall 1.17% last week even though the daily trend is neutral?
The daily chart reads neutral with a weak 18.42 ADX, but the sell-off was driven by a surging dollar, with the DXY closing at 99.80, and a sharp risk-off wave that saw the Nasdaq 100 drop 5.37%. As a risk-sensitive commodity currency, AUDUSD got squeezed from both sides even before the bigger daily range was threatened.
How will the ADP and PMI data affect AUDUSD this week?
ADP is forecast near 211 thousand and services PMI around 53.6. A strong beat would reinforce Fed patience and dollar strength, pressuring AUDUSD back toward 0.70253. A soft miss could cool the overbought dollar and let the deeply oversold Aussie stage a relief bounce toward the 0.70588 to 0.70634 resistance band.
For now, the Aussie heads into the new week oversold but not broken, bruised by the dollar but still holding above its near-term floor. Volatility creates opportunity, and those who let the data resolve before committing will be the ones holding the cleaner setup. Watch 0.70380 on the downside and 0.70507 on the upside: the first decisive break of either will hand you the week's bias on a plate.
Track markets in real-time
AI-powered analysis, technical indicators and real-time price data.
Join Our Telegram Channel
Breaking market news, AI analysis and trading signals instantly.
Join Channel