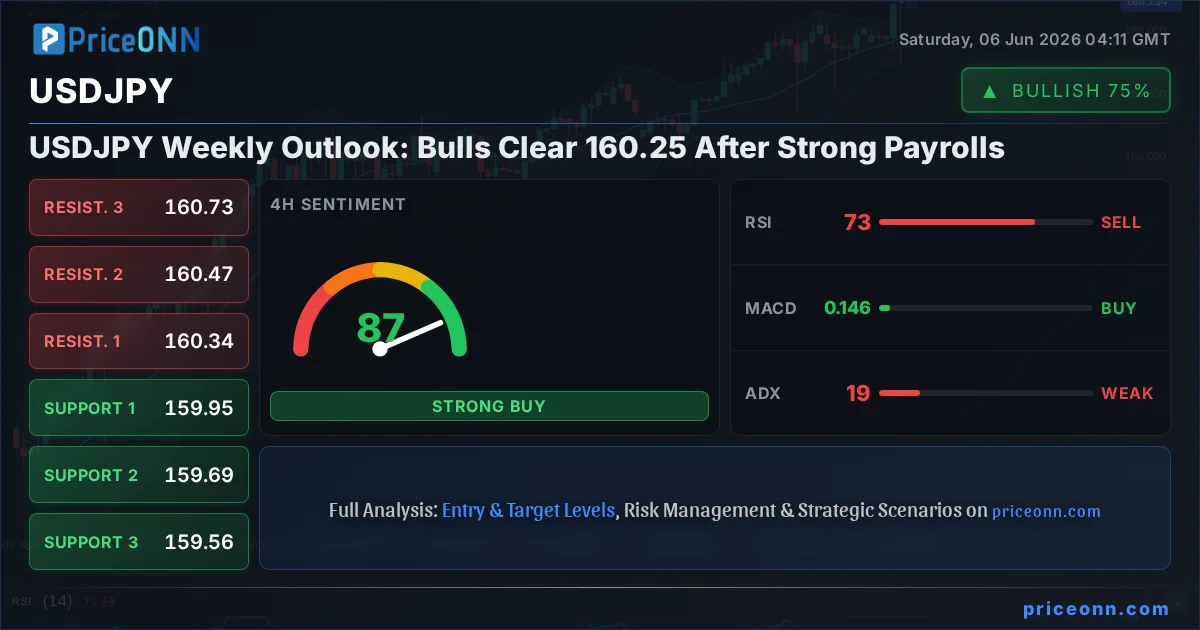
Who actually won the fight at 160 last week? On paper, the bulls did: USDJPY closed Friday at 160.25, finishing the week above the round number that Japan's Ministry of Finance spent ¥11.7 trillion trying to protect. But anyone reading the chart closely knows a Friday close above a defended level is only round one. The real contest, between dollar strength and intervention fear, is far from settled.
This USDJPY weekly outlook breaks down the battle line at 160 from both sides. We will build the bull case, then hand the microphone to the bears, let the indicators across the 1H, 4H, and daily charts act as evidence, and finish with a clear verdict on where the higher-probability path lies into next week. No trade recommendation here, just an honest read of a market that is more fragile than the headline close suggests.
- USDJPY closed last Friday at 160.25, finishing the week above the 160 level Japan defended in prior episodes with ¥11.7 trillion in intervention.
- The daily chart still reads bullish (trend strength 87%) with daily RSI at 64.06, but the 4H RSI at 72.89 and 4H Stochastic at K=86.9 / D=81.16 are flashing overbought.
- The 4H ADX sits at just 18.77, a weak-trend reading that says this breakout has not fully committed yet; conviction is thinner than price implies.
- A stronger-than-expected US payrolls report reinforced the Fed-patience narrative, lifting DXY to 99.80 (+0.57%) and dragging USDJPY higher on the rate-differential story.
Time Horizon: This is a weekend weekly review and forward look. Markets are closed; all levels reference last Friday's close and the technical picture going into next week.
Why 160 Is the Line in the Sand for the Yen
Every market has a level where psychology and policy collide. For USDJPY, that level is 160. It is not just a round number; it is the price at which Japanese officials have historically reached for the intervention button. The reporting around prior episodes is blunt: Japan committed roughly ¥11.7 trillion to defend this zone, and traders have not forgotten. That history is exactly why last week's close at 160.25 matters more than a normal 25-pip move above a figure.
The catalyst was American, not Japanese. As Reuters framed it last Friday, the dollar rose broadly after a much stronger-than-expected US employment report reinforced confidence that the Fed can stay patient, and USD/JPY cleared 160 in that move. Strong payrolls do two things at once for this pair. They push back the timing of any Fed easing, which keeps US yields elevated, and they widen the rate differential that has been the engine of yen weakness for the better part of two years. When the gap between US and Japanese yields stays wide, carry traders keep their shorts in the yen, and gravity pulls USDJPY higher.
So the stage is set. Bulls have a fresh fundamental catalyst and a confirmed weekly close above the defended level. Bears have an absent buyer with very deep pockets, sitting just under the market, watching. Let's hear both cases properly.
The Bull Case: Rate Differentials and a Confirmed Breakout
Start with the structure, because the bullish argument leans hardest on trend. On the daily chart, USDJPY is in an uptrend with a trend-strength reading of 87%, and the indicator scoreboard is lopsided: six buy signals against a single sell. The daily RSI at 64.06 sits in the upper half of neutral with a clear bullish tilt, meaning there is still room to run before momentum is genuinely exhausted. This is not a market screaming reversal on the higher timeframe.
Momentum confirms the structure. The daily MACD holds positive, with the line above its signal, the kind of reading that tends to accompany continuation rather than tops. On the 1-hour chart the bullish case is even cleaner: trend strength of 87%, RSI at 61.65 leaning higher, MACD positive, price holding above the middle Bollinger band, and a buy tally of seven against one. When the short timeframe and the long timeframe agree on direction, the path of least resistance is usually the direction they share.
The DXY Engine Behind USDJPY Trend Analysis
No USDJPY trend analysis is complete without the dollar index, and right now DXY is doing the heavy lifting. The greenback closed the week at 99.80, up 0.57%, with the 1-hour DXY trend pinned at 100% strength and the daily scoreboard a perfect eight buys to zero sells. Here is the simple correlation traders need: when DXY pushes higher, USDJPY tends to follow, because a broadly strong dollar plus a structurally weak yen is the most direct expression of that strength. With DXY firm and the payrolls report fresh in the tape, the bull thesis has a tailwind that is hard to argue with on a multi-day view.
There is a forward-looking angle too. The Week Ahead commentary flagged that the Fed countdown is beginning, with Chair Warsh's first meeting approaching and key US inflation data on the calendar. If that inflation data lands hot, the patience narrative deepens, yields stay bid, and the rate-differential story that powers USDJPY gets another log on the fire. Bulls would argue that a close above 160.25 is just the opening move of a larger leg toward the daily resistance shelf at 160.544 and then the psychologically loaded 161.006.
The daily and 1H charts both print uptrends with bullish MACD and supportive RSI, while DXY at 99.80 backs the move. Until a daily close breaks back below 159.574, the structural uptrend stays intact.
The Bear Case: Intervention Risk and an Overbought Tape
Now the other side, and the bears have sharper teeth than the calm daily chart suggests. Their first and strongest argument is not technical at all. It is the standing threat of Japanese intervention. The pre-weekend coverage was explicit, asking whether another intervention was coming as USD/JPY approached 160.00, and reminding traders that Japan has already spent ¥11.7 trillion defending this exact figure. One headline put it plainly: traders may test it again. When a buyer that size is known to be lurking, every push above 160 carries asymmetric risk; the move that takes you 50 pips higher can be erased in minutes by a single coordinated yen-buying operation.
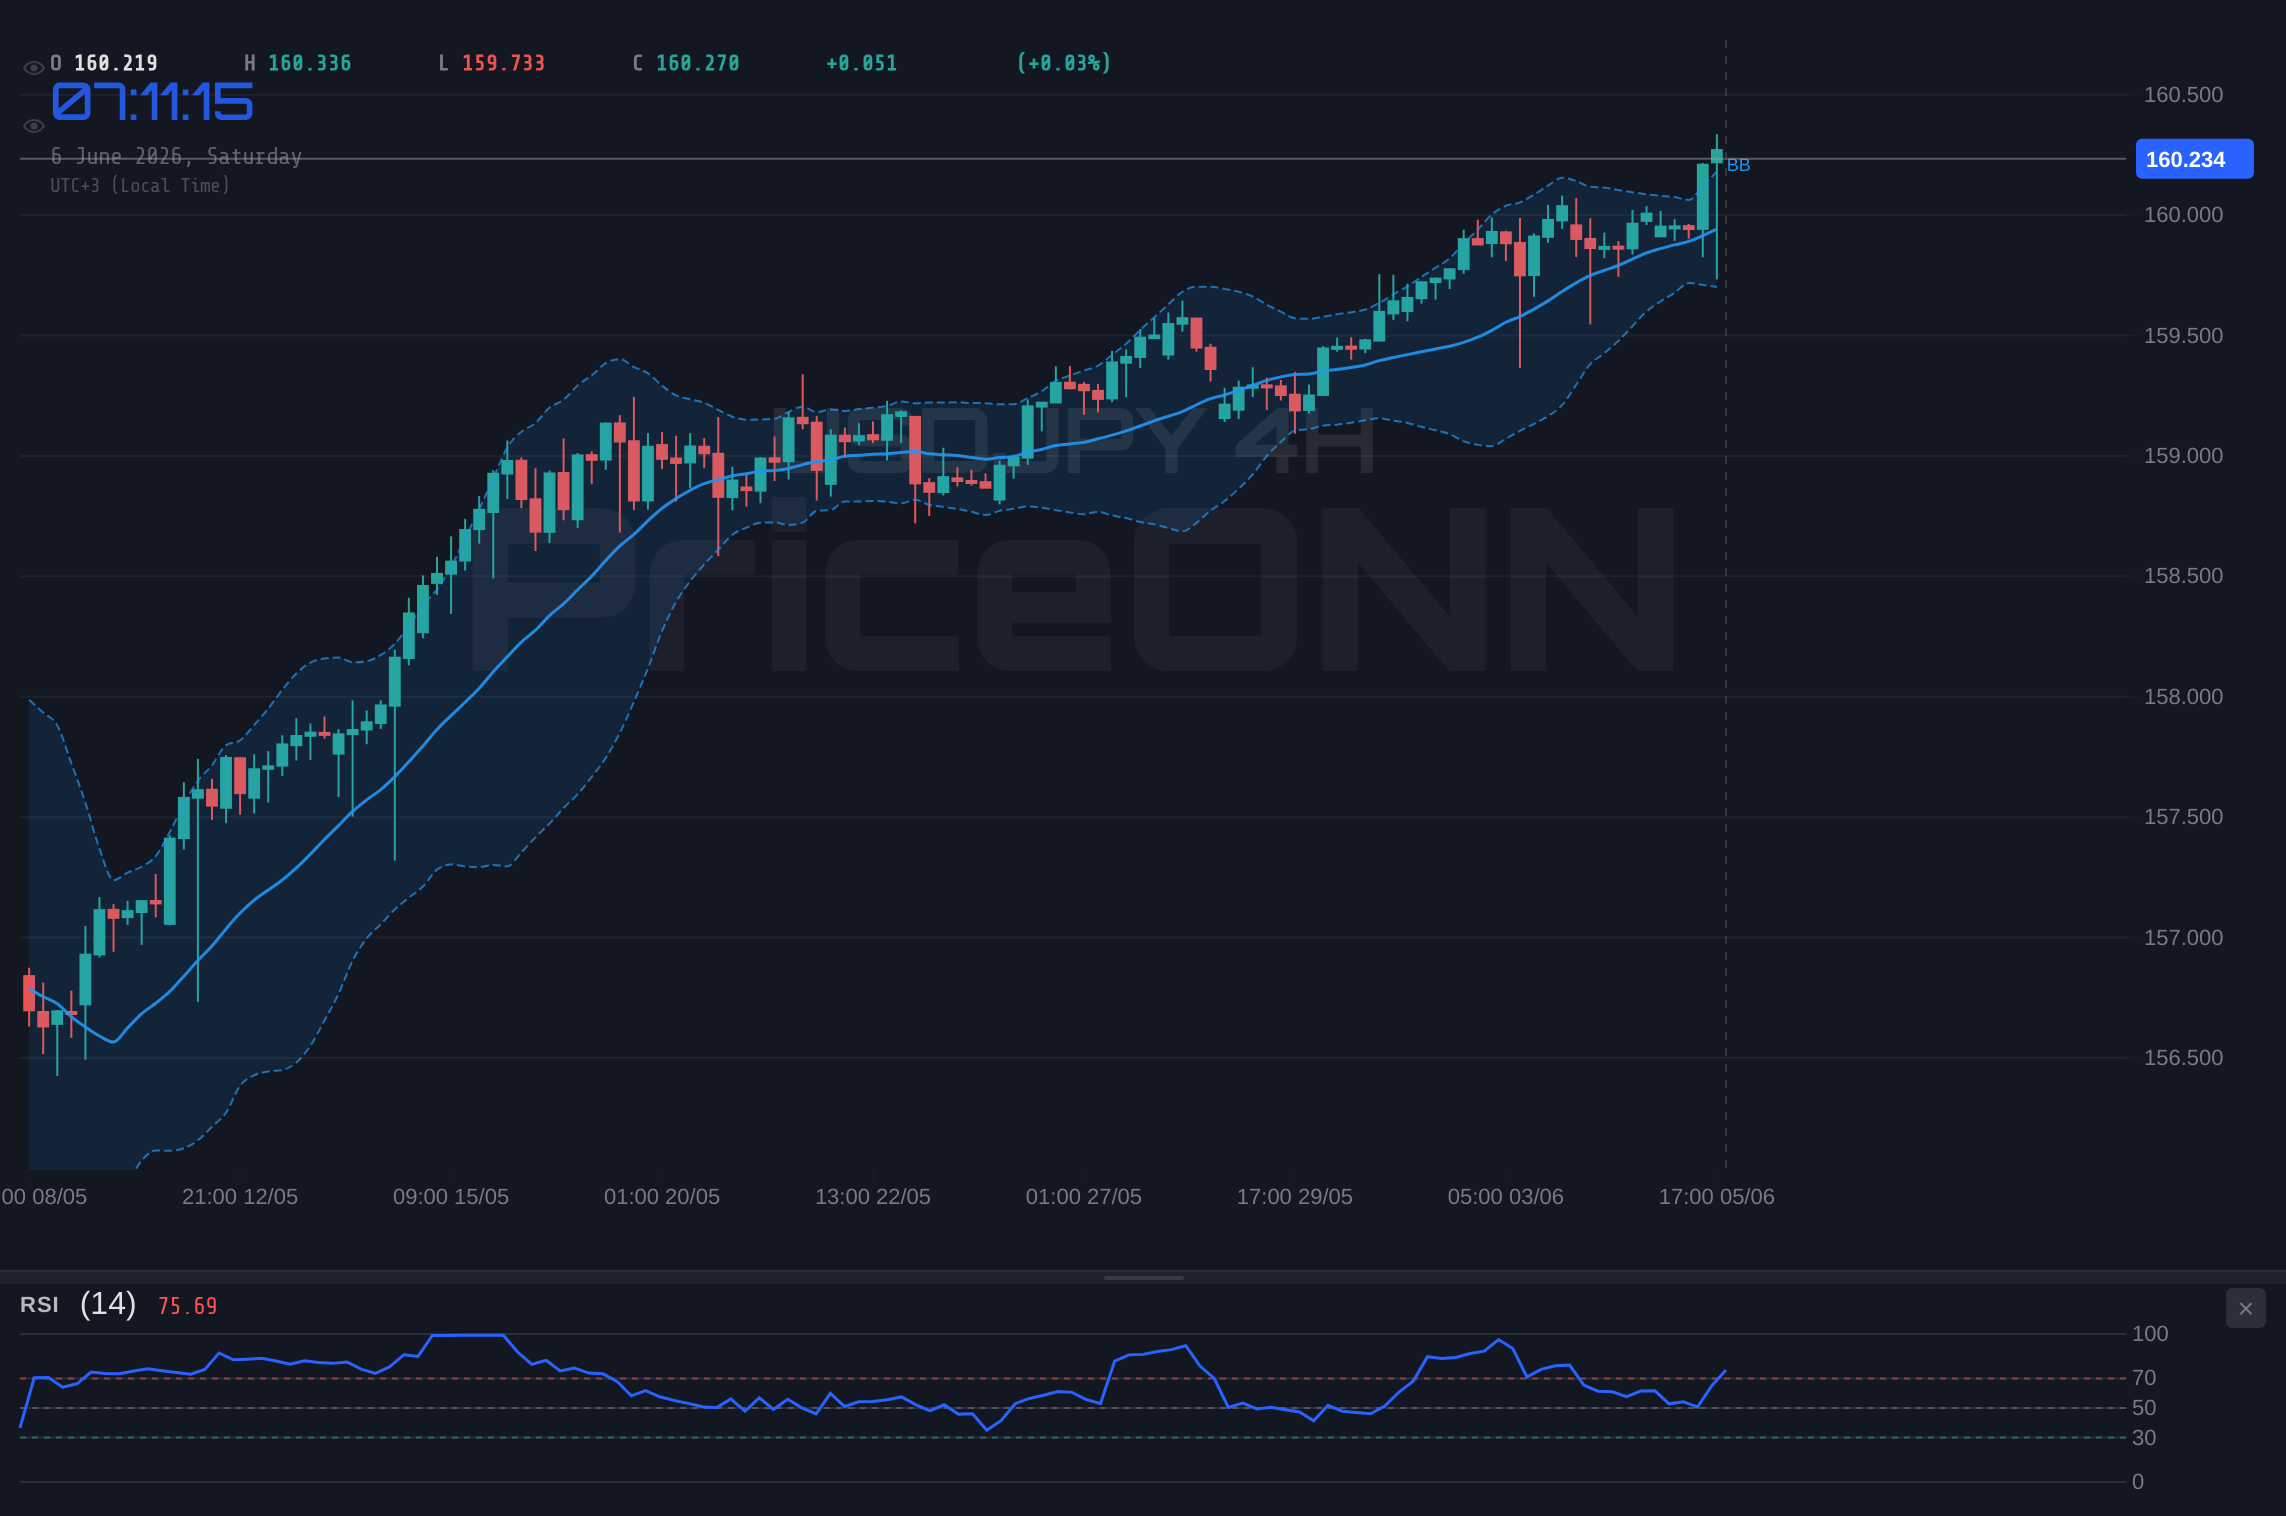
The second bearish argument lives in the momentum readings on the timeframe that matters most for swing positioning: the 4-hour chart. Here the picture changes character. The 4H RSI sits at 72.89, firmly in overbought territory, the zone where buying pressure historically starts to meet supply. The 4H Stochastic is even more stretched, with %K at 86.9 and %D at 81.16, deep in overbought, and price has pushed above the upper Bollinger band. That combination, RSI overbought plus Stochastic overbought plus a band-rider, is classic late-stage momentum. It does not guarantee a reversal, but it tells you the easy money on the long side has already been made.
What the ADX Reading Reveals About USDJPY Volatility Analysis
Here is the detail most traders skim past, and it is arguably the single most important number in this entire USDJPY volatility analysis. The 4-hour ADX is sitting at just 18.77. An ADX below 20 signals a weak, non-committed trend, effectively a market that is drifting rather than driving. That is the bear's quiet ace. Price has cleared 160, the headlines say breakout, but the trend-strength gauge on the 4H is whispering that the move lacks conviction. The 4H trend itself is classified as neutral at 50% strength, despite the daily uptrend. When a breakout happens on weak ADX into overbought oscillators, the risk of a fakeout, a stop hunt above the figure followed by a reversal, rises sharply.
Stack those together and the bear scenario writes itself. An overbought 4H tape, a daily Stochastic already pinned near the ceiling at K=96.2, a non-committal ADX, and a deep-pocketed official buyer waiting just under the market. The bears do not need the trend to break. They only need a catalyst, a verbal warning from the Ministry of Finance, a soft US data print, or simple profit-taking, to trigger a sharp unwind back toward the 4H support cluster at 159.951 and the daily pivot zone near 159.574.
Intervention risk is binary and brutal. With 4H RSI at 72.89, Stochastic overbought, and ADX at 18.77 showing a weak trend, a verbal or actual MoF response could spark a fast liquidity grab lower. Longs above 160 carry headline risk that no chart can price.
Reading the Tape: When the Indicators Disagree
The most honest thing you can say about USDJPY right now is that the timeframes are not telling the same story, and that disagreement is the real signal. The daily chart is constructive, RSI at 64.06 with room to run and a clean bullish trend. The 1-hour chart agrees, with seven buy signals and a 61.65 RSI. But the 4-hour chart, the swing trader's home base, is overbought and trendless at the same time, with RSI at 72.89 and ADX at 18.77.
This is a textbook conflict, and the resolution rule is simple: when momentum oscillators are overbought but the higher-timeframe trend is still up, you do not fade the trend, but you also do not chase the breakout. You wait for one of two things. Either price digests the overbought condition through a sideways grind that resets the 4H Stochastic and RSI, after which a fresh push higher has more fuel, or price rejects sharply from the 160.30 to 160.73 resistance band and the overbought readings unwind through a pullback toward support.
Notice what the daily Stochastic is doing while we debate this: K=96.2 and D=83.39, about as overbought as a reading gets. On its own that is a caution flag, but the daily MACD is still positive and the trend score is 87%, which is why this is a watch situation rather than a clean directional call. Conflicting signals like these are exactly why patience beats prediction here. The market has not resolved the tension yet, and forcing a view onto an unresolved chart is how accounts get hurt.
The cleanest tell next week is the 4-hour close. A 4H close back inside the Bollinger bands while RSI cools below 70 would signal the overbought froth is bleeding off in a healthy way. A 4H close that pushes higher while RSI climbs past 75 raises the odds of an exhaustion blowoff, the kind that invites intervention.
The Verdict: Bulls Lead, But on a Short Leash
So who wins? On balance, the bulls hold the structural advantage into next week. The daily trend is up, the dollar is firm at 99.80, and the fundamental driver, a patient Fed sitting on a wide rate differential, is intact and arguably strengthening ahead of the inflation data. A market that closes the week above a heavily defended level has, for now, demonstrated that demand outweighs the fear of intervention.
But this is a lead on a short leash, not a runaway. The 4H overbought condition and the weak 18.77 ADX mean the breakout has not earned full conviction, and the intervention threat is a permanent asterisk on every long. The higher-probability path is continuation with chop, a market that grinds toward the 160.54 to 161.01 daily resistance band while shaking out impatient longs along the way, rather than a clean vertical run. The thesis that flips this view is a daily close back below 159.574, which would hand momentum to the bears and put the 159.11 and 158.86 supports into play.
This is precisely the kind of two-sided, headline-sensitive setup where standing aside until the tape resolves is a position in itself. The market always gives a second look; you do not have to catch the first 30 pips above a level that a central authority is willing to spend trillions defending.
Three Scenarios for USDJPY Next Week
Here is how the week ahead could realistically unfold, mapped to the live levels from Friday's close. Probabilities reflect the balance of a bullish daily structure against overbought 4H momentum and standing intervention risk.
Bullish Continuation: Differential Keeps Driving
45% ProbabilityRange-Bound Digestion: Overbought Reset
35% ProbabilityIntervention Snap: The Trillion-Yen Risk
20% ProbabilityUSDJPY Support and Resistance: Key Levels to Watch
These are the levels that matter into next week, drawn directly from the multi-timeframe data. With Friday's close at 160.25, the immediate battle is the 160.29 to 160.34 resistance pivot just overhead and the 160.05 to 159.95 support shelf just below.
What Different Traders Should Watch
For the intraday scalper, the 1H map is the playbook: 160.046 is the first line of defense, and a clean reclaim of 160.301 reopens the 160.446 to 160.556 zone. The scalper's enemy here is the overbought 1H Stochastic backdrop on the higher 4H frame, which raises the odds of quick rejections at resistance.
For the swing trader, the 4H is decisive. As long as price holds above 159.951 and the 4H ADX stays weak, this is a range-with-upside-bias environment, not a runaway trend to chase. The swing trader's signal is a 4H Stochastic reset out of overbought, which would offer a cleaner re-entry into the daily uptrend.
For the longer-term positional trader, the story is the rate differential and the 159.574 daily pivot. The macro thesis, wide US-Japan yield gaps powering yen weakness, stays intact above that level and remains the dominant force regardless of short-term overbought noise. The one variable no model can price is the timing of an intervention, which is why position sizing matters more than precision here.
The Calendar That Decides It
Next week is a data week, and the Week Ahead commentary made the stakes clear: the Fed countdown is beginning, with Chair Warsh's first meeting approaching and key US inflation data due that could reshape expectations. For USDJPY, the transmission is direct. A hot inflation print hardens the Fed-patience narrative, keeps US yields elevated, widens the differential, and feeds the bull case toward 160.54 and 161.01. A soft print does the opposite, taking pressure off the yen and giving the bears the catalyst they have been waiting for to exploit those overbought 4H readings.
Watch the dollar index as your confirmation gauge. DXY closed at 99.80 with a strong near-term trend but a 1-hour RSI at 80.95, itself deeply overbought. If the dollar index stalls and rolls over from that stretched reading, USDJPY loses its primary tailwind, and the overbought oscillators on the pair suddenly have company. Conversely, a DXY that consolidates and pushes higher gives the USDJPY bulls everything they need to press the 161 handle.
The geopolitical layer adds another dimension. The same commentary noted that optimism over a reopening of the Strait of Hormuz faded as US and Iran officials toned down talks, keeping oil and broader risk sentiment on edge. A genuine risk-off shock would normally send haven flows into the yen, which is the one fundamental development that could overpower the rate-differential story and put a hard ceiling on USDJPY. For now that remains a tail risk rather than a base case, but in a market sitting on a defended level, tail risks deserve respect.
Frequently Asked Questions: USDJPY Analysis
What happens if USDJPY breaks above 160.544 next week?
A daily close above the 160.544 resistance shelf would confirm the bullish continuation scenario and open the path toward the psychological 161.006 ceiling. That move would need DXY to hold above 99.80 and the US inflation data to keep the Fed-patience narrative alive. The main caveat is intervention risk, which grows sharper the further price climbs above 160.
Is the 4H RSI at 72.89 a sell signal for USDJPY right now?
Not on its own. An RSI of 72.89 confirms the 4-hour chart is overbought, meaning buying pressure is stretched, but the daily trend is still up at 87% strength with positive MACD. Overbought in an uptrend usually signals a pause or pullback to reset momentum rather than a full reversal, so it is a caution flag, not a standalone sell trigger.
Why does the 4H ADX at 18.77 matter for USDJPY this week?
An ADX of 18.77 is a weak-trend reading, signaling that the breakout above 160 has not fully committed and the 4-hour move lacks conviction. Combined with overbought oscillators, it raises the odds of a fakeout or choppy range rather than a clean trend leg. It is the single best argument that traders should wait for confirmation instead of chasing the close at 160.25.
How could Japanese intervention affect USDJPY after the close at 160.25?
Japan has historically defended the 160 level, reportedly committing ¥11.7 trillion in prior episodes, so a verbal warning or actual yen-buying operation could trigger a fast drop toward 4H support at 159.692 and daily support at 159.112. This risk is binary and not visible on any chart, which is why it caps the conviction of any long above 160. Watching for official commentary is as important as watching the technicals next week.
The verdict into next week is a measured one: the bulls hold the structural edge with the daily trend and a firm dollar behind them, but the overbought 4H tape, the weak 18.77 ADX, and the ever-present intervention threat mean this is a market to respect rather than chase. Volatility around a defended level always creates opportunity for those who wait for confirmation; let the inflation data and the 159.57 to 160.54 range resolve the tension, and the cleaner setup will reveal itself. Patience, as it usually does at the 160 line, looks set to be rewarded.
Track markets in real-time
AI-powered analysis, technical indicators and real-time price data.
Join Our Telegram Channel
Breaking market news, AI analysis and trading signals instantly.
Join Channel