The energy markets are in turmoil, and Brent crude oil is leading the charge downwards, shedding significant ground to trade at $88.64. This dramatic price action isn't just a random fluctuation; it's a direct response to escalating hopes for a peace deal in the Strait of Hormuz. The implications are profound, suggesting a potential shift in geopolitical risk premiums that have supported oil prices for so long. As a senior analyst with a deep understanding of energy infrastructure and market dynamics, I see this as a critical juncture, demanding a close examination of the technicals and the underlying fundamentals driving this sharp decline.
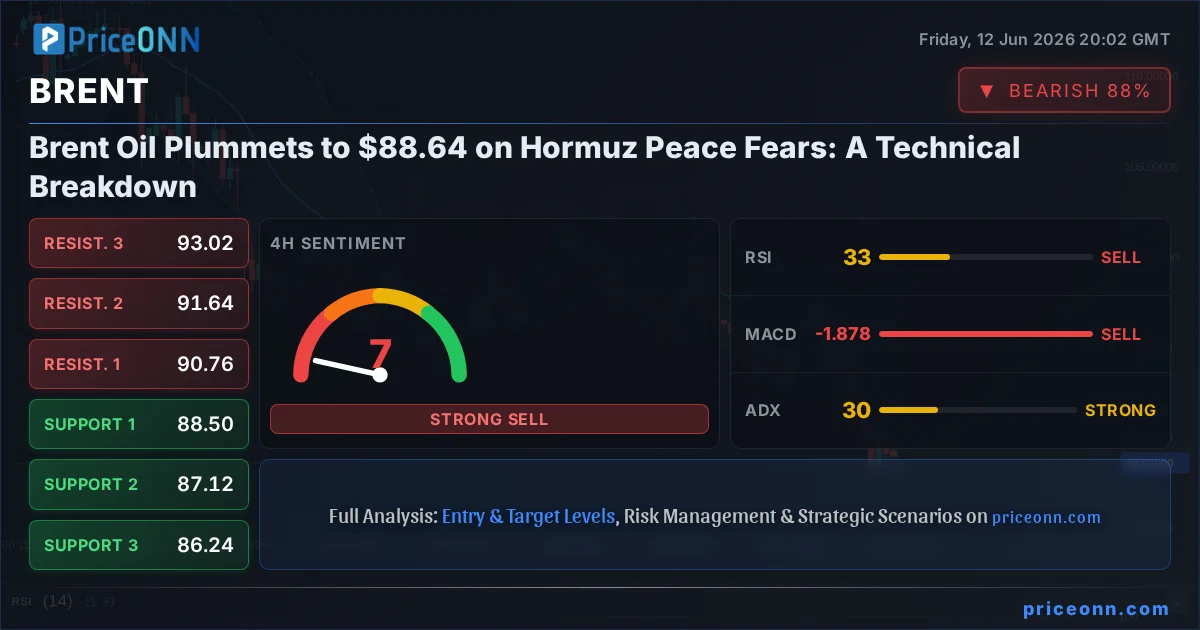
- Brent crude oil has plummeted to $88.64, marking a significant 8.53% daily decline.
- The primary driver appears to be increased optimism surrounding a potential US-Iran peace deal in the Strait of Hormuz.
- Technical indicators on the daily chart show a strong downtrend, with RSI at 35.15 and ADX at 16.56 suggesting a weakening trend but significant downward momentum.
- Key support levels for Brent are identified at $88.50, $88.22, and $87.80, while resistance is eyed at $89.20, $89.62, and $89.90.
- The 4-hour chart shows a strong downtrend (ADX 29.86) with RSI at 32.55 and Stochastic in oversold territory, indicating further downside potential.
The Shifting Sands of Geopolitical Risk
For months, the specter of conflict in the Middle East has been a primary driver underpinning crude oil prices. The Strait of Hormuz, a vital chokepoint for global oil shipments, has been a constant source of anxiety. Any hint of escalation or disruption has historically sent prices soaring, as traders priced in the risk of supply disruptions. However, recent developments, largely fueled by diplomatic overtures and cautious optimism surrounding a potential US-Iran peace deal, have begun to dismantle this risk premium. The news that oil prices have tumbled by more than 4% on Friday, as reported by various sources including Reuters and CNBC, is a clear signal that the market is reassessing the geopolitical landscape. This isn't just about current supply; it's about the perceived future stability of one of the world's most critical energy arteries. The swiftness of the decline from recent highs near $97.59 to the current $88.64 underscores how heavily priced-in the risk of conflict had become.
Technical Sell-Off: The Charts Scream Bearish
Turning our attention to the technicals, the picture for Brent crude is unequivocally bearish across multiple timeframes, but particularly on the longer daily charts. The daily timeframe reveals a strong downtrend with a power rating of 100%, a stark contrast to the cautious neutrality seen in shorter timeframes. The Relative Strength Index (RSI) at 35.15, while in the neutral zone, clearly shows a downward trajectory, indicating that sellers are firmly in control and buyers are hesitant. The Moving Average Convergence Divergence (MACD) is painting a similar bearish narrative, with negative momentum and the MACD line sitting below its signal line. This suggests that selling pressure is building and likely to continue. The Bollinger Bands are also positioned below the middle band, a classic sign of downward price pressure. Even more telling is the Stochastic Oscillator, with K at 23.87 and D at 39.52, firmly in oversold territory, yet still showing a bearish signal as %K
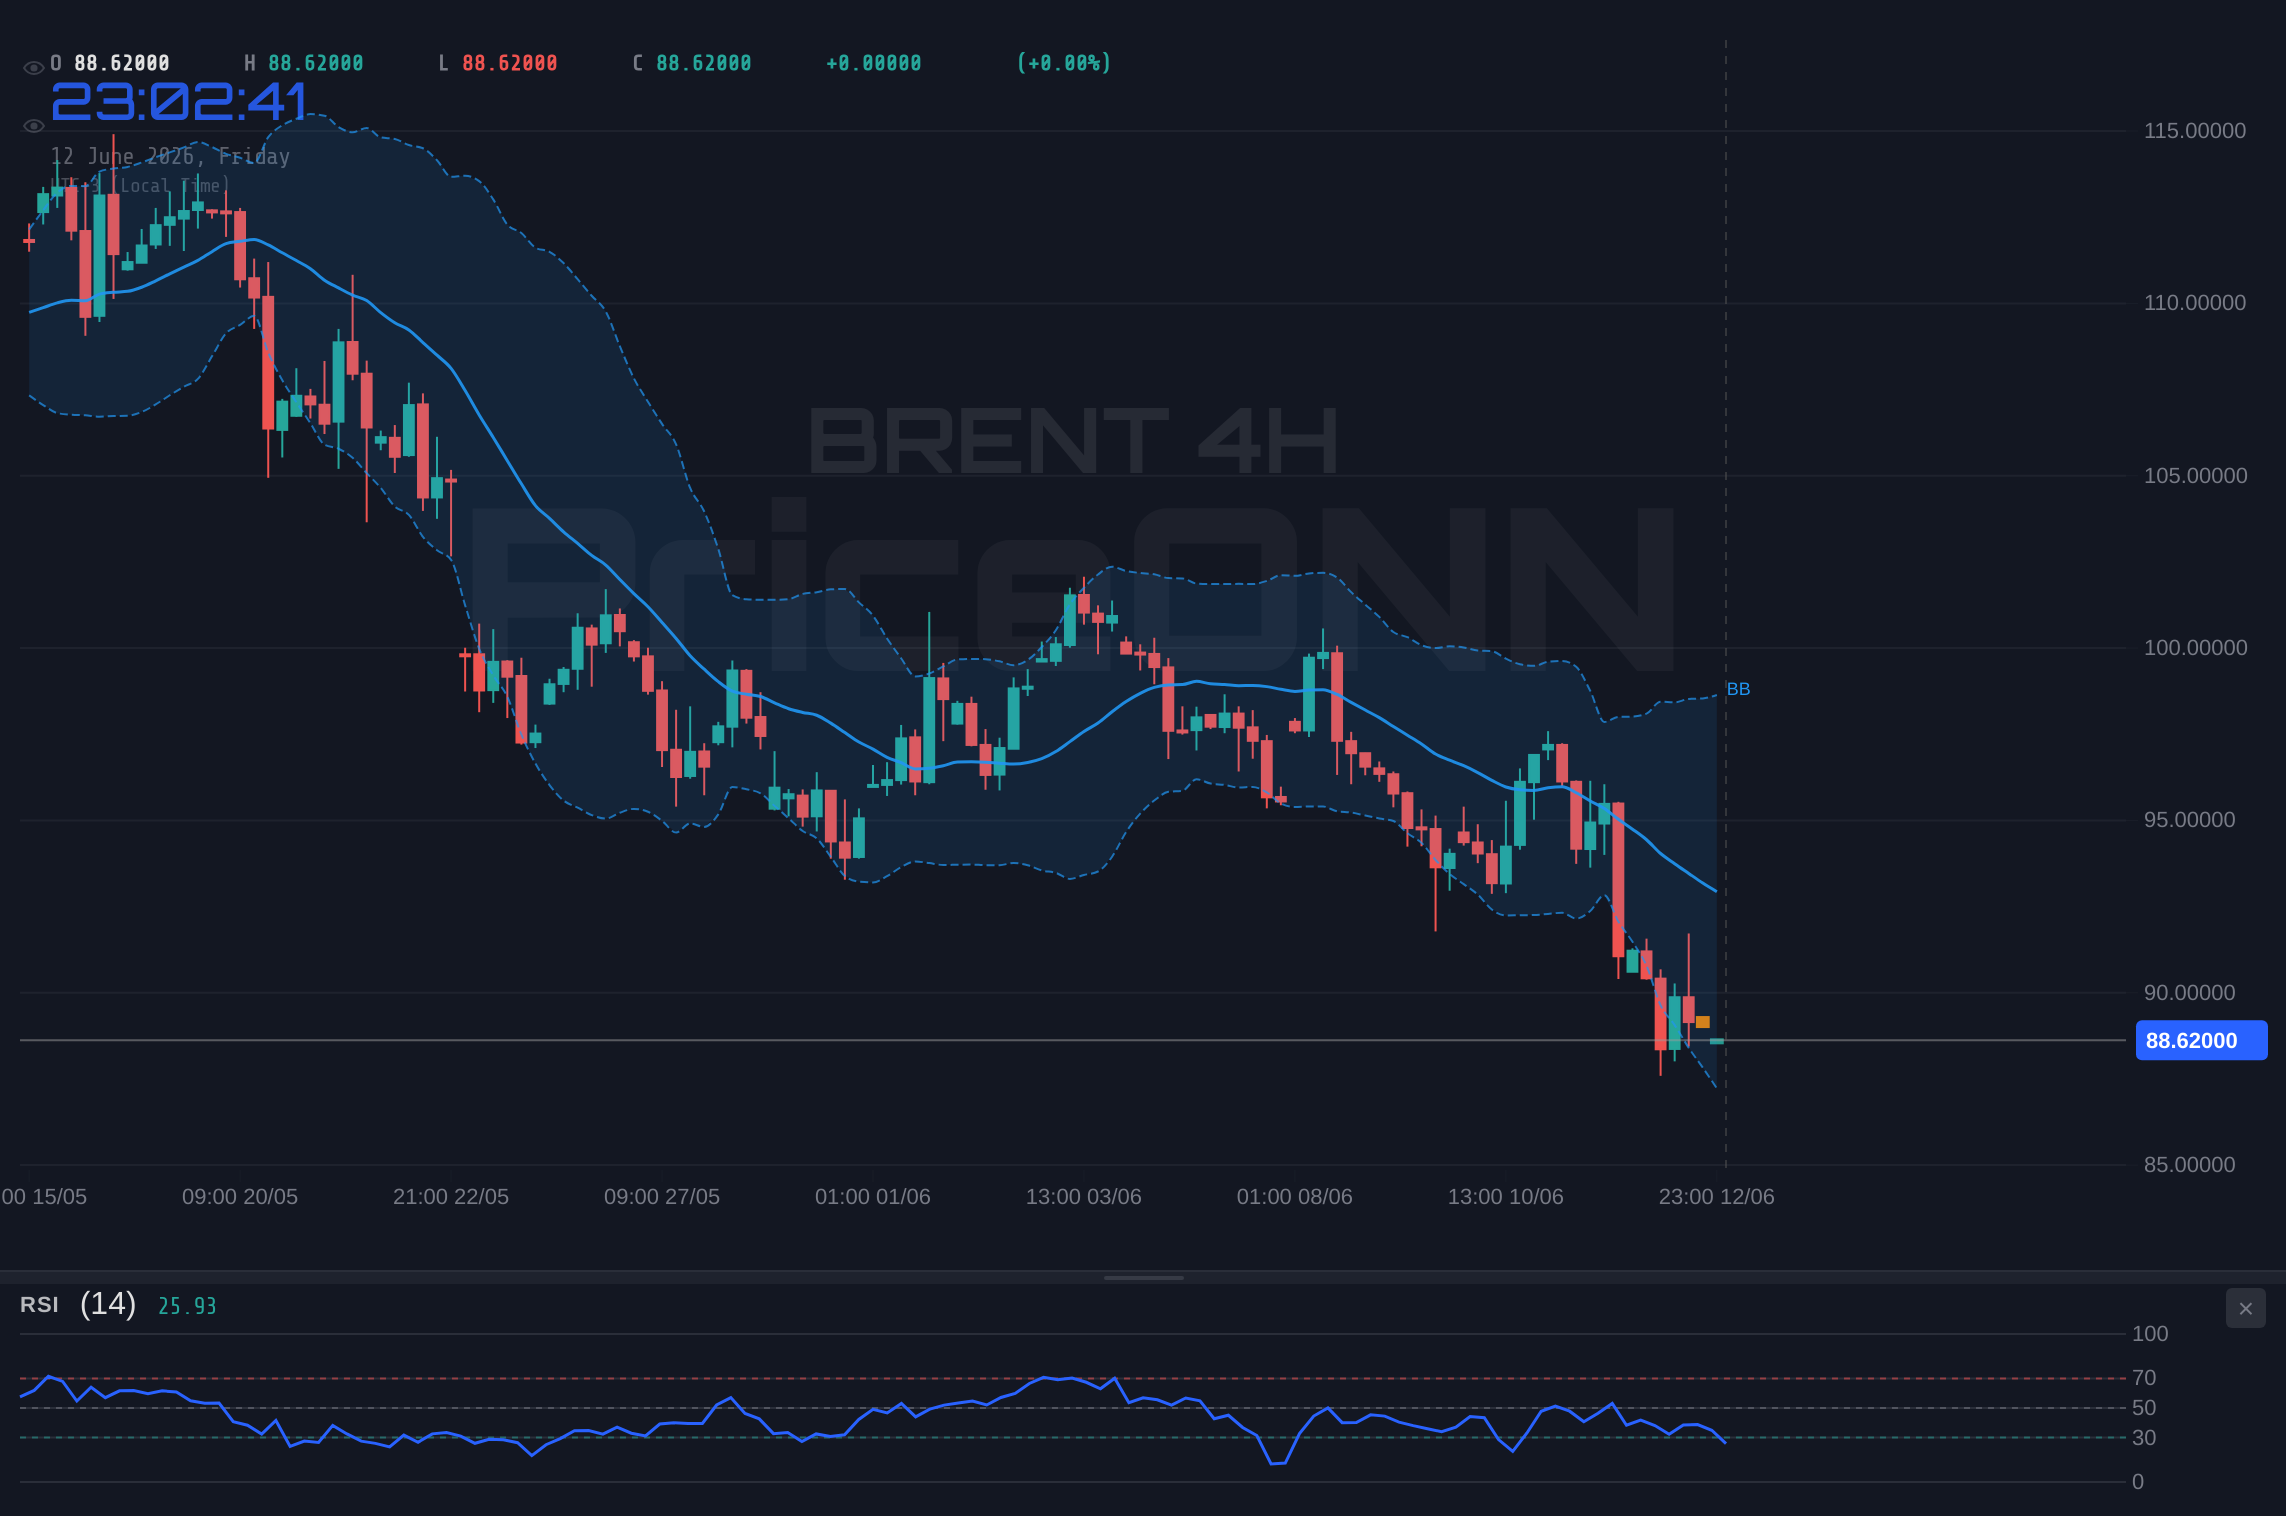
The 4-Hour Chart: Confirming the Downtrend
Drilling down into the 4-hour timeframe, the bearish sentiment is further reinforced, although with slightly more nuanced indicators. Here, the trend is also classified as 'Düşüş' (Downtrend) with a power of 90%. The RSI sits at 32.55, firmly in oversold territory but still trending downwards, suggesting that the selling momentum is significant and has further room to play out before any potential stabilization. The MACD continues to show negative momentum, with the MACD line below its signal line, reinforcing the bearish bias. The Stochastic Oscillator is deep in oversold territory at K=13.69 and D=18.6, a classic sign that the asset is oversold. However, as noted, this can persist in strong downtrends. The ADX at 25.26 indicates a strong downtrend, providing confluence with the RSI and MACD signals. The overall signal on the 4-hour chart is also a strong 'SELL' (1 Buy, 7 Sell, 0 Neutral), aligning perfectly with the daily outlook. This consistent bearish signal across different trading horizons suggests that short-term traders are also aligning with the prevailing downward pressure, potentially exacerbating the move. The confluence of these indicators indicates that the path of least resistance for Brent crude is currently downwards, driven by both fundamental shifts and technical breakdowns.
The 1-Hour Chart: A Glimmer of Neutrality Amidst the Storm
While the longer timeframes are screaming 'SELL', the 1-hour chart offers a slightly more neutral perspective, though still leaning bearish. The trend is categorized as 'Nötr' (Neutral) with only 50% power. The RSI here is at 36.87, also trending downwards but not yet in extreme oversold territory. The MACD shows positive momentum, with the MACD line above its signal line, which could be interpreted as a slight pause or potential for a short-term bounce. However, the Bollinger Bands are below the middle band, indicating downward pressure, and the Stochastic Oscillator is K=20.84, D=41.89, clearly showing a bearish signal as %K
Correlation Analysis: DXY, Equities, and the Oil Narrative
To fully grasp the forces at play, we must consider the broader market correlations. The US Dollar Index (DXY) is currently trading at 99.8, showing a slight upward trend. Historically, a strengthening dollar puts downward pressure on dollar-denominated commodities like oil, as they become more expensive for holders of other currencies. With the DXY showing resilience, this provides an additional headwind for Brent crude. The S&P 500 (SP500) is trading at 6572.87, showing a strong upward move of 0.74%. This suggests that risk appetite in the broader equity markets is relatively high, which might typically support oil prices. However, the sharp decline in oil prices despite a rising S&P 500 indicates that the specific news regarding the Hormuz peace deal is overriding broader market sentiment for now. This decoupling is significant. Normally, a risk-on environment would bolster oil prices, but the perceived reduction in geopolitical risk is proving to be a more potent force. The Nasdaq 100 (29632.03) and Dow Jones 30 (51192.5) are also showing strong gains, further highlighting the disconnect between equity markets and the energy sector's reaction to de-escalation news. This divergence emphasizes the power of the geopolitical narrative currently dominating the oil market.
The Fundamental Shift: From Scarcity to Abundance?
The core of this market move lies in a fundamental reassessment of supply and demand dynamics, heavily influenced by geopolitical perception. For a long time, the market has been operating under the assumption of potential supply scarcity due to tensions in the Middle East. This fear has been a significant factor in keeping oil prices elevated, even when other economic indicators might have suggested otherwise. The news of potential progress towards a US-Iran peace deal fundamentally alters this supply-side risk calculation. If tensions ease and the threat of disruption in the Strait of Hormuz diminishes, the market will likely shift its focus to other supply factors, such as OPEC+ production levels, global demand growth, and inventory data. The recent significant drop in Brent, from a high of $97.59 to $88.64, reflects this rapid repricing of geopolitical risk. It's a classic case of market sentiment shifting from fear of scarcity to a perceived move towards abundance, or at least, reduced risk. This fundamental shift is providing the fuel for the current technical sell-off. The question now is whether this optimism is sustainable or premature, and how quickly other fundamental supply-demand factors will reassert their influence.
Economic Calendar Watch: What's Next for Oil?
While the geopolitical news has been the primary catalyst, upcoming economic data will play a crucial role in shaping the near-term direction of Brent crude. The economic calendar shows several high-impact events, particularly for the US Dollar (USD) and the Euro (EUR). Releases such as US inflation data (actuals are missing from the provided data but historically significant) and the Federal Reserve's interest rate decisions are always key for commodity prices. A stronger-than-expected inflation reading could reignite fears of persistent price pressures, potentially leading central banks to maintain hawkish stances, which could, in turn, strengthen the dollar and pressure oil. Conversely, softer inflation or signs of economic cooling could lead to expectations of interest rate cuts, potentially weakening the dollar and offering some support to oil prices, although this would be counteracted by the current geopolitical narrative. For Europe, upcoming Eurozone data, especially inflation figures, will be closely watched. Any signs of persistent inflation might lead to further hawkish stances from the European Central Bank (ECB), impacting the EUR and indirectly influencing oil prices. The market's reaction to these data points will be crucial in determining whether the current bearish trend in oil is sustained or if other fundamental factors begin to reassert themselves.
The Infrastructure Perspective: Beyond the Headlines
As an expert in energy infrastructure, I always look beyond the immediate headlines. While the peace deal narrative is powerful, it's essential to consider the underlying production and transportation infrastructure. The Strait of Hormuz remains a critical transit point, and even with reduced tensions, any physical disruption would have immediate and severe consequences. Furthermore, the global oil market is complex, involving not just crude oil but also refined products. Refinery capacity, inventory levels at key storage hubs, and the operational status of pipelines and terminals all play a significant role. For instance, if refinery utilization rates remain high or increase, it could absorb some of the excess crude supply, potentially putting a floor under prices. Conversely, if global demand falters due to economic slowdowns, even a peaceful Hormuz would struggle to keep prices buoyant. The current price drop reflects a market heavily focused on the geopolitical supply risk, perhaps temporarily overshadowing other fundamental supply-demand balances and infrastructure constraints. It's a reminder that while sentiment can drive short-term moves, the physical realities of energy production and logistics ultimately dictate long-term price trends.
Trading Scenarios and Risk Management
Given the conflicting signals across timeframes and the significant geopolitical news, a cautious and scenario-based approach is paramount. The current technical setup, particularly on the daily and 4-hour charts, strongly favors a bearish outlook. However, the rapid price decline and the potential for geopolitical news to be fluid necessitate careful risk management.
Bearish Scenario: Downtrend Continuation
65% ProbabilityNeutral Scenario: Consolidation and Reassessment
25% ProbabilityBullish Scenario: Reversal on Renewed Geopolitical Fears
10% ProbabilityThe current technical setup, particularly the strong downtrend signals on the 4-hour and daily charts, makes the bearish scenario the most probable. The key trigger for this scenario would be a sustained break below the $88.50 support level, which has acted as a pivot point. Invalidation would occur if prices manage to decisively reclaim resistance levels, particularly above $89.90, suggesting that the market is shrugging off the bearish news. The neutral scenario involves a period of consolidation as the market awaits further confirmation or news, likely trading within the $88.50 to $89.20 range. A bullish reversal is currently the least probable scenario, requiring a significant shift back towards geopolitical tension or a fundamental supply shock to override the current narrative.
The geopolitical situation remains fluid. Any unexpected escalation or breakdown in diplomatic talks could rapidly reverse the current trend. Traders should maintain strict risk management protocols, utilizing stop-losses and position sizing appropriate to the heightened volatility. The current price of $88.64 reflects a significant repricing of risk, and further volatility should be expected.
The Path Forward: What Traders Should Watch
For traders and investors monitoring Brent crude, the immediate focus should be on the $88.50 support level. A decisive break below this point, supported by increasing volume and bearish technical indicators on shorter timeframes, would confirm the continuation of the downtrend. Conversely, any attempt to rally towards the $89.20-$89.90 resistance zone will be a crucial test. If these levels hold firm and price action turns lower, it would reinforce the bearish outlook. It's also vital to monitor news flow related to the US-Iran negotiations and any official statements from OPEC+. Any significant development on these fronts could trigger sharp price movements. From a technical standpoint, the ADX reading of 16.56 on the daily chart, despite other indicators suggesting a strong trend, implies that the market is still establishing its direction post-breakdown. A move towards higher ADX values would confirm a stronger trend, whether up or down. For now, the evidence points towards further downside pressure, with the $88.50 level acting as the immediate line in the sand.
Frequently Asked Questions: BRENT Analysis
What happens if BRENT breaks below the $88.50 support level?
If BRENT decisively breaks below $88.50, the bearish scenario gains significant probability. This would likely target the next support at $88.22, followed by $87.80. The momentum indicators suggest this move could be swift, driven by the current downtrend confirmed on the 4-hour and daily charts.
Is the RSI at 35.15 a sell signal for BRENT right now?
While the RSI at 35.15 is not in extreme oversold territory, its downward trajectory on the daily chart, coupled with negative MACD momentum, strongly supports a bearish outlook. It indicates sellers are in control and the trend is down, making it a signal to favor short positions or wait for potential bounces to sell into.
How will the potential Hormuz peace deal affect BRENT prices this week?
The perceived de-escalation in the Strait of Hormuz is the primary driver for the current price drop, removing a significant geopolitical risk premium. If diplomatic progress continues, it could exert further downward pressure on BRENT, potentially testing lower support levels. However, any setback in negotiations could reverse this sentiment rapidly.
Should I consider buying BRENT at current levels of $88.64 given the oversold Stochastic?
Buying at current levels of $88.64 is highly speculative given the strong bearish signals on daily and 4-hour charts, despite the oversold Stochastic on the daily. The ADX at 16.56 suggests the trend isn't fully established yet, meaning further downside is possible. A confirmed bullish reversal pattern or a break above key resistance would be needed for a more convincing long entry.
Track markets in real-time
AI-powered analysis, technical indicators and real-time price data.
Join Our Telegram Channel
Breaking market news, AI analysis and trading signals instantly.
Join Channel