The $90 psychological level that crude oil traders have been watching for weeks is now in the rearview mirror. WTI today analysis shows a clean 3.02% decline to $89.51, and the real question is not whether this breakdown happened - it is whether the market has fundamental conviction to push further south, or whether bears have overextended on a day when supply dynamics shifted faster than expected.
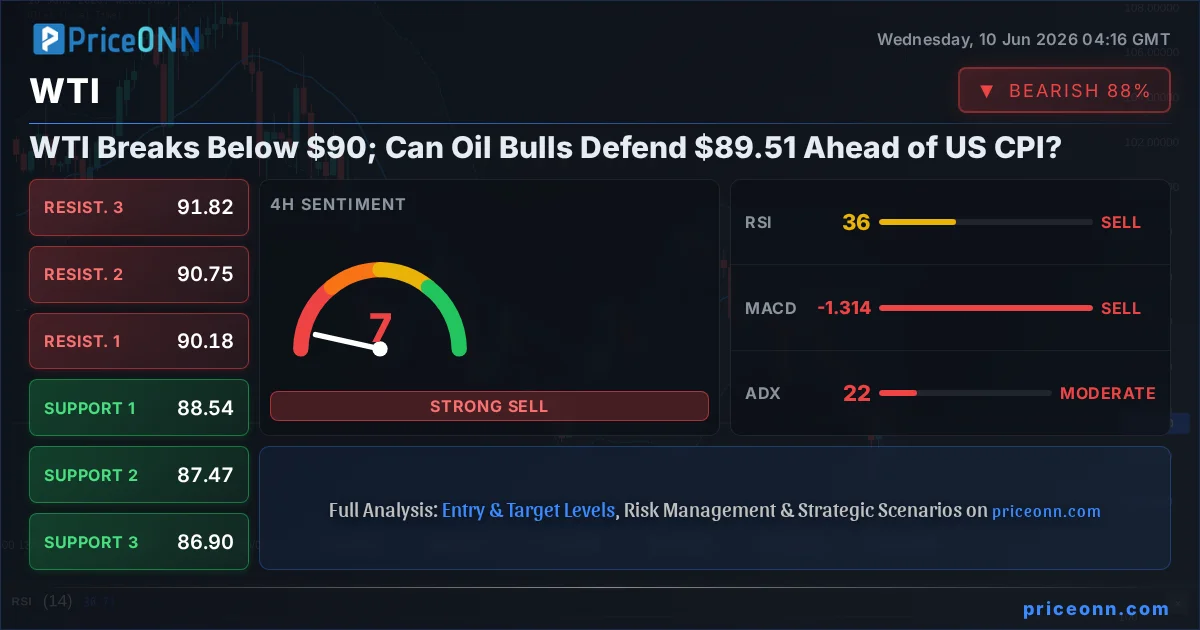
- WTI crude dropped 3.02% to $89.51, breaching the key $90 psychological support with strong bearish momentum confirmed across all major timeframes
- 4-hour ADX at 21.83 confirms medium-strength bearish trend; daily chart shows 7 sell signals with zero buy signals - rare cross-timeframe consensus that rarely appears without follow-through
- Kuwait offering first crude cargoes to Asia since the Iran war began removes a geopolitical scarcity premium that had been propping up oil prices above $90 for weeks
- Upcoming US CPI data is a binary risk event: a hot print above the previous 0.4% monthly reading would accelerate downside pressure toward critical $88.54 support
Time Horizon: This analysis covers the next 48-72 hours with reference to the broader weekly trend context.
Why the $90 Level Matters More Than Any Chart Level
The $90 handle is not just a round number on a screen. In energy markets, psychological benchmarks like this carry enormous weight because they are where institutional orders cluster, where options strikes concentrate, and where systematic trend-following funds flip their positioning models from long to flat or short. When WTI was trading above $92 earlier in today's session - the intraday high reached $92.45 - there was still a credible argument for bullish consolidation. That argument evaporated precisely when $90 gave way with volume behind it.
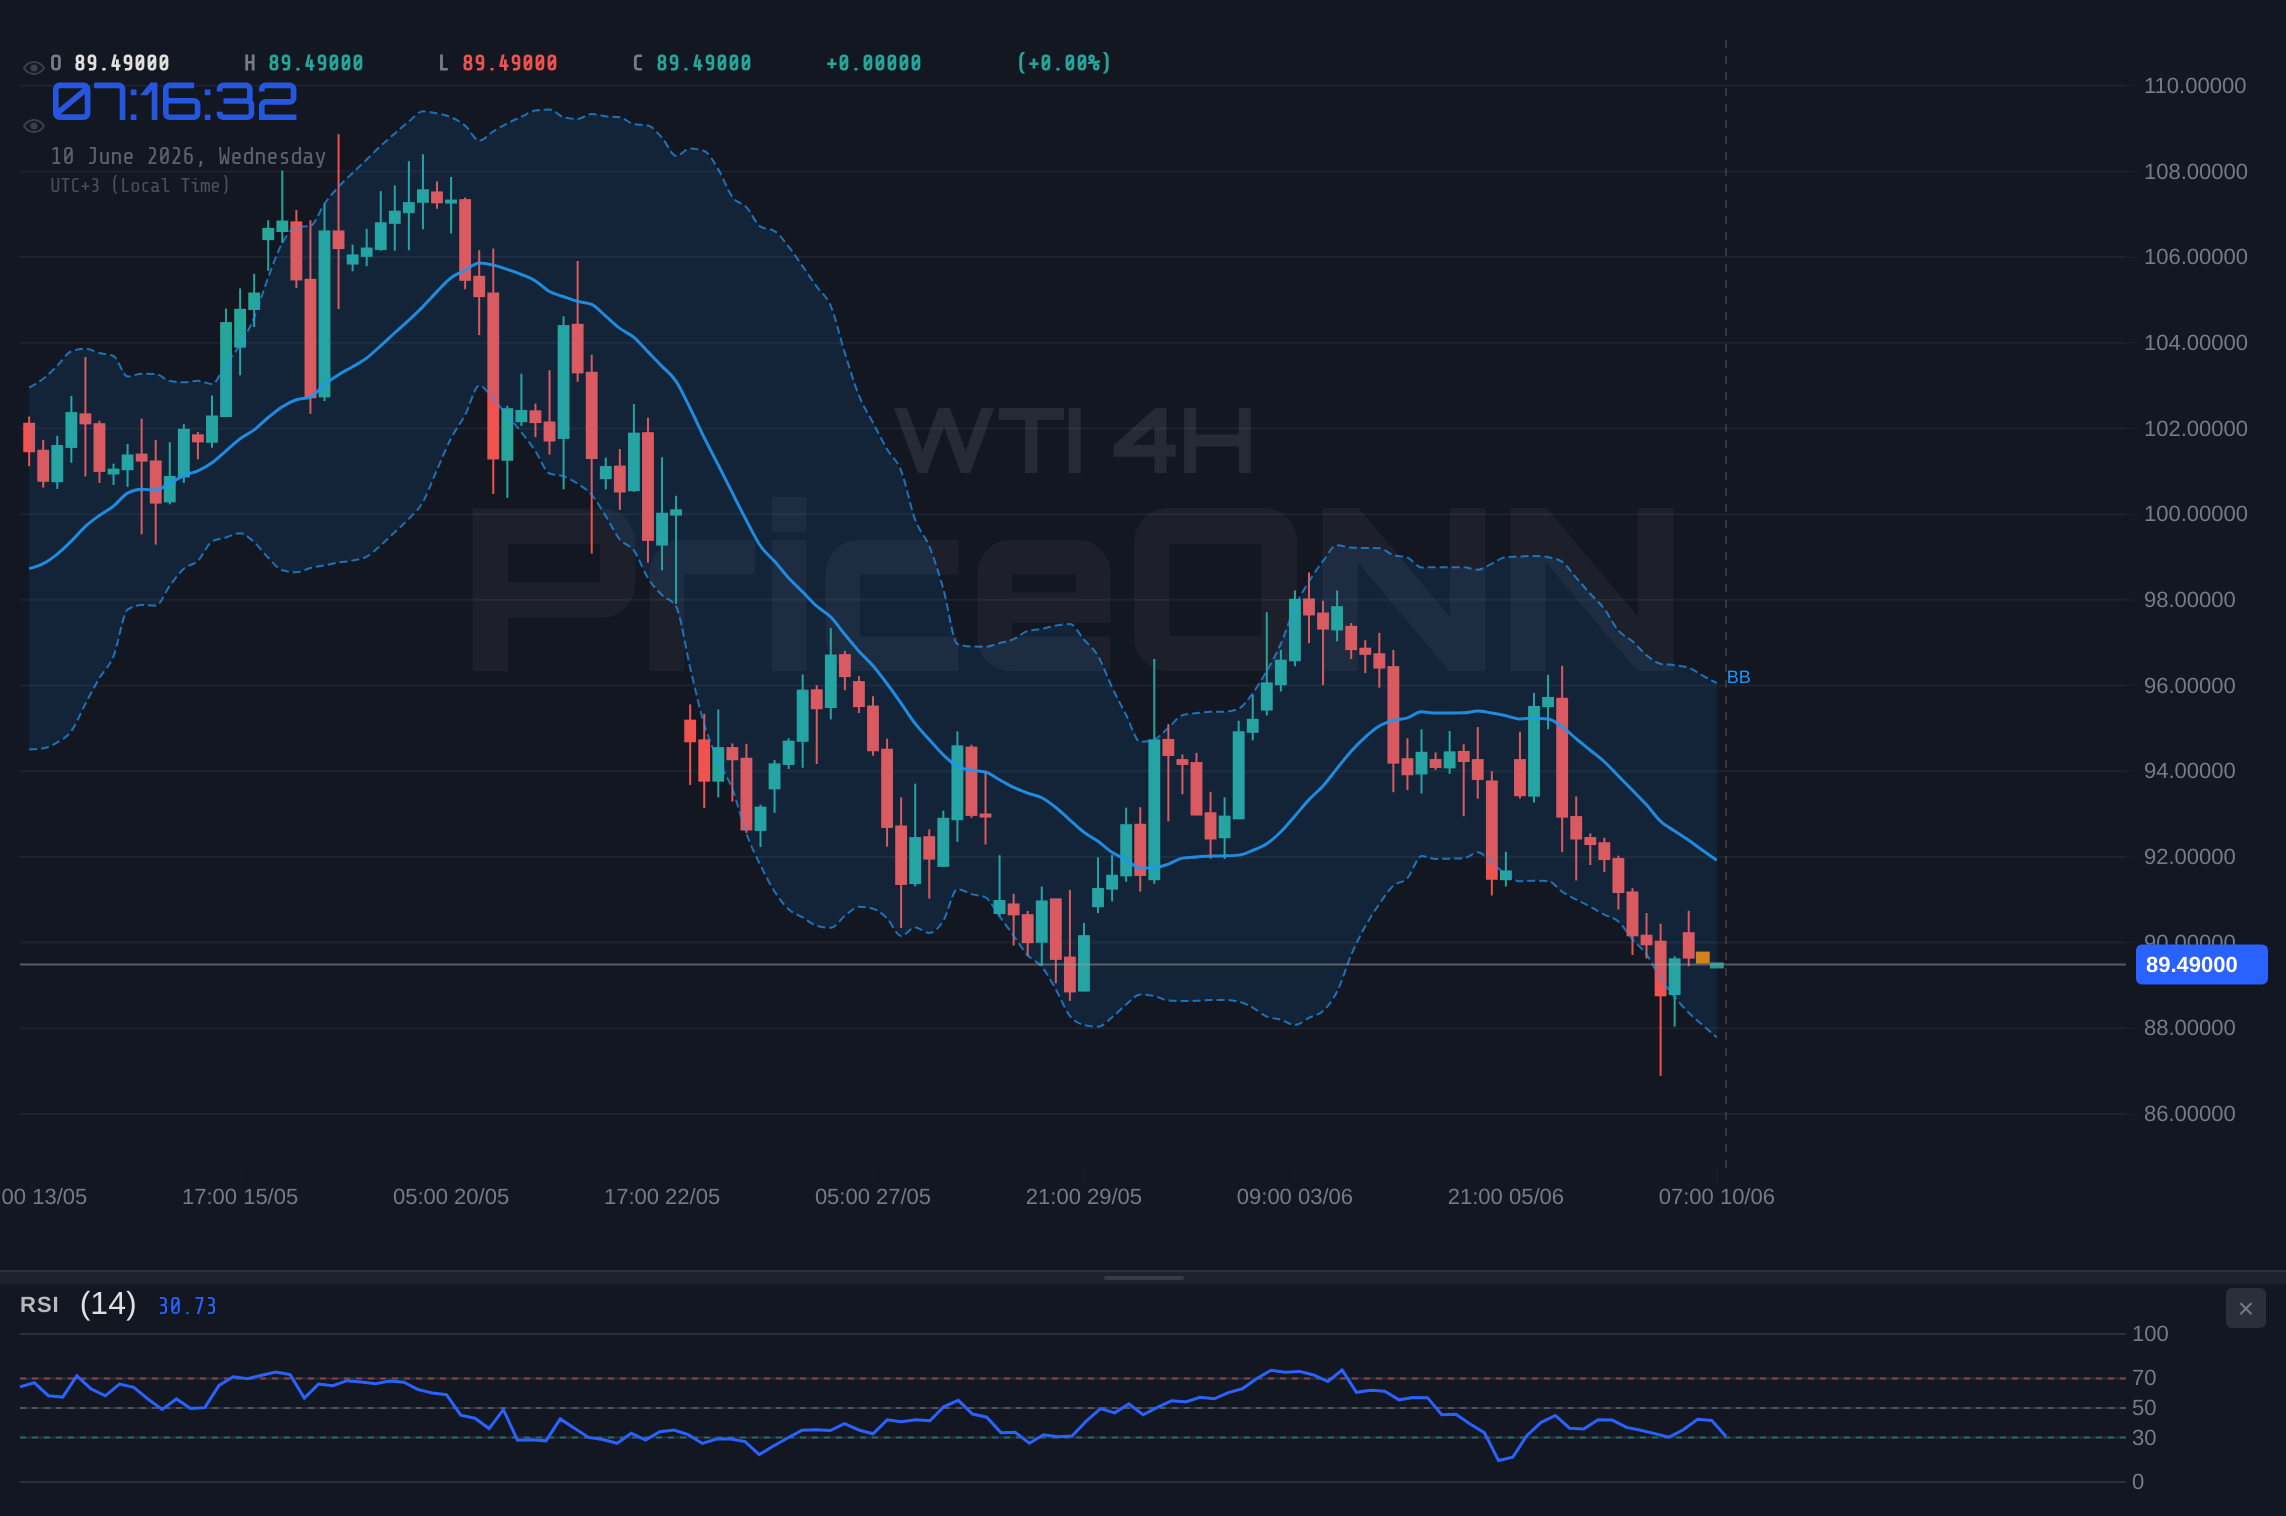
The WTI support and resistance picture has fundamentally shifted. The daily chart's first support, previously at $90.35, has now flipped to resistance. Reclaiming it is not just a technical exercise; it is the line between a normal pullback and a trending-lower regime. Without that recovery, the path of least resistance points toward $88.39 on the daily chart, and potentially toward $85.34 if broader macro headwinds intensify through the back half of the week.
The news catalyst driving today's move is specific and verifiable. Kuwait has begun offering its first crude cargoes to Asian buyers since the Iran war started - a significant development in the global oil supply chain. Kuwait had been diverting supply through alternative routes, artificially restricting available barrels to Asian markets. That diversion had been supporting a geopolitical scarcity premium embedded in WTI pricing for several weeks. With Kuwaiti barrels now flowing more freely toward Asia, that premium is evaporating in real time. Combine that with a dollar finding its footing at DXY 99.65, where the daily chart registers 8 buy signals and zero sell signals, and the environment for oil bulls is objectively unfriendly.
The Bull's Roadmap Back to $92
For WTI bulls, the playbook is straightforward but demanding. On the hourly chart, the first genuine recovery test sits at $90.13. That is the resistance level lost during today's slide, and a sustained close back above it - accompanied by genuine buying volume - would be the first credible sign that today's breakdown was a liquidity grab rather than a genuine trend reversal. Without it, every intraday bounce is simply a better entry point for sellers.
From there, the next hurdle is $90.18 on the 4-hour timeframe, which aligns tightly with the hourly level and creates a meaningful confluence zone. Bulls who push through that region target $90.50, then the more significant $90.75 on the 4-hour chart where broader resistance begins to cluster. Above that, $90.81 becomes the next ceiling before any realistic discussion of recovering to the $91 to $92 range. On the 4-hour chart, resistance extends to $91.82 as the upper structural level.
What makes the bullish case genuinely interesting right now - and this is where the multi-timeframe WTI trend analysis gets nuanced - is the 4-hour Stochastic reading. K at 29.42 has crossed above D at 14.81, generating a bullish crossover from deeply oversold territory. That signal does not override the broader bearish trend; the MACD histogram on the same timeframe remains in negative territory with the line firmly below the signal line. But when Stochastic generates a bullish cross from sub-20 levels while price is still falling, it often precedes at least a short-term bounce. RSI on the 4-hour sits at 35.91 - not yet in the zone that forces mechanical buyers in, but approaching it fast. A move toward 30 on the RSI while price tests $88.54 would create the confluence setup that contrarian buyers watch for.
The geopolitical wildcard cannot be dismissed either. The Strait of Hormuz situation that prompted Kuwait's supply rerouting in the first place remains fluid. If tensions escalate rather than de-escalate, risk premium returns to crude prices rapidly, and WTI market sentiment could flip from bearish to defensive safe-haven buying in a single headline cycle. Historically, when geopolitical supply disruption fear re-enters crude oil markets from an unexpected direction, the move higher can be sharp and disorderly - exactly the environment where short positions get squeezed hard and fast.
Where Bears Take Full Control
This is the higher-probability scenario, and the data supports that assessment with unusual clarity across multiple timeframes. The 4-hour trend strength sits at 91% bearish. That is not a market searching for direction; that is a market with clear institutional intent. The MACD histogram on the 4-hour is in negative territory with the line firmly below the signal. The daily chart registers RSI at 40.67, a complete 7-out-of-7 sell signal sweep, and zero buy signals across eight measured indicators. That kind of cross-timeframe consensus is rare in WTI trend analysis and rarely resolves in the bulls' favor without a significant catalyst shift.
The immediate bear trigger is a clean break below $89.14 on the hourly chart. Below that, $88.77 becomes the next test. These levels represent where systematic buying algorithms and stop-loss clusters from the previous consolidation zone sit. A coordinated push through both levels opens the door to the more structurally important 4-hour support at $88.54. This is the level that matters most for the intermediate-term picture. A daily close below $88.54 effectively invalidates any near-term bullish argument and signals that the bearish scenario is the primary path forward rather than a secondary risk.
Below $88.54, the bear case accelerates with fewer natural speed bumps. The next 4-hour support sits at $87.47, and below that, the session low area around $86.90 represents the lower bound of the 4-hour support cluster near today's intraday range floor of $86.89. On the daily chart, the support structure thins out considerably below $88.39. After that, the next meaningful cluster is around $85.34. That is a significant drop from current levels and is not the base case for the next 24 hours, but it represents the realistic measured move destination if the daily bearish trend - currently at 81% strength - gains additional momentum from macro catalysts this week.
The macro backdrop is reinforcing this bearish reading in a fundamental way. The US labor market report released last week came in far stronger than most models anticipated. Multiple financial news outlets reported the dollar's immediate and sustained strengthening response to those payroll numbers. A robust labor market means the Fed retains full justification to maintain or raise rates further. Higher rates for longer equals a stronger dollar, and a stronger dollar equals sustained, mechanistic pressure on dollar-denominated commodities. WTI does not operate in isolation from the DXY; at this stage of the macro cycle, the correlation is working directly against oil bulls.
A daily close below $88.54 removes the last near-term bullish argument and opens a measured move toward $85.34. This scenario becomes significantly more probable if Wednesday's CPI data prints above the previous 0.4% monthly reading, reinforcing the Fed rate hike narrative and pushing DXY above 100.
The Waiting Game; Consolidation While CPI Data Looms
Not every sharp move resolves cleanly into a sustained trend. There is a genuine case for WTI spending the next 48 to 72 hours in a $88.77 to $90.13 range, digesting today's 3% slide without immediately committing to the next directional leg. The 1-hour ADX at 26.05 reflects a fast-moving, potentially overdone short-term directional push. When ADX spikes this quickly on a downswing within a single session, mean-reversion consolidation sometimes follows rather than immediate continuation. The market ran stops below $90 and hit today's low of $86.89 before recovering to $89.51 - that bounce from the intraday low is not nothing.
For this neutral scenario to hold, WTI needs to maintain trade above the 1-hour support at $89.14 while failing to reclaim $90.13. A test of $88.77 that holds on a closing basis would also qualify as range-bound action rather than breakdown. The neutral scenario buys time for the market to process two key catalysts simultaneously: the incoming US CPI data and the evolving Kuwait-Asia supply story. Range-bound price action ahead of binary macro events is common and rational - it reflects genuine uncertainty about which direction the data will resolve.
Scenario Comparison
Bears Press the Break; Further Downside After $90 Collapse
55% ProbabilityStop Hunt and Snap Back; Bulls Reclaim the $90 Floor
25% ProbabilityWaiting for CPI; Oil Consolidates in the $88.77 to $90.13 Band
20% ProbabilityWhat Wednesday's US CPI Data Means for WTI Crude Prices
The upcoming US CPI release is the single most important scheduled catalyst for WTI this week, and it operates through a mechanism crude traders understand well. A print above the previous 0.4% monthly reading confirms sticky inflation, validates the case for further Federal Reserve rate hikes, pushes the dollar higher from its current DXY 99.65 level, and adds mechanistic downside pressure on crude through the dollar-commodity correlation. The previous annual reading of 3.8% gives market participants a reference point; anything materially above that level would accelerate the bearish scenario probability from 55% toward 70% or higher.
The contrarian case is equally specific. If CPI surprises meaningfully to the downside - suggesting that inflation is cooling faster than the Fed's models anticipated - the rate hike narrative loses momentum, dollar strength fades from the DXY 99.65 current level, and WTI gets a reflexive bid from commodity markets. A softer-than-expected CPI print could be precisely the external catalyst that validates the 4-hour Stochastic bullish crossover already forming and triggers the 25% probability recovery scenario. Multiple market observers, including analysis from CNBC and Reuters this week, noted that traders are actively taking profits ahead of this data release - suggesting the market is already positioning for a binary outcome rather than a clear directional move.
The BoJ rate decision context also matters at the margins. The JPY rate forecast at 0.5% creates a secondary risk event for global risk appetite. Any surprise shift in Bank of Japan policy affects carry trade dynamics broadly, which in turn influences risk asset positioning including energy commodities. The SP500 at 6572.87 - up 0.74% today but with MACD in negative territory on the daily chart and a trend strength reading of 100% bearish on the daily timeframe - signals that equities and oil are both operating with underlying fundamental fragility beneath today's surface calm.
WTI Breakout Watch; Three Levels That Resolve This Week
For traders monitoring WTI key levels in the current multi-scenario environment, three specific price points deserve daily attention above all others. These are not arbitrary levels; they are the structural boundaries that determine which of the three scenarios described above becomes the active path.
$90.18 is the minimum threshold for bulls to demonstrate they remain relevant. This is the 4-hour resistance that aligns with the critical zone lost during today's breakdown. Until WTI reclaims this level on a 4-hour closing basis, every intraday bounce is a potential short entry opportunity for trend-following strategies. The bullish scenario does not begin to develop credibility until this level is tested and holds as support rather than rejected as resistance.
$88.54 is the most important level in the bear scenario. This is the 4-hour structural support where significant positioning exists, and where a daily close below would signal that bearish momentum has genuine conviction rather than being a single-session stop hunt. If the upcoming CPI data triggers a dollar surge and WTI gaps below this level on the open, the measured move toward $87.47 and eventually $85.34 becomes the primary analytical framework rather than a tail risk.
$86.90 is the circuit breaker - the lower bound of the 4-hour support cluster near today's session low range of $86.89. If price reaches this level, the selloff has been severe enough that even technically committed bears would expect at least a temporary pause or reflexive reversal, if only from short-covering. This level represents the outer boundary of the current analytical framework.
The Brent-WTI spread at approximately $4.62 (Brent at $94.13 versus WTI at $89.51) is an additional indicator worth tracking through the week. If the spread widens further, it signals that WTI is facing domestic US demand headwinds specific to American oil markets rather than a global crude complex breakdown. If Brent falls below its own 4-hour support at $93.27, that would signal the global crude market is in a more serious structural downturn, not US-specific weakness - a distinction that changes the probability weighting across the three scenarios meaningfully.
| Indicator | Value | Signal | Interpretation |
|---|---|---|---|
| RSI (14) - 1H | 42.79 | Bearish | Below 50 midline, downward pressure sustained |
| RSI (14) - 4H | 35.91 | Bearish | Approaching oversold, bears still in control |
| RSI (14) - 1D | 40.67 | Bearish | Neutral-bearish zone, room for further decline |
| Stochastic - 4H | K=29.42 / D=14.81 | Watch | Bullish crossover from oversold - caution flag for shorts |
| MACD - 4H | Negative | Bearish | Below signal line, momentum remains with sellers |
| ADX - 4H | 21.83 | Medium Trend | Medium-strength bearish trend with building conviction |
| ADX - 1H | 26.05 | Strong | Fast directional move, may precede consolidation phase |
| Bollinger - 4H | Below Midband | Bearish | Price below middle band confirms bearish positioning |
Frequently Asked Questions: WTI Analysis
What happens to WTI crude if price breaks below the $88.54 support level?
A daily close below $88.54 - the critical 4-hour structural support - removes the last near-term bullish argument and opens a measured move toward $87.47 as the next meaningful support level. If $87.47 fails to hold with volume, the next floor sits at the $86.90 support cluster, near today's session low of $86.89. This breakdown scenario carries approximately 55% probability given current bearish multi-timeframe alignment with 7-of-7 sell signals on the daily chart.
Is the 4-hour Stochastic bullish crossover a reliable buy signal for WTI at $89.51?
The 4-hour Stochastic bullish crossover (K=29.42 crossing above D=14.81) from deeply oversold territory is notable but should not be read as a standalone entry signal given the broader bearish context. With MACD still in negative territory on the same timeframe and 4-hour trend strength at 91% bearish, the Stochastic crossover is better interpreted as a caution flag for aggressive shorts rather than a green light for buyers. Confirmation above $90.18 resistance is required before the bullish recovery scenario becomes credible as a primary trade thesis.
How will the upcoming US CPI data affect WTI crude oil prices this week?
The US CPI release is the most important scheduled catalyst for WTI this week. A reading above the previous 0.4% monthly level would reinforce Fed rate hike expectations, push the dollar higher from DXY 99.65, and add direct downside pressure on WTI toward the $88.39 to $88.54 support zone. A softer-than-expected reading could weaken the dollar, provide external validation for the 4-hour Stochastic bullish crossover, and trigger a recovery attempt toward the $90.18 to $90.75 resistance band. The data represents a genuine binary risk event with meaningful price impact in either direction.
Why did Kuwait's crude cargo announcement contribute to WTI falling below $90?
Kuwait offering its first crude cargoes to Asian buyers since the Iran war began removes a geopolitical scarcity premium that had been embedded in WTI pricing for several weeks. Previously, Gulf supply route disruptions kept available crude constrained and supported a risk premium above $90. With Kuwaiti barrels now flowing more freely toward Asian markets, the supply-side justification for that premium has materially weakened. This is a structural supply shift rather than a temporary headline, which is why the market's reaction at $89.51 has been decisive rather than reactive and short-lived.
Track markets in real-time
AI-powered analysis, technical indicators and real-time price data.
Join Our Telegram Channel
Breaking market news, AI analysis and trading signals instantly.
Join Channel