The oil market is at a pivotal moment, with WTI crude facing significant pressure as it tests levels around $86.96. The sharp decline from recent highs, marked by a substantial daily drop, signals a potential shift in sentiment. This isn't just about price action; it's a complex interplay of macroeconomic forces, geopolitical undercurrents, and evolving supply-demand dynamics that traders must decipher. As an expert witness specializing in energy infrastructure and industrial systems, I see these price movements not in isolation, but as symptoms of deeper structural shifts. The current technical setup, with key support levels at $89.66 and resistance looming at $94.13, provides a framework, but understanding the 'why' behind these levels is paramount for any serious market participant.
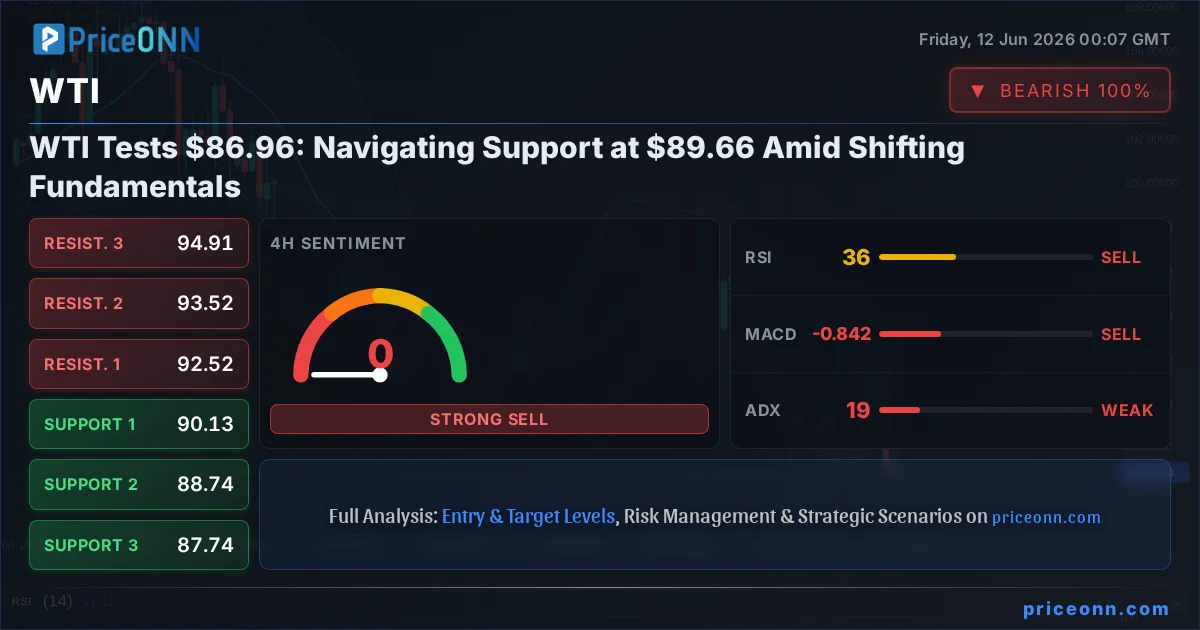
- WTI crude oil is trading near $86.96, showing significant downward momentum.
- Critical support is identified at $89.66, with resistance strong at $94.13.
- The ADX at 25.57 indicates a strong downtrend on the 1H chart, suggesting further downside may be favored.
- Inflation data and central bank policy shifts are the primary macro drivers influencing WTI's correlation with the DXY.
- Traders should watch for confirmation below $86.44 to target further lows, or a reclaim of $87.77 to signal a potential short-term bounce.
The Shifting Sands of Oil Demand
The recent sharp decline in WTI, pushing it towards the $86.96 mark, is not an isolated event but a reflection of broader macroeconomic trends and a potential recalibration of global demand expectations. While the daily change shows a significant drop of -6.13%, translating to $5.68, the underlying narrative is one of shifting fundamentals. The daily range, from $86.44 to $94.29, illustrates the volatility, but the downward trajectory is becoming increasingly pronounced. This move is happening even as the Dollar Index (DXY) shows signs of weakening, which typically correlates positively with oil prices. The fact that WTI is falling despite a softer dollar suggests that bearish fundamental factors are currently outweighing currency influences.
Understanding the infrastructure that underpins oil supply is crucial here. While production capacity might remain robust, the actual *demand* side is facing headwinds. Economic growth forecasts are being revised downwards in several key economies, and the specter of inflation, while still present, is being met with increasingly hawkish central bank rhetoric. This creates a dual pressure: slowing economic activity dampens energy consumption, while higher interest rates make financing more expensive and can further constrict growth. The market is clearly pricing in these risks, leading to the current bearish sentiment surrounding WTI. The ADX on the 1H timeframe at 25.57 confirms a strong downtrend, signaling that momentum is firmly with the sellers.
Inflation, Interest Rates, and the Dollar's Dance
The interplay between inflation data, central bank policy, and the Dollar Index (DXY) is a critical lens through which to view WTI's current predicament. With the DXY currently trading around 99.46 and showing a downward trend on the 1H chart, one would expect commodities like oil to find support. However, WTI is bucking this trend, falling by 6.13% on the day and trading near $86.96. This divergence is telling. It suggests that the market is more concerned with anticipated interest rate hikes by major central banks, particularly the US Federal Reserve, than with the immediate strength or weakness of the dollar. Hawkish central bank policy, aimed at taming inflation, inherently cools economic activity and, by extension, energy demand.
The recent CPI data, showing headline inflation climbing to a three-year high in May at 0.5% m/m, reinforces the narrative that inflationary pressures are persistent. While this might typically support oil prices as a hedge against inflation, the market's reaction is demonstrating a greater sensitivity to the *response* to inflation rather than inflation itself. Higher interest rates make holding commodities more expensive and can reduce corporate investment and consumer spending, both of which are vital for oil demand. The Stochastic indicator on the 1H chart showing K=14.51 and D=26.65, firmly in oversold territory, hints at potential short-term technical bounces, but the underlying fundamental picture remains bearish.
The Euro's Crossroads: A Bellwether for Global Demand?
The Euro's current position, trading around 1.15702, is particularly noteworthy in the context of WTI's price action. The Eurozone is a significant consumer of energy, and any signs of economic weakness or policy shifts there can have a ripple effect on global oil markets. The recent news indicating that the Euro is stabilizing after a sell-off, while awaiting US CPI and Bank of Canada meetings, highlights the interconnectedness of global financial markets. The fact that the Euro is showing signs of recovery, despite the strong US employment report and persistent inflation concerns, suggests a complex market sentiment. The ECB's stance on inflation and interest rates will be crucial in determining the Euro's trajectory, and consequently, its impact on oil demand.
If the ECB, like the Fed, adopts a more hawkish stance to combat inflation, it could dampen demand across Europe, adding further pressure to WTI. Conversely, if the ECB signals a more dovish approach or a pause in rate hikes, it might provide some relief to economic activity and energy consumption. The RSI(14) on the 1H timeframe for WTI at 31.39 is deep in oversold territory, but this does not automatically signal a buy. It simply indicates that selling pressure has been intense. The ADX at 23.99 suggests a moderately strong downtrend is in play, meaning that any bounces are likely to be short-lived unless fundamental conditions dramatically improve.
Geopolitical Undercurrents and Supply-Side Risks
While the current focus for WTI seems to be on the demand side, geopolitical risks and supply-side factors cannot be ignored. Recent news regarding escalating tensions between the US and Iran, while potentially bullish for oil prices due to supply disruption fears, appears to be overshadowed by macroeconomic concerns at present. However, the market is notoriously sensitive to geopolitical events, and any escalation could quickly shift the narrative. Historically, periods of heightened geopolitical tension in the Middle East have led to significant price spikes, as traders price in the risk of supply disruptions. The current resilience of WTI despite these tensions might indicate that the market believes current supply buffers are sufficient, or that the demand-side fears are simply more dominant.
The fact that oil prices are gaining slightly in commodity markets while gold edges lower amid these US-Iran escalations, as reported by RTTNews, is an interesting divergence. It suggests that while gold may be reacting to broader risk sentiment, oil might be more directly influenced by specific supply-side risk premiums or, conversely, by the overall bearish macro environment affecting all risk assets. From an infrastructure perspective, any disruption to shipping lanes or production facilities in the Persian Gulf would have an immediate and severe impact. However, for now, the market seems to be treating these geopolitical risks as background noise rather than an immediate price driver, a situation that could change rapidly.
What the Technicals Tell Us: A Bearish Lean
The technical indicators for WTI, particularly on the shorter timeframes, paint a decidedly bearish picture. On the 1H chart, WTI is trading at $86.96, well below its key resistance levels and approaching critical support. The ADX at 25.57 confirms a strong downtrend, and the RSI(14) at 31.39 is deeply oversold, indicating sustained selling pressure. The MACD is negative, and the Stochastic oscillator (K=14.51, D=26.65) is signaling further downside, currently in oversold territory but with %K below %D, reinforcing the bearish momentum. The Bollinger Bands are showing the price trading below the lower band, a sign of extreme bearishness that could lead to a short-term reversion, but not necessarily a trend reversal.
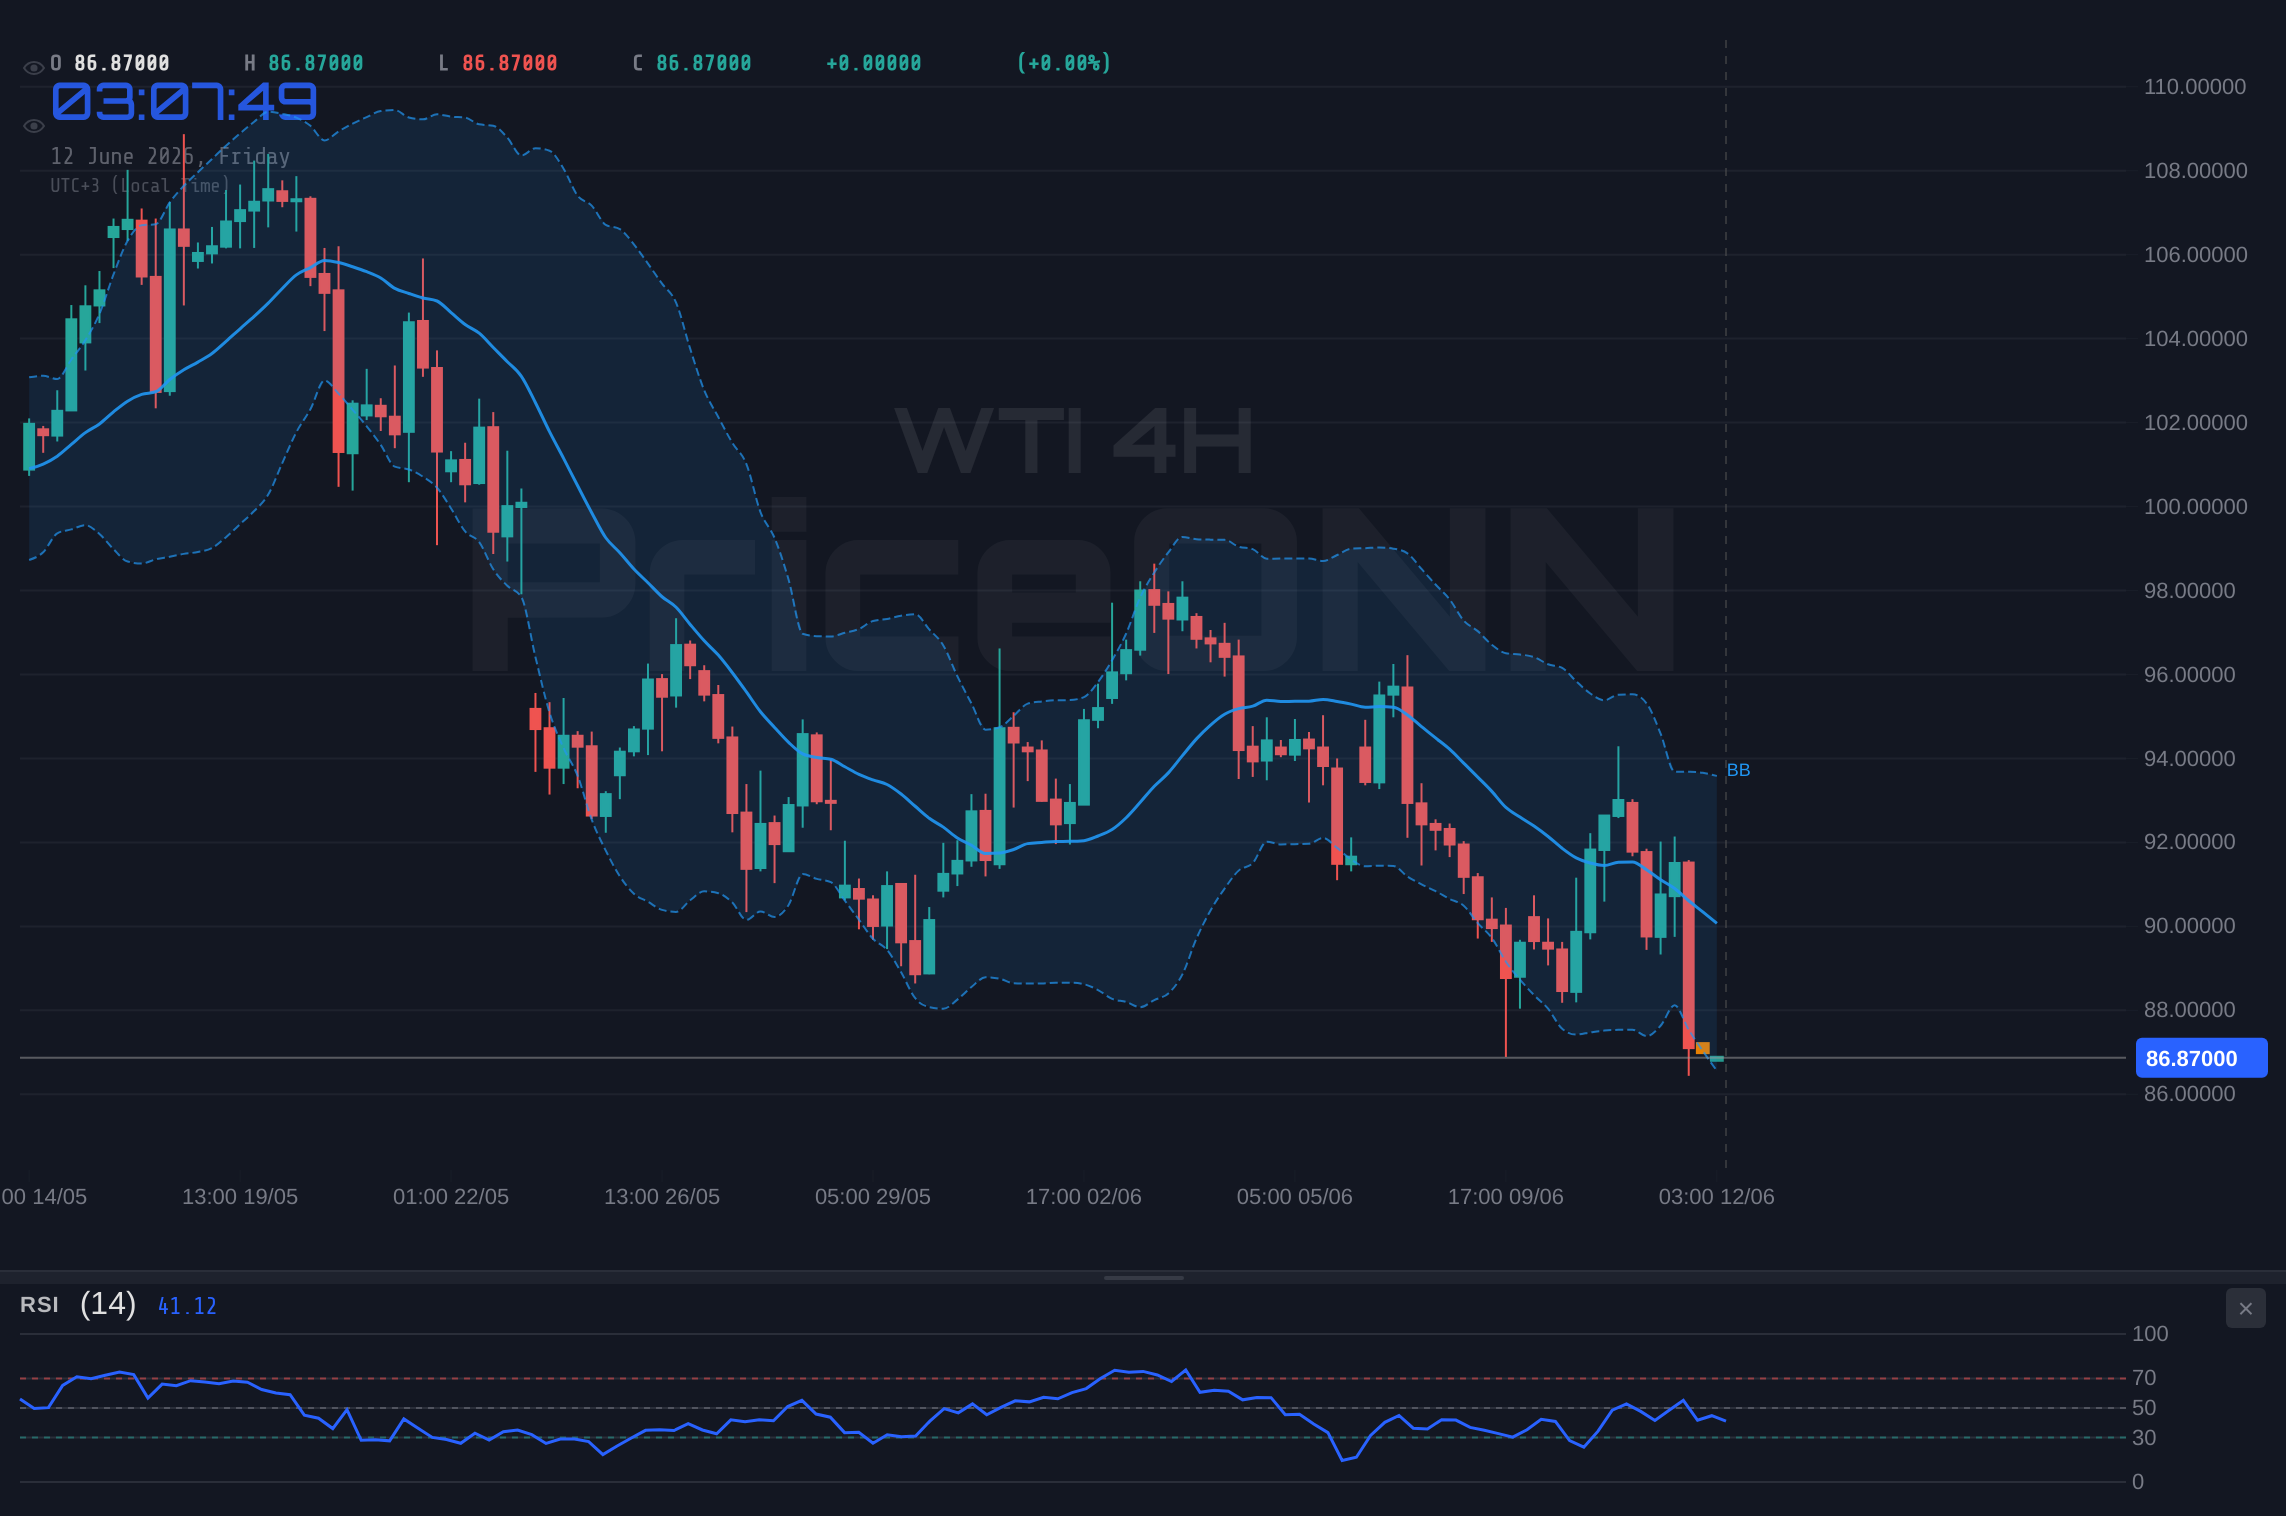
Looking at the 4H timeframe, the picture remains predominantly bearish, though with some conflicting signals. The ADX at 22.68 suggests a moderately strong downtrend. The RSI(14) at 33.97 is still oversold, and the Stochastic (K=35.88, D=61.79) indicates a bearish crossover and further downside potential. However, the MACD shows positive momentum, which is a conflicting signal. The Bollinger Bands are again showing the price below the lower band. This divergence on the 4H chart, particularly the MACD's positive momentum against the prevailing bearish trend indicators, might suggest that the aggressive selling seen on the 1H chart could lead to a temporary oversold bounce. However, the overall trend strength indicated by the ADX remains a concern.
The daily chart presents the most concerning outlook for WTI bulls. The ADX at 16.28 indicates a weak trend, which might seem contradictory to the strong downtrends on shorter timeframes. However, this often signifies a period of consolidation or a lack of strong directional conviction *over the long term*, even if shorter-term trends are active. The RSI(14) at 37.27, while not oversold, is firmly in bearish territory, and the MACD shows negative momentum below the signal line. The Stochastic (K=25.62, D=36.58) is also signaling further downside. The Bollinger Bands are below the middle band, reinforcing the bearish bias. The most significant support level on the daily chart is at $94.21, followed by $91.53 and $90.18. Resistance is clear at $98.24, $99.59, and $102.27.
The Critical Juncture: Support at $89.66, Resistance at $94.13
The current price action around $86.96 places WTI in a precarious position, directly testing the psychological and technical significance of the $86.44 level. The immediate support zone, as indicated by the 1H data, starts at $85.91, moving to $85.33 and $84.98. However, the more significant daily support levels are at $94.21, $91.53, and crucially, $90.18. Given the current trajectory, the market appears to be heading towards the $90.18 level. If this key support fails, the next major level to watch would be significantly lower, potentially revisiting levels not seen since earlier in the year. The strength of the downtrend, as confirmed by the ADX on shorter timeframes, suggests that breaking these support levels is a distinct possibility.
On the resistance side, the immediate hurdle on the 1H chart is $86.84, followed by $87.19 and $87.77. These are relatively weak levels in the context of the current sell-off. The more substantial resistance area lies between $94.13 and $94.21 on the daily chart, followed by $98.24 and $99.59. For a bullish reversal to even be considered, WTI would need to decisively break and hold above the $87.77 level on the 1H chart, and more importantly, reclaim the $90.18 daily support level, turning it into a new floor. Until then, the path of least resistance remains downwards. The recent news about US CPI climbing to a three-year high reinforces the macro concerns that are likely driving this bearish sentiment in oil.
Navigating the Volatility: A Trader's Perspective
For traders, the current environment presents a challenging landscape. The strong downtrend on the 1H chart, with an ADX of 25.57, suggests that shorting rallies might be the prevailing strategy. However, the oversold conditions indicated by RSI (31.39) and Stochastic (K=14.51, D=26.65) on the same timeframe signal that aggressive shorting could be risky without proper risk management. A potential strategy could involve waiting for a minor bounce towards the $87.77 resistance level on the 1H chart, and if it fails to break higher, looking for an entry to short towards the $89.66 support, with a tight stop-loss above the bounce high. This strategy acknowledges the prevailing downtrend while attempting to capture a short-term reversion.
Alternatively, a more conservative approach would be to wait for WTI to approach the $89.66 support level. If this level holds, and we see signs of accumulation or a bullish divergence on indicators like the RSI or MACD on the 4H chart, it could present a longer-term buying opportunity. However, given the strong daily downtrend signals, this would be a counter-trend trade and would require very strict risk management. The key is to avoid simply chasing the price. Patience looks like it will be rewarded here. Waiting for confirmation at key levels - either a breakdown below $89.66 or a sustained reclaim above $90.18 - will be crucial for defining a clearer directional bias.
The broader market context, including the performance of the DXY and equity indices like the SP500 and Nasdaq, should not be ignored. If the DXY were to find strong footing and resume its upward trend, it would likely add further pressure on WTI. Conversely, a significant risk-off event in equities could also drive investors towards safe havens, potentially weakening oil demand expectations. The current data shows WTI falling despite a weaker DXY, suggesting that demand-side concerns are paramount. The fact that Brent crude also saw a significant drop (-6.08%) reinforces the broad-based bearish sentiment across energy markets, indicating this is not an isolated WTI phenomenon.
Looking Ahead: Key Catalysts for WTI
The path forward for WTI will likely be dictated by a confluence of macroeconomic data releases and potential geopolitical developments. Upcoming inflation data releases, particularly from the US and Europe, will be critical. If inflation proves more persistent than expected, central banks may be forced into more aggressive tightening cycles, which would further dampen global growth and oil demand. Conversely, any signs of inflation cooling could lead to a less hawkish central bank stance, potentially providing some relief to commodity markets.
Geopolitical tensions, particularly in the Middle East, remain a wildcard. While currently overshadowed by macro concerns, any significant escalation could quickly inject a substantial risk premium back into oil prices. Investors and traders must remain vigilant, monitoring news flow for any developments that could impact supply security. From an infrastructure standpoint, any threat to major production facilities or shipping routes could trigger a rapid price surge, irrespective of demand-side pressures. The market's current reaction, however, suggests that the demand narrative is dominant.
Bearish Scenario: Downside Momentum Continues
70% ProbabilityNeutral Scenario: Range-Bound Consolidation
20% ProbabilityBullish Scenario: Short-Term Reversal Attempt
10% ProbabilityFrequently Asked Questions: WTI Analysis
What happens if WTI breaks below the $86.44 support level?
A break below $86.44, especially with strong momentum confirmed by the ADX at 25.57, would likely trigger further selling pressure. The next immediate targets would be $85.33 and potentially $84.98, as market participants reassess demand expectations in light of macroeconomic headwinds.
Is the RSI at 31.39 a buy signal for WTI right now?
While an RSI of 31.39 is considered oversold, it is not an automatic buy signal in a strong downtrend. It indicates intense selling pressure but suggests that a short-term bounce is possible rather than a trend reversal. Confirmation from MACD and Stochastic, along with price action holding above immediate support, would be needed for a sustained upward move.
How will upcoming US inflation data affect WTI's price action this week?
If US inflation remains high or rises further, it could prompt more aggressive interest rate hikes from the Fed. This would likely strengthen the DXY and dampen global growth prospects, adding downward pressure on WTI towards $89.66 and potentially lower. Conversely, cooling inflation could offer some relief.
Should traders look to buy WTI at current levels around $86.96?
Buying at current levels around $86.96 is a high-risk strategy given the strong bearish signals and the proximity to the $86.44 support. A more prudent approach would be to wait for a clear confirmation of a bounce, perhaps on a reclaim of $87.77, or wait for a more significant test of the $89.66 support level for a potential longer-term entry, managing risk tightly.
Track markets in real-time
AI-powered analysis, technical indicators and real-time price data.
Join Our Telegram Channel
Breaking market news, AI analysis and trading signals instantly.
Join Channel