The tug-of-war in the oil markets continues, with Brent crude futures currently testing critical support levels around $91.64. This pivotal juncture is drawing intense scrutiny from traders and analysts alike, as a confluence of macroeconomic shifts, geopolitical undercurrents, and evolving central bank policies creates a complex backdrop. Understanding the interplay between these forces is paramount for navigating the volatile landscape of energy commodities.
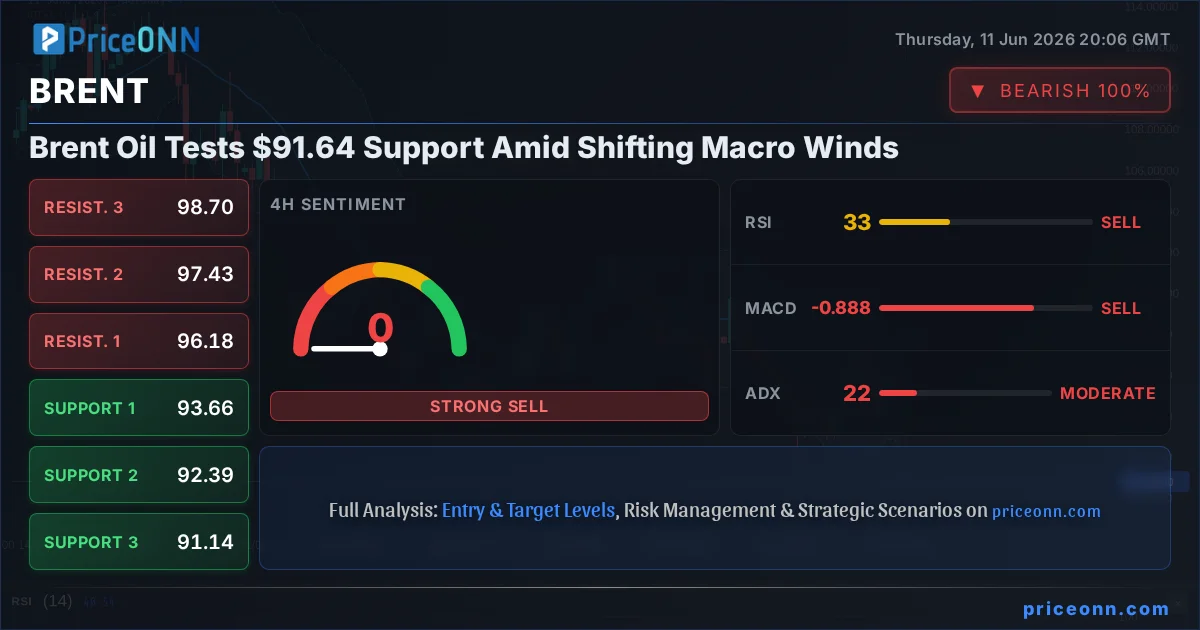
- Brent crude faces significant pressure near the $91.64 support level, with the 1-hour chart showing a neutral trend (ADX 23.01).
- The 1-day chart paints a bearish picture with RSI at 35.51 and ADX at 15.85, suggesting potential for further downside if support fails.
- Key resistance is eyed at $93.07 and $93.66, while immediate support holds at $91.64 and $91.28.
- Shifting DXY levels and upcoming inflation data are crucial catalysts that could dictate Brent's next directional move.
The current price action for Brent, hovering around $90.80, reflects a market grappling with conflicting signals. On one hand, the specter of persistent inflation and the potential for continued hawkish stances from major central banks could, in theory, dampen global demand for energy. On the other hand, ongoing geopolitical tensions, particularly in the Middle East, continue to provide a floor under prices, acting as a constant reminder of potential supply disruptions. This delicate balance is creating a choppy trading environment, where significant price swings can occur on even minor shifts in sentiment or data.
The Bullish Case: Geopolitical Tensions and Supply Scarcity
Despite the recent pullback, a compelling argument can be made for a bullish outlook on Brent crude. The primary driver remains the persistent threat of supply chain disruptions stemming from geopolitical flashpoints. While the provided data doesn't detail specific geopolitical events beyond general context, the historical precedent is clear: instability in major oil-producing regions invariably leads to price spikes. The fact that the 1-hour chart shows a 'BUY' signal across multiple indicators, with RSI at 30.76 and MACD exhibiting positive momentum, suggests that short-term traders are looking for a bounce. The ADX at 23.01 indicates a developing trend, which, if it turns upward, could see prices climb.
Furthermore, the underlying demand picture, while subject to macroeconomic headwinds, is not entirely bleak. Emerging economies, despite global slowdown concerns, continue to require energy to fuel growth. Any signs of stabilization or improvement in global manufacturing PMIs, or better-than-expected GDP figures from key consumers like China or India, could provide a significant boost to oil demand. The energy sector itself, having faced years of underinvestment in new exploration and production, may face structural supply constraints that prevent prices from falling too far for too long, regardless of short-term demand fluctuations. The technical setup on the 1-hour chart, with multiple indicators suggesting a 'BUY' and Stochastic showing a clear upward signal (%K > %D), hints at immediate buying interest around these lower levels.
The Bearish Case: Macroeconomic Headwinds and Central Bank Tightening
Conversely, the bearish case for Brent is largely anchored in the macroeconomic outlook and the aggressive stance of global central banks. With inflation figures remaining a key concern for policymakers, the prospect of higher-for-longer interest rates globally poses a significant threat to energy demand. Higher borrowing costs tend to slow economic activity, curb industrial output, and reduce consumer spending, all of which translate into lower oil consumption. The DXY (Dollar Index), currently at 99.4, which strengthened recently, often correlates inversely with commodity prices, suggesting that a stronger dollar can make oil more expensive for holders of other currencies, thus dampening demand.
The daily chart indicators present a starkly different picture from the intraday view. With RSI languishing at 35.51, firmly in the oversold territory on the daily timeframe, and the ADX at a robust 15.85 indicating a strong downtrend, the path of least resistance appears to be downwards. The MACD on the daily chart is also below its signal line, confirming bearish momentum. A daily close below the $91.64 support level, which has been identified as a key floor, would likely accelerate selling pressure, potentially targeting the next support at $91.28 and even lower. The Stochastic indicator on the daily chart, with %K at 19.73 and %D at 35.73, also supports a bearish outlook, signaling further downside potential.
Moreover, the recent news highlights a complex global economic environment. While some reports suggest stabilization in the Eurozone, others point to persistent inflation. The market is keenly awaiting crucial US inflation data (CPI) and employment figures (NFP), which will heavily influence the Federal Reserve's monetary policy decisions. If these data points come in hotter than expected, it could reinforce expectations of prolonged high interest rates, further pressuring oil prices. The correlation between oil prices and global growth expectations means that any indication of a significant economic slowdown would be a strong headwind for Brent. The bearish signals from the longer-term daily charts cannot be ignored.
The Technical Crossroads: What the Charts Are Saying
The technical landscape for Brent crude is currently at a critical crossroads, with conflicting signals across different timeframes. The 1-hour chart paints a picture of potential short-term recovery, with a 'BUY' general signal and indicators like RSI (30.76) and Stochastic (%K: 14.44, %D: 42.06) suggesting oversold conditions on this timeframe, potentially ripe for a bounce. The positive MACD momentum on this timeframe also supports a short-term bullish bias. However, this optimism is tempered by the strength of the trend indicated by the ADX at 23.01 on the 1-hour chart, which, while showing a developing trend, needs confirmation of upward momentum to be truly bullish.
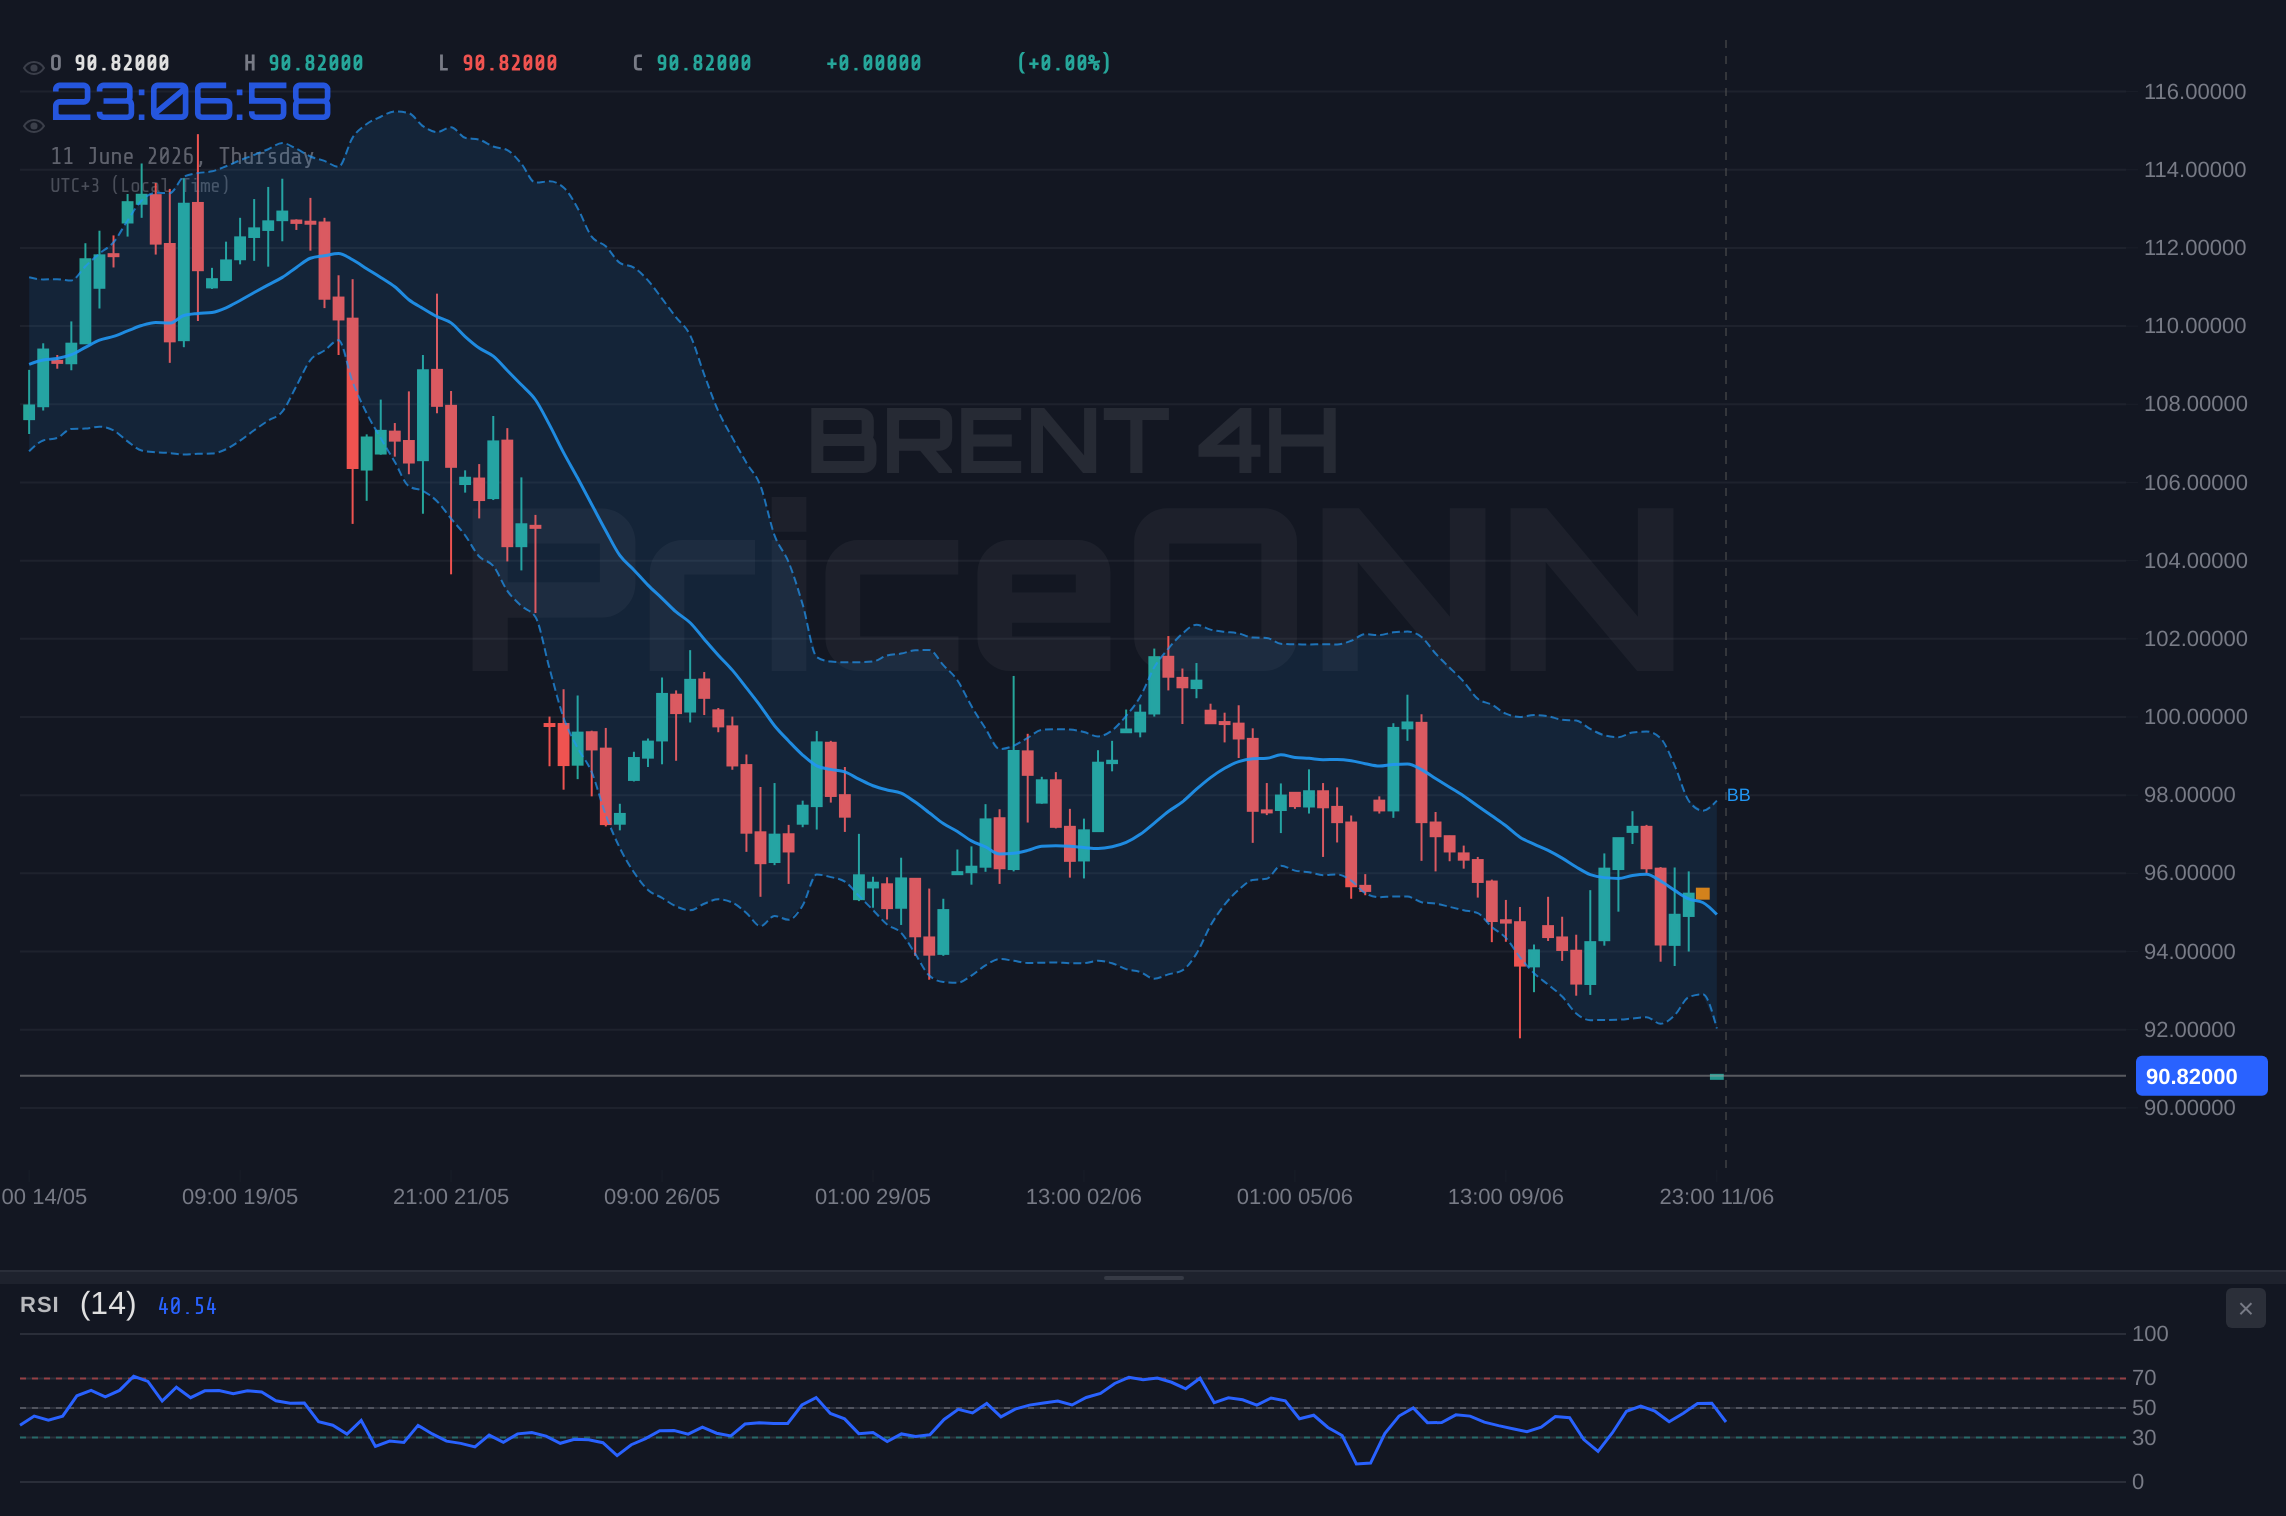
The 4-hour chart, while still showing a 'BUY' signal overall, presents a more mixed outlook. The RSI at 33.14 indicates a move away from extreme oversold conditions but still points to downward pressure. The ADX at 22.04 suggests a moderate trend, but the Bollinger Bands are below the lower band, and the Stochastic (%K: 23.87, %D: 66.34) still shows a bearish signal with %K below %D. This suggests that while a short-term bounce might occur, the underlying trend on this intermediate timeframe is still under pressure, and a sustained move higher would require breaking through key resistance levels.
It is the daily chart, however, that provides the most significant cautionary note. The overwhelming 'SELL' signal, coupled with a daily RSI of 35.51, a daily ADX of 15.85 indicating a strong downtrend, and a bearish MACD, paints a picture of potential further declines. The Stochastic indicator on the daily timeframe (%K: 19.73, %D: 35.73) continues to signal a bearish trend. This divergence between the short-term bullish signals and the longer-term bearish indicators highlights the current indecision in the market. Traders must carefully consider which timeframe's signals align with their strategy and risk tolerance. A sustained break above the $93.07 resistance on the daily chart would be needed to invalidate the bearish outlook.
Correlation Analysis: DXY and Equities
Understanding the correlation between Brent crude and other major market instruments is crucial for a comprehensive analysis. The DXY (Dollar Index), currently trading at 99.4, plays a significant role. A stronger dollar generally makes dollar-denominated commodities like Brent more expensive for international buyers, potentially dampening demand and putting downward pressure on prices. Conversely, a weaker dollar can support oil prices. With the DXY showing a slight decline today, it might offer some marginal support to Brent, but this effect is often overshadowed by stronger fundamental drivers.
Equity markets, represented by the SP500 at 6572.87 and Nasdaq100 at 29428.78, also provide context. A strong risk appetite, indicated by rising equity indices, often correlates with higher oil prices as it suggests robust economic growth and increased demand. Conversely, a sell-off in equities can signal a risk-off environment, where investors flee to safer assets, potentially leading to lower commodity prices. The current mixed signals from equities - SP500 showing a daily gain of 0.74% but a strong daily downtrend on the 1D chart, and Nasdaq100 with a similar pattern - add to the market's complexity. This uncertainty in broader risk sentiment means that Brent's price action may not follow its typical correlation patterns.
Economic Calendar Watchlist: Inflation and Rate Decisions
The economic calendar is a critical determinant of Brent's short-to-medium term trajectory. Upcoming high-impact events, particularly US inflation (CPI) and employment (NFP) data, will be closely watched. If inflation proves stickier than expected, it could reinforce the hawkish narrative surrounding the Federal Reserve, leading to higher interest rates and potentially slower economic growth, which would be bearish for oil. Conversely, any signs of cooling inflation could open the door for potential interest rate cuts later in the year, which might boost economic activity and, consequently, oil demand.
The European Central Bank (ECB) meeting, as highlighted in recent news, also carries significant weight. While the ECB might be nearing a pivot point, its decisions, along with those of other major central banks, will shape the global monetary policy landscape. Elevated interest rates across major economies can collectively dampen global growth prospects and weigh on oil demand. Furthermore, any unexpected shifts in OPEC+ production policies or significant changes in US crude oil inventories, which are often released weekly, can cause sharp price movements. Traders must remain vigilant, as these data releases have the power to quickly shift market sentiment and invalidate existing technical setups.
The Verdict: Caution Prevails Amid Conflicting Signals
Weighing the bullish arguments stemming from geopolitical risks and potential short-term oversold conditions against the bearish pressures from macroeconomic headwinds and longer-term technical weakness, the market appears to be at a critical juncture. The conflicting signals across different timeframes underscore the current indecision. While the 1-hour chart offers a glimmer of hope for a near-term bounce, the more significant daily timeframe indicators present a decidedly bearish outlook, with strong downtrend signals and RSI in oversold territory.
The price of $90.80 for Brent crude sits precariously close to the $91.64 support. A decisive break below this level, confirmed by daily closes and supported by weaker economic data or a stronger dollar, would likely trigger further downside, targeting $91.28 and potentially lower. Conversely, a failure to break support, coupled with positive geopolitical developments or a more dovish tone from central banks, could see prices rebound towards the $93.07 and $93.66 resistance levels. Given the current divergence, a patient approach is warranted. Waiting for a clear break of either the support or resistance levels, backed by confirmation from fundamental data, will be key to navigating this uncertain environment. Risk management remains paramount, and traders should be prepared for continued volatility.
Bearish Scenario: Support Breakdown
65% ProbabilityNeutral Scenario: Consolidation Around $90.80
25% ProbabilityBullish Scenario: Bounce from Support
10% ProbabilityFrequently Asked Questions: BRENT Analysis
What happens if BRENT breaks below the $91.64 support level?
A daily close below $91.64 would likely trigger further selling pressure, invalidating short-term bullish hopes. The bearish scenario suggests a move towards $91.28 and potentially $90.71.
Should I consider buying BRENT at current levels around $90.80 given the RSI at 35.51 on the daily chart?
While the daily RSI at 35.51 indicates oversold conditions, the overall bearish trend signal (ADX 15.85) suggests caution. A confirmed bounce above $91.64 with strong volume would be a more reliable buy signal.
Is the ADX at 15.85 a strong sell signal for BRENT on the daily chart?
An ADX of 15.85 on the daily chart indicates a strong downtrend, confirming the bearish sentiment. This reading suggests that the current downward move has significant momentum, making further declines probable if key support fails.
How will upcoming US inflation data affect BRENT's price action this week?
Hotter-than-expected inflation data could reinforce hawkish Fed expectations, strengthening the dollar and pressuring oil prices lower. Conversely, cooler inflation might prompt a dovish shift, potentially supporting Brent by mid-91s or higher.
Track markets in real-time
AI-powered analysis, technical indicators and real-time price data.
Join Our Telegram Channel
Breaking market news, AI analysis and trading signals instantly.
Join Channel