The EURUSD pair is currently navigating a critical juncture, hovering precariously around the $1.16 mark as the week draws to a close. This pivotal level has become a battleground for bulls and bears alike, with the upcoming Consumer Price Index (CPI) data from the United States looming large as a potential catalyst for a decisive move. As a seasoned economic analyst, I've observed that periods of consolidation like this often precede significant market shifts, and the current technical setup suggests that volatility is likely to increase. The interplay between the greenback's strength, driven by shifting Federal Reserve expectations, and the Euro's own economic narrative, particularly concerning the European Central Bank's (ECB) monetary policy path, creates a complex environment for this major currency pair. Understanding the nuances of these opposing forces is paramount for any trader aiming to navigate the choppy waters ahead.
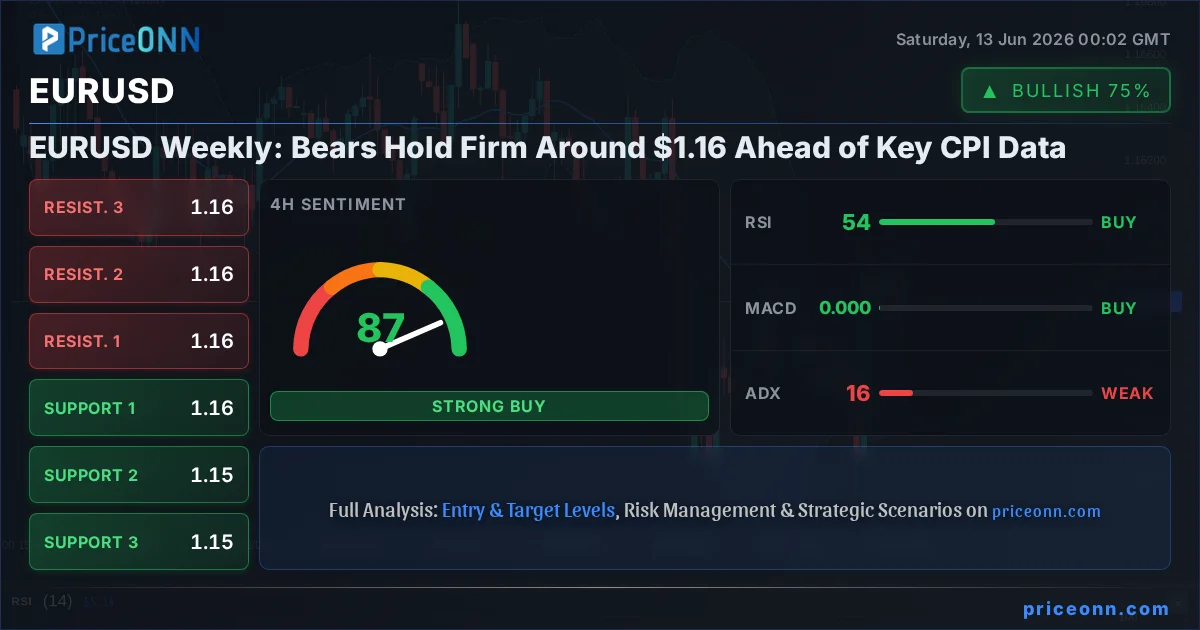
- EURUSD is consolidating around $1.16, reflecting indecision between bullish and bearish forces.
- Critical support for EURUSD is observed at $1.15203, while resistance looms at $1.15605, based on daily chart data.
- The RSI at 44.03 on the daily chart indicates a bearish trend, but Stochastic showing a potential bullish signal suggests caution.
- Federal Reserve policy expectations continue to heavily influence the US Dollar Index (DXY), which is currently at 99.8, impacting EURUSD's correlation.
This consolidation around $1.16 is not merely a pause; it's a reflection of fundamental uncertainties and conflicting technical signals. On the daily charts, the EURUSD pair is exhibiting signs of a bearish trend, with the Relative Strength Index (RSI) hovering at 44.03. This suggests that while sellers have had the upper hand recently, the pair is not yet in deeply oversold territory, leaving room for further downside pressure if key support levels falter. However, looking at the shorter timeframes, such as the 4-hour chart, the Stochastic Oscillator is flashing a bullish signal, with %K at 29.85 and %D at 20.01, indicating a potential upward correction or a short-term bounce from oversold conditions. This divergence between the longer-term bearish trend and short-term bullish indicators creates a 'watch and wait' scenario for many market participants. The market sentiment analysis reveals a cautious approach, with traders hesitant to commit to large positions ahead of major economic data releases, particularly the US CPI report.
The Dollar Index (DXY), a key barometer for the greenback's strength against a basket of major currencies, currently stands at 99.8. Its upward trajectory over the recent period has been a significant headwind for EURUSD. Historically, a strong DXY often correlates inversely with EURUSD, and the current levels suggest the dollar remains fundamentally supported. This strength is largely underpinned by the market's evolving expectations regarding the Federal Reserve's monetary policy. While the Fed has signaled a pause in rate hikes, the persistent inflation data and a robust labor market continue to fuel speculation about the possibility of further tightening or a prolonged period of higher interest rates. This uncertainty keeps upward pressure on the dollar, making it challenging for the Euro to mount a sustained recovery. The current DXY level of 99.8 suggests that the dollar bulls are holding their ground, and any sign of weakness here could provide a much-needed reprieve for the EURUSD pair.
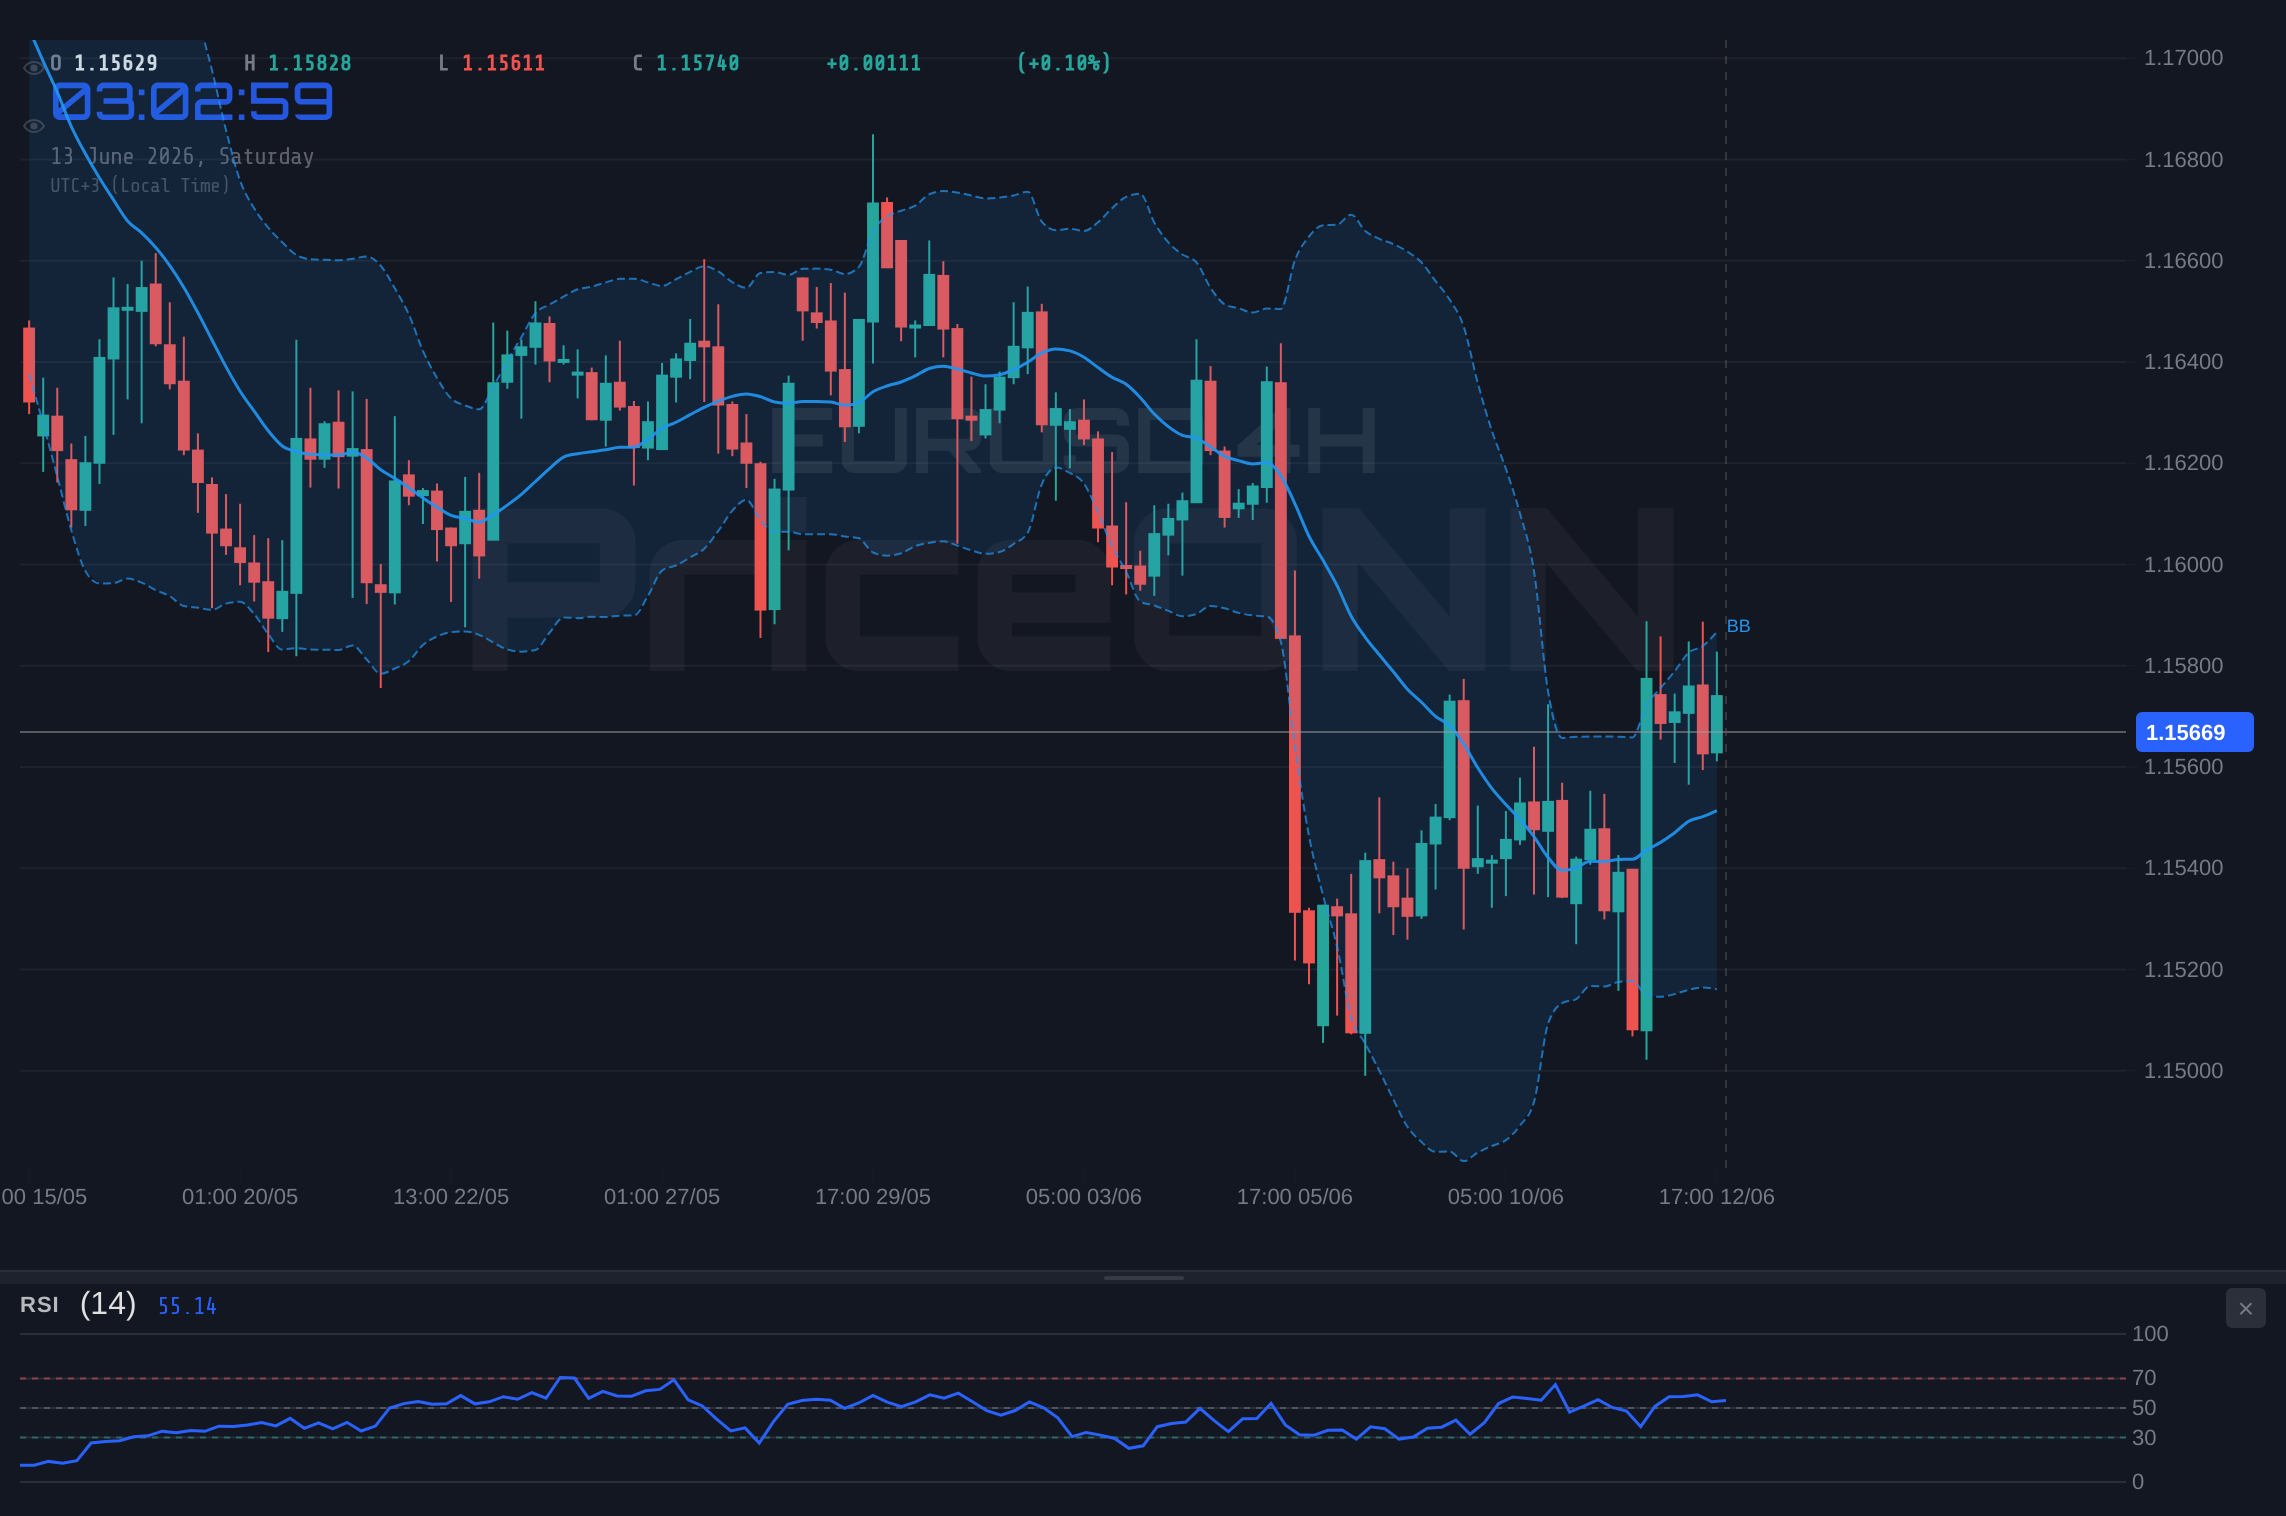
From a pure price action perspective, the EURUSD's dance around the $1.16 handle is particularly telling. On the daily chart, the pair has been unable to decisively break above the resistance level at $1.15605, and conversely, it has shown resilience around the support at $1.15203. This narrow trading range, often termed consolidation, indicates a market in equilibrium, where neither buyers nor sellers have a clear advantage. However, such periods are rarely sustainable. The ADX indicator, which measures trend strength, is reading 19.51 on the daily timeframe. This low value signifies a weak trend, reinforcing the notion of a range-bound market. For scalpers and short-term traders, this presents challenges as sharp, sustained moves are absent. Swing traders, on the other hand, might look for opportunities at the edges of this range, anticipating a bounce from support or a rejection at resistance, though the low ADX suggests that such moves might lack follow-through. Long-term investors, however, are likely holding their positions, waiting for a clearer directional signal or a significant break of these key levels.
The divergence in technical signals across different timeframes adds another layer of complexity. While the daily chart leans bearish with RSI at 44.03 and MACD histogram showing negative momentum, the 1-hour and 4-hour charts present a more nuanced picture. The 1-hour Stochastic Oscillator is in the overbought territory (K=51.18, D=47.12), suggesting a potential short-term pullback, while the 4-hour Stochastic (K=79.29, D=69.55) also points towards upward momentum, albeit with caution given its proximity to extreme levels. This conflict suggests that short-term traders might find opportunities for quick trades, but the overall trend remains uncertain. The Bollinger Bands on the daily chart are positioned below the middle band, indicating bearish pressure, yet on the 4-hour chart, they are hugging the middle band, hinting at a potential shift. This is precisely the kind of environment where disciplined risk management is crucial, as false breakouts or reversals can quickly trap unwary traders.
Looking at the broader economic landscape, the Eurozone's own economic indicators paint a mixed picture. While inflation has shown signs of moderating, it remains above the ECB's target, leading to ongoing debate about the future path of monetary policy. Recent ECB meeting minutes, as highlighted in market news, suggest that while a pause in rate hikes might be on the table, policymakers are keen to keep their options open, especially in light of persistent underlying price pressures. This cautious stance from the ECB contrasts with the Fed's more data-dependent approach, creating a dynamic that influences the EURUSD cross. The ECB's decision-making process, particularly its forward guidance on interest rates, will be a critical factor to watch in the coming weeks, potentially providing the clarity needed to break the current stalemate around $1.16.
The recent geopolitical developments, particularly concerning the Middle East, have also injected an element of uncertainty into the global financial markets. While oil prices have seen some volatility, the 'Hormuz Optimism' mentioned in recent news suggests a de-escalation of tensions, which could reduce safe-haven demand for assets like the US Dollar and potentially offer some support to riskier currencies. However, the impact on EURUSD is not always direct. A general decrease in global risk aversion can lead to increased appetite for the Euro, but this is often counteracted by the dominant influence of US interest rate differentials and economic data. The market's reaction to geopolitical events is complex, and while a reduction in conflict might seem universally positive, its specific impact on currency pairs depends on how it alters the relative economic outlook and central bank policy expectations.
For scalpers, navigating the tight ranges around $1.16 requires extreme precision and tight stop-losses. The low ADX of 19.51 on the daily chart indicates that trending moves are weak, meaning quick entries and exits are key. They might look for small bounces off the $1.15203 support or quick rejections from the $1.15605 resistance. However, the risk of a sudden breakout, fueled by unexpected news or data, means that even short-term trades carry significant risk. The Stochastic Oscillator on the 1-hour chart, currently at K=51.18, D=47.12, suggests some upward momentum, which might be a short-lived opportunity for a quick scalp. But the overriding sentiment from the daily chart remains cautionary, implying that these short-term plays are against the prevailing longer-term trend.
Swing traders face a more challenging environment in this consolidation phase. The lack of clear direction means that trying to catch trends is difficult. Instead, they might focus on playing the range, buying near the $1.15203 support and selling near the $1.15605 resistance. However, the low ADX reading suggests that these range-bound trades might not offer substantial profits before reversing. A more prudent approach for swing traders would be to wait for a decisive break of either the support or resistance levels. A clear daily close above $1.15605 could signal a move towards higher resistance levels, while a break below $1.15203 might open the door for further downside towards $1.15061. The key is to wait for confirmation on the daily timeframe before committing significant capital, ensuring that the trade aligns with a more established trend.
Long-term investors, on the other hand, are likely observing the broader macroeconomic picture and the ECB's policy trajectory. While the current price action around $1.16 might seem insignificant on a weekly or monthly scale, it represents a crucial psychological level. A sustained break above $1.15605 could signal a shift in sentiment, potentially leading to a re-test of higher levels. Conversely, a decisive drop below $1.15203, especially if accompanied by strong US economic data or hawkish Fed commentary, could signal the beginning of a more significant downtrend. For these investors, the upcoming CPI data will be pivotal, as it could influence the Fed's stance and, consequently, the long-term direction of EURUSD. They are less concerned with the daily fluctuations and more focused on the underlying economic fundamentals and the potential for longer-term trend development.
The correlation analysis between EURUSD, the DXY, and major equity indices like the S&P 500 and Nasdaq 100 provides further context. Currently, the DXY at 99.8 is showing strength, which typically puts pressure on EURUSD. The S&P 500 (6572.87) and Nasdaq 100 (29644.55) are both showing upward momentum on shorter timeframes, suggesting a degree of risk appetite. However, the daily trend for both indices is bearish, indicating underlying caution. This mixed picture in equities adds to the uncertainty. If risk aversion were to increase significantly, we might see a flight to safety, benefiting the dollar and potentially pushing EURUSD lower. Conversely, if risk appetite prevails and US yields remain stable or decline, it could offer some support to EURUSD, despite the dollar's current strength.
The energy markets, particularly Brent crude oil at $88.63 and WTI at $84.85, are also worth monitoring. The sharp decline in oil prices observed recently, influenced by geopolitical 'optimism', could have deflationary implications. Lower energy prices might reduce inflationary pressures globally, potentially influencing central bank policy. For the Eurozone, which is a net energy importer, lower oil prices could be a positive development, easing some inflationary burdens and potentially allowing the ECB more flexibility. However, the immediate impact on EURUSD is likely to be secondary to the dominant narrative of US interest rates and economic performance. The current downward trend in oil suggests that immediate inflationary shocks are less likely, which could subtly shift the focus back to monetary policy divergence.
The technical indicators on the daily timeframe present a clear bearish bias. The RSI at 44.03 suggests room for further downside before reaching oversold territory. The MACD histogram is negative, indicating bearish momentum, and it remains below the signal line, reinforcing this view. The Stochastic Oscillator, while showing a potential bullish crossover with K=29.85 and D=20.01, is coming from very low levels, which could indicate a short-lived bounce rather than a sustained reversal. The ADX at 19.51 confirms the lack of a strong trend, meaning any downside move might be gradual or choppy. For bears, the key is to hold below the $1.15605 resistance. A failure to do so, especially with a decisive daily close above it, would invalidate the immediate bearish outlook and suggest a move towards higher levels.
Conversely, the bullish case hinges on a few key factors. Firstly, the Stochastic Oscillator on the daily chart is showing a potential bullish signal, and on the 4-hour chart, it is in the upper range, suggesting buying pressure might be building. Secondly, if upcoming US CPI data comes in softer than expected, it could lead to a reassessment of Fed policy, weakening the dollar and providing a catalyst for EURUSD to move higher. The $1.15605 resistance level becomes a crucial immediate target. A clear break and sustained move above this level, confirmed by daily closes, would likely open the door for a test of the next resistance at $1.15865. However, the overall bearish sentiment from the daily RSI and MACD means that any upside move needs to be watched carefully for signs of stalling or reversal.
The neutral scenario acknowledges the current indecision and range-bound trading. With the ADX at 19.51, the market is not trending strongly in either direction. This suggests that EURUSD could continue to trade sideways between the support at $1.15203 and resistance at $1.15605 for the near future. This scenario is most likely to play out if the upcoming US CPI data comes in largely as expected, offering no significant new information to sway market sentiment decisively. In such a case, traders would continue to look for range-bound opportunities, potentially buying near support and selling near resistance, while keeping a close eye on any developing volatility that could signal an impending breakout. The key for this scenario is the absence of a strong catalyst to break the current equilibrium.
Scenario Analysis: Navigating the $1.16 Crossroads
Bearish Scenario: Bears Maintain Control
65% ProbabilityNeutral Scenario: Range-Bound Consolidation
25% ProbabilityBullish Scenario: Bulls Reclaim Ground
10% ProbabilityFrequently Asked Questions: EURUSD Analysis
What happens if EURUSD breaks below the $1.15203 support level following the US CPI data?
A decisive daily close below $1.15203 would invalidate the current consolidation and likely trigger further selling pressure. The immediate target would then shift to $1.15061, followed by the key daily support at $1.14801, indicating a potential continuation of the bearish trend observed on longer timeframes.
Should I consider buying EURUSD at current levels around $1.16, given the mixed signals?
Buying at current levels is risky due to the prevailing bearish trend on the daily chart and the ADX at 19.51 suggesting weak trend strength. A more prudent approach would be to wait for a confirmed break above $1.15605 resistance, especially if US CPI data is softer than expected, or to look for a bounce from $1.15203 support with clear bullish confirmation signals.
Is the RSI at 44.03 on the daily chart a strong sell signal for EURUSD?
An RSI of 44.03 on the daily chart indicates a bearish sentiment but is not yet in oversold territory. While it supports the bearish outlook, it also suggests there is room for further downside before extreme conditions are met. It's best used in conjunction with other indicators like MACD and price action confirmation for a stronger sell signal.
How will the Federal Reserve's policy expectations impact EURUSD this week, especially with the upcoming CPI data?
Stronger-than-expected US CPI data would likely reinforce expectations of a hawkish Fed stance, strengthening the US Dollar and pressuring EURUSD lower. Conversely, softer CPI figures could lead to a reassessment of Fed policy, potentially weakening the dollar and allowing EURUSD to rally towards resistance levels like $1.15605.
Technical Outlook Summary
| Indicator | Value | Signal | Interpretation |
|---|---|---|---|
| RSI (14) | 44.03 | Bearish | Nearing oversold, but still room to fall. |
| MACD Histogram | - | Bearish | Negative momentum confirms downtrend. |
| Stochastic | K: 29.85, D: 20.01 | Bullish Crossover | Potential short-term bounce from oversold. |
| ADX | 19.51 | Weak Trend | Range-bound conditions prevail. |
| Bollinger Bands | Middle Band | Below | Suggests bearish pressure on Daily. |
Key Levels
Track markets in real-time
AI-powered analysis, technical indicators and real-time price data.
Join Our Telegram Channel
Breaking market news, AI analysis and trading signals instantly.
Join Channel