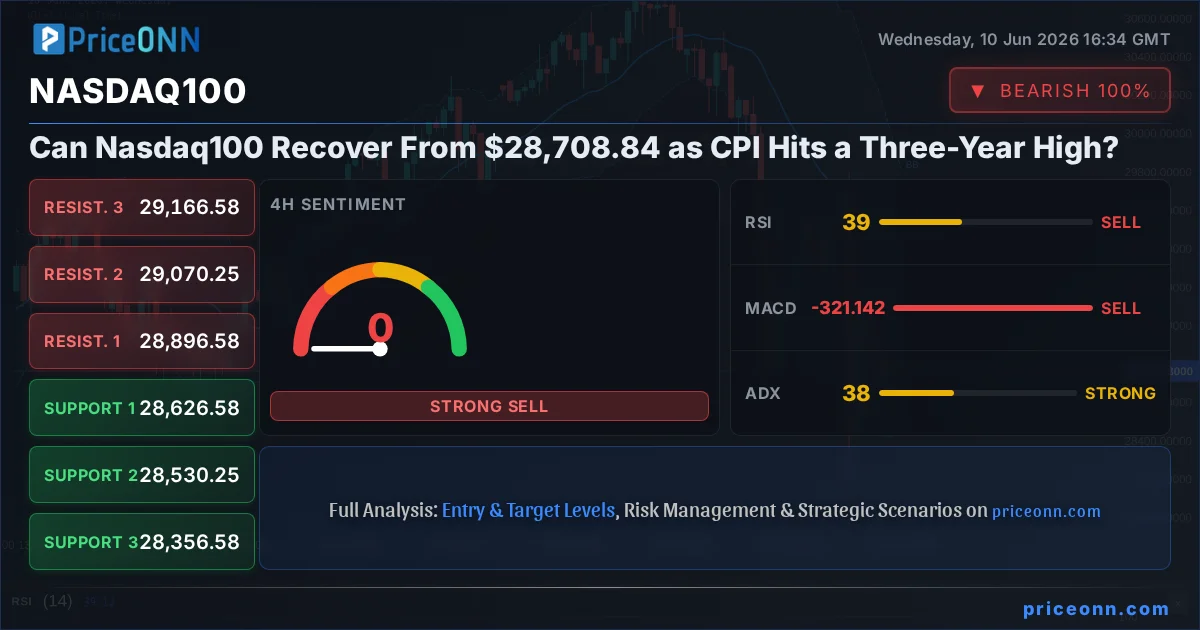
Two words rattled trading desks on Wednesday: "three-year high." The US Consumer Price Index for May climbed 0.5% month-on-month, the hottest reading since 2023 according to Bloomberg data, and the Nasdaq100 today analysis tells the story with brutal clarity: the index has tumbled 2.32% to $28,708.84, caught in a fierce bull-versus-bear battle at a level that could define the next major directional move for tech-heavy growth equities. The question is no longer whether CPI matters - it is whether the selloff has already gone too far, or if this is just the opening act.
- Nasdaq100 dropped 2.32% to $28,708.84 after US May CPI printed at a three-year high of +0.5% month-on-month, materially reducing near-term Federal Reserve rate-cut expectations.
- The 4H ADX at 38.48 signals a strong, committed bearish trend - this is not a casual drift lower; institutional sellers have conviction behind this move.
- Critical 4H support sits at $28,626.58; a confirmed close below this level opens the path to $28,530.25 and the deeper cluster at $28,356.58.
- First meaningful resistance stands at $28,896.58 on the 4H chart; bulls need a sustained reclaim here before any short-term momentum shift is credible.
- Daily RSI at 45.51 is not yet oversold - unlike gold where 4H RSI has crashed to 21.72 - which means there is technical room for further downside before exhaustion buyers emerge.
The Inflation Verdict - What the CPI Print Actually Means for Tech
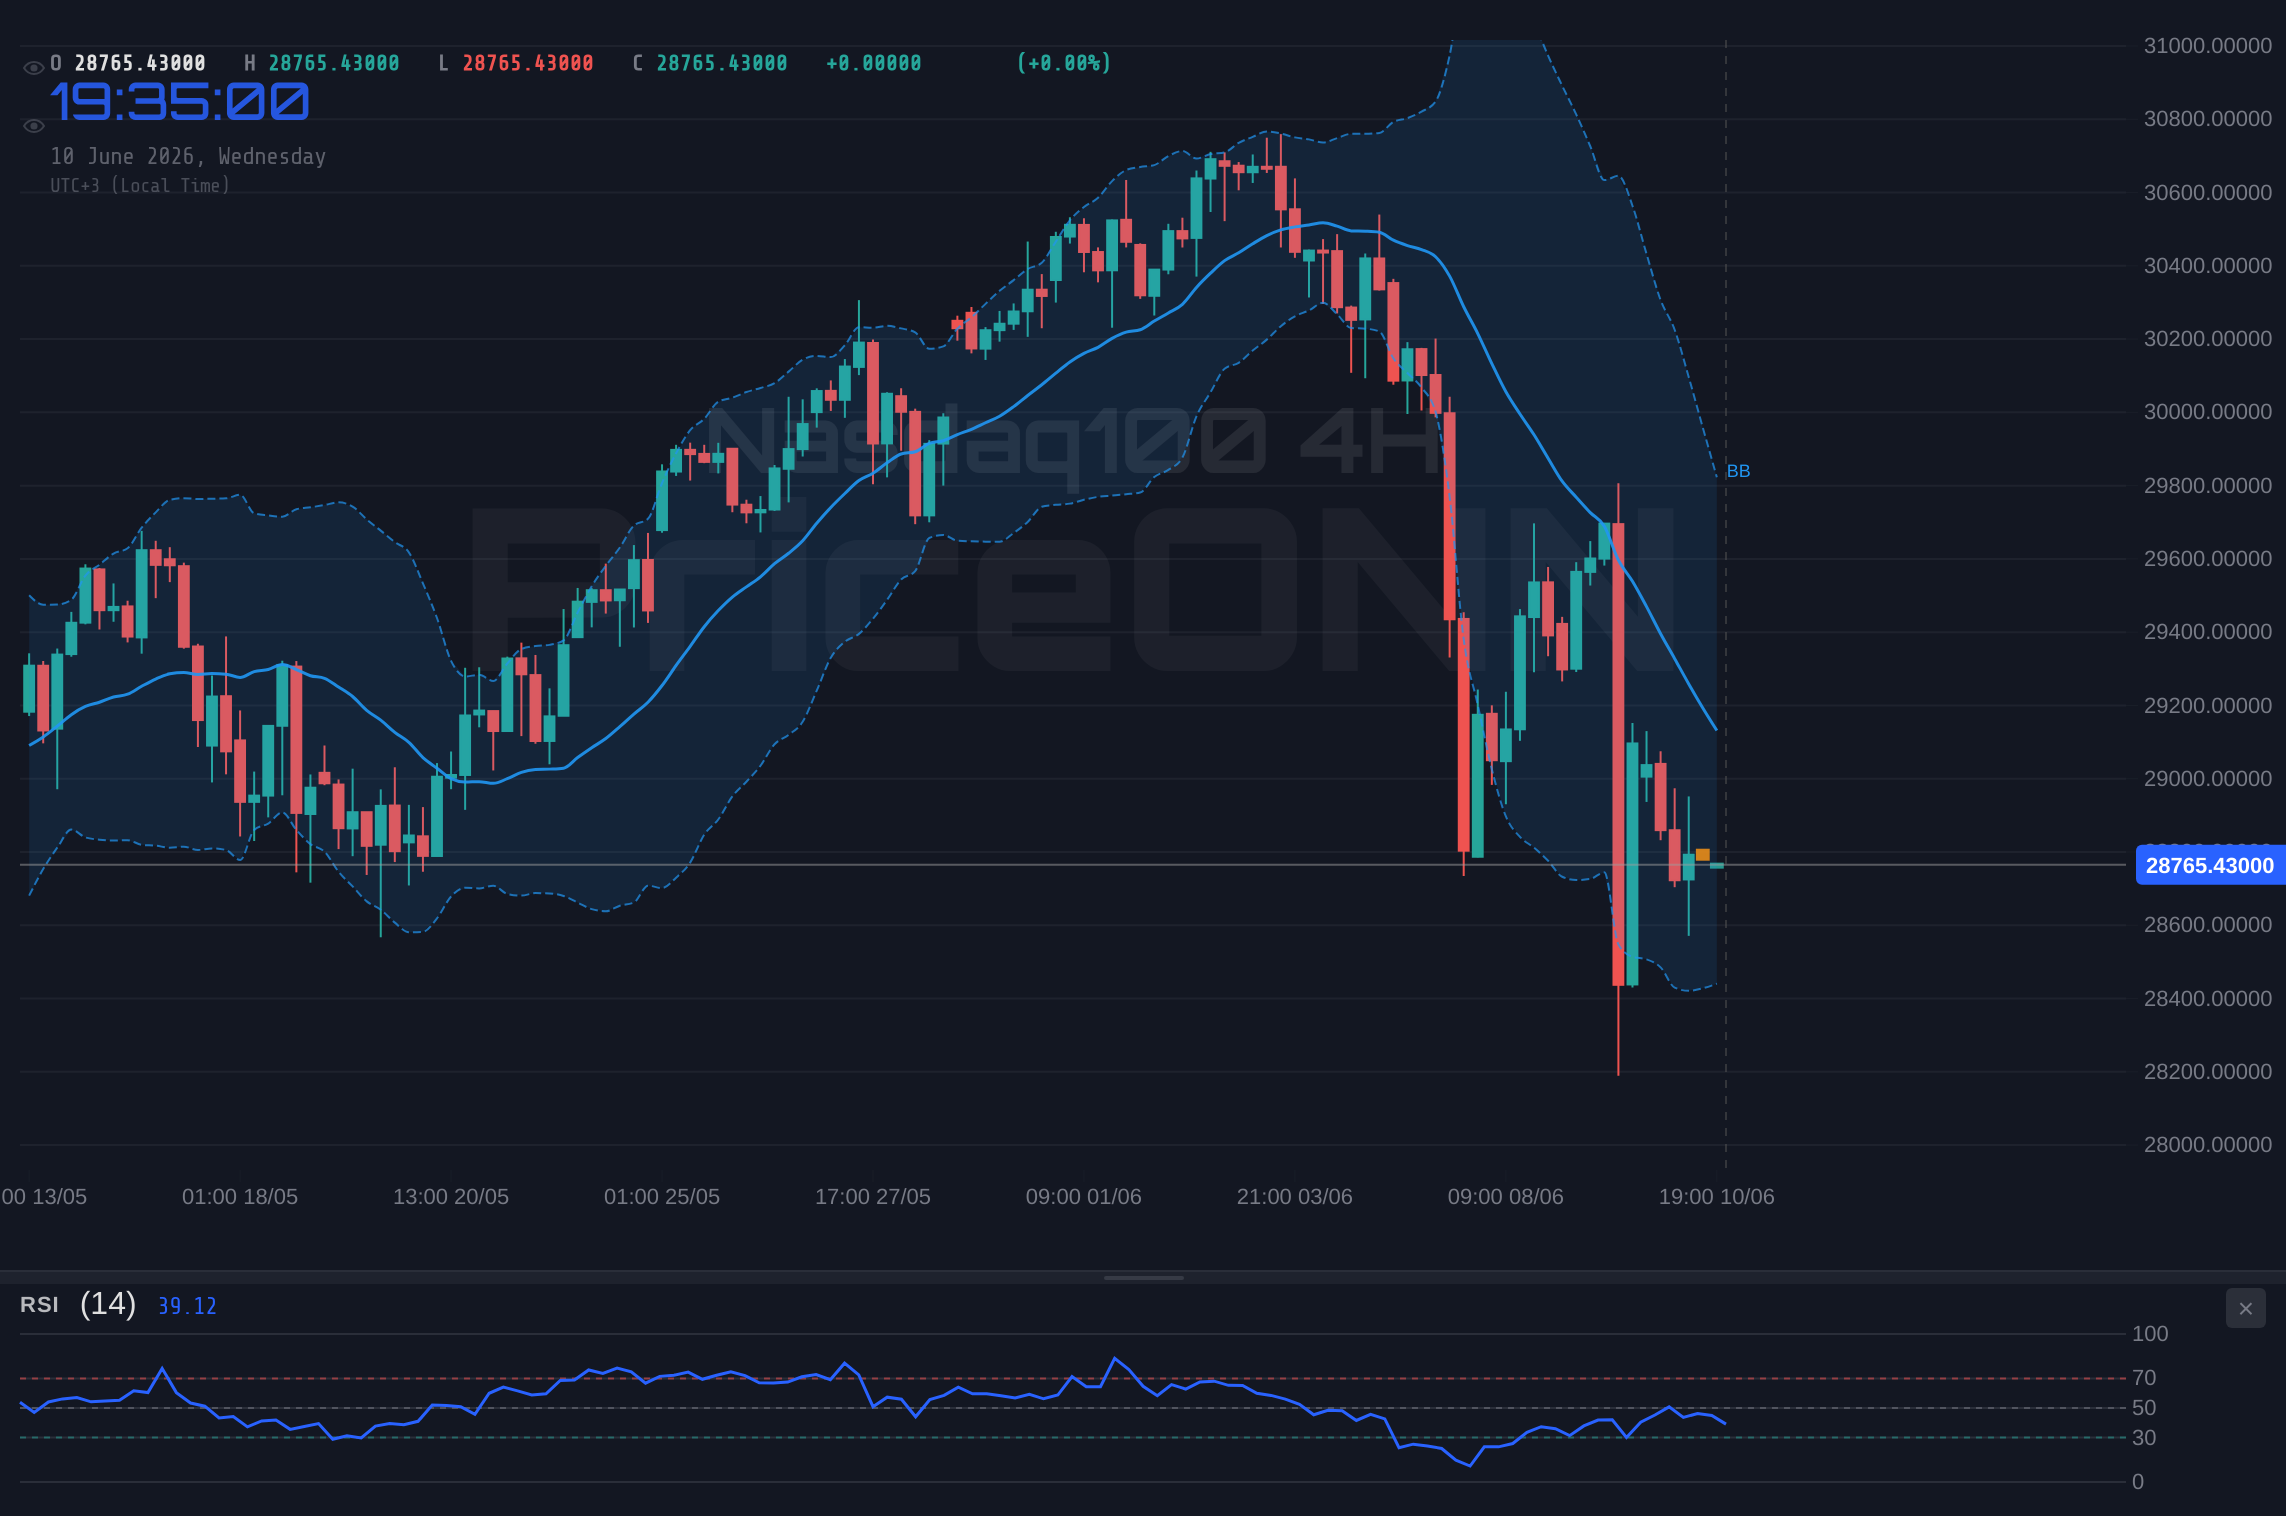
Let's be direct about what just happened. The May CPI release - 0.5% month-on-month, the highest reading in three years per Bloomberg consensus data - was not a total shock. It met the forecast. Reuters reported on Tuesday that traders were already "taking profits ahead of high-stakes US CPI" with conviction "notably absent" across asset classes. The sell pressure was preloaded and waiting for a trigger. That trigger arrived Wednesday, and the Nasdaq100 traced an extraordinary intraday range from $29,806.42 all the way down toward $28,189.01 before stabilizing around $28,708.84 by mid-session. That is nearly a $1,600 range in a single trading day.
Here is why the Nasdaq100 specifically absorbs this kind of damage from inflation data. Unlike value-heavy indices such as the Dow Jones (currently down a more contained 0.96% at $50,274), the Nasdaq100 is structurally dominated by high-multiple growth stocks. These companies' valuations are deeply sensitive to discount rates. When inflation runs hotter than desired, it extends the timeline for Federal Reserve rate cuts. A higher-for-longer rate environment directly compresses the net present value of future earnings streams. That is not sentiment or narrative - it is the basic mechanics of equity valuation. When the risk-free rate rises, the present value of cash flows ten years into the future falls. Every Nasdaq100 component with a price-to-earnings ratio above 30 feels this compression acutely.
The broader market context adds a critical layer. The S&P 500 is actually up 0.74% at $6,572.87 - a notable divergence from the Nasdaq100's sharp decline. This gap is a rotation signal: investors are moving out of high-multiple growth names and into value and cyclicals, even within a single session. The DXY at 99.62, essentially flat on the day at -0.1%, confirms the CPI print was sufficiently anticipated to already be partly priced into the dollar. Brent crude at $95.98 (down 0.61%) and WTI at $91.61 (down 0.75%) are not surging despite the inflationary headline - a subtle but important nuance. If energy prices were accelerating alongside CPI, the inflation outlook would be far more alarming. Instead, commodity markets are relatively contained, which limits the Fed's most hawkish scenarios.
The Bear Case - Why the Selloff Has Further to Run
The short-to-medium term technical picture firmly belongs to the bears, and the data across multiple timeframes is not ambiguous about this conclusion.
Start with the 4-hour chart - the key decision timeframe for swing traders, proprietary desks, and systematic funds managing intraday positioning. The 4H trend is classified as bearish at 97% strength. The 4H ADX at 38.48 is the headline number here. When ADX climbs above 35 in a declining market, it does not merely describe a trend - it confirms the trend has real, organized selling behind it. There is no "maybe" in an ADX of 38.48. Compare this to the 1H ADX at 29.02, which is elevated but not extreme. The 4H is where the institutional conviction lives right now, and that conviction is overwhelmingly bearish. The 4H Stochastic reinforces the picture: %K at 35.54 is still trading below %D at 49.07, a bearish crossover that has not resolved. The 4H MACD histogram is in negative territory with momentum building on the downside. The aggregate 4H signal tally is 0 buys versus 8 sells - a clean sweep for the bears on that timeframe.
The daily chart adds context without contradicting the short-term setup. Daily ADX at 34.61 confirms trend momentum is entrenched at the macro level too. The daily RSI at 45.51 is in the neutral-to-bearish zone and trending lower - critically, it has not reached the 30-35 oversold range that triggers mechanical buying from systematic, rules-based funds. Compare this with gold (XAUUSD), where the daily RSI has collapsed to 26.45 and the 4H RSI has bottomed at an extreme 21.72, generating genuine oversold signals. The Nasdaq100 is nowhere near that level of exhaustion. Historically, when RSI reaches the mid-40s on the Nasdaq100 in a confirmed bearish 4H environment, the mechanical bounce does not typically arrive until RSI tests the 30-35 range on the daily chart. That level has not been tested yet.
The Nasdaq100 MACD signal across both 4H and daily timeframes is negative, with momentum continuing to build in the sellers' direction. Bollinger Bands on the 4H chart show price trading below the middle band - a classic textbook confirmation of short-term bearish bias. For bears watching the Nasdaq100 support and resistance levels, the key trigger is a 4H close below $28,626.58. Until that level breaks, the selloff is contained within the current support structure. Once it breaks, the cascade toward $28,530.25 and then $28,356.58 becomes the baseline scenario.
Fundamentally, the bear case is anchored in the rate-cut timeline. The Bank of Canada's Wednesday decision to hold its policy rate at 2.25% while noting it needs to "balance competing risks from oil prices and trade" is a useful parallel for the Fed's predicament. Even central banks that want to cut are finding themselves constrained by inflationary data. The Fed faces the same bind with higher-pressure metrics. Rate-sensitive Nasdaq100 components - particularly the mega-cap technology names with forward price-to-earnings ratios above 25 - carry valuations that only make sense in a declining rate environment. That environment is not available right now.
A confirmed 4H close below $28,626.58 is the technical trigger for the next leg lower, targeting $28,530.25 and then $28,356.58. The daily support at $27,973.65 represents the extended downside target if selling accelerates. The 4H MACD showing no sign of reversal is a warning for any bull attempting to call a bottom here prematurely.
The Bull Case - Why Dip Buyers Are Already Circling
Before writing off the Nasdaq100 entirely, the counter-narrative deserves a fair hearing - because it has genuine technical and fundamental substance.
The 1-hour chart is sending early-stage recovery signals that are worth tracking. The 1H Stochastic has %K at 47.58 crossing above %D at 39.62 - a fresh bullish crossover taking shape in real time. The 1H MACD is showing positive momentum with the signal line providing underlying support. The 1H ADX at 29.02 is elevated but below the 4H's more extreme 38.48 reading, suggesting the hourly momentum is beginning to show the first signs of divergence from the 4H bearish conviction. Six of eight technical signals are still selling on the 1H chart - but two buyers have emerged, and that shift is a tell worth watching.
Longer-term, the daily trend classification is bullish at 92% strength. This is the structural context that separates a pullback from a reversal. The Nasdaq100 weekly outlook has not broken down at the macro level - the index has retraced into a zone of interest that, in prior inflation-shock selloffs, has historically attracted institutional accumulation. The current drawdown needs to breach $28,379.48 (daily support) before the larger framework is genuinely threatened. Until that level fails, the bull case has structural grounds to stand on.
The DXY argument provides a subtle tailwind for bulls. At 99.62, the dollar has failed to aggressively strengthen despite the hot CPI print. The DXY's 4H trend is actually neutral at 50% strength, and the 1H signal mix shows 5 buys versus 3 sells - more buyers than sellers. If the DXY rolls over from current levels, the well-documented inverse correlation between dollar strength and Nasdaq100 performance would provide a mechanical bid for growth assets. The Nasdaq100 market sentiment analysis frequently tracks this DXY-tech relationship as a leading indicator, and right now the dollar has not broken convincingly higher - a quiet positive for the bull case.
There is also the "consensus-miss" argument for bulls. The May print met Bloomberg consensus exactly at +0.5% m/m - there was no upside surprise beyond what was already expected and priced. Markets frequently overshoot in their initial response to inflation headlines, particularly when positioning is already cautiously net-short heading into the release. The Nasdaq100 trend analysis on the daily timeframe maintains a bullish structural trend - and pullbacks to the $28,700-$28,900 zone have historically been absorbed by medium-term buyers who view rate-sensitive selloffs as entry opportunities rather than trend reversals.
The first bull confirmation to monitor is a 4H close above $28,896.58. Above this level, the path toward $29,070.25 and then $29,166.58 opens up. The 1H Stochastic bullish crossover is an early signal - but position sizing should remain conservative until the 4H chart confirms participation from larger timeframe buyers with volume.
Reading the Evidence - Where the Tiebreaker Points
Run through the scorecard across timeframes and the verdict becomes clear, if uncomfortable for bulls in the near term. The 4H chart delivers 8 sell signals, an ADX of 38.48 confirming trend strength, and a bearish Stochastic crossover still unwinding. The daily RSI at 45.51 has not reached the oversold levels that mechanically attract systematic buyers. The primary economic catalyst - a three-year high CPI print - has pushed Fed rate-cut expectations further into the future, and the Nasdaq100's valuation multiples are uniquely sensitive to exactly this kind of policy shift.
The Nasdaq100 breakout case exists primarily in the structure of the longer-term daily trend (bullish at 92%) and the emerging 1H recovery signals. These are real and worth monitoring. But they are not sufficient to override the weight of 4H and daily bearish momentum indicators in the near term.
The verdict for short-to-medium term Nasdaq100 trading signals: the path of least resistance is lower, with $28,626.58 acting as the immediate decision level. A 4H close below this price shifts the Nasdaq100 price forecast toward $28,530.25 and potentially $28,356.58. Only a reclaim of $28,896.58 on 4H closes - ideally with expanding volume - would signal that buyers have successfully absorbed the CPI-driven supply pressure and the recovery phase has genuinely begun.
Three Scenarios for the Sessions Ahead
Breakdown Scenario - Bears Seal the Deal
55% ProbabilityConsolidation Scenario - Market Digests the CPI Shock
30% ProbabilityRecovery Scenario - CPI Was Already Priced In
15% ProbabilityKey Levels at a Glance
Technical Outlook Summary
| Indicator | Value | Signal |
|---|---|---|
| RSI (14) - 1H | 40.78 | Neutral - Bearish Lean |
| RSI (14) - 4H | 37.55 | Bearish |
| RSI (14) - 1D | 45.51 | Neutral - Room to Fall |
| MACD - 4H | Negative | Bearish Momentum |
| Stochastic - 1H | K=47.58 / D=39.62 | Bullish Crossover (Early) |
| Stochastic - 4H | K=35.54 / D=49.07 | Bearish |
| ADX - 4H | 38.48 | Strong Bearish Trend |
| ADX - 1D | 34.61 | Bearish Trend Confirmed |
Frequently Asked Questions: Nasdaq100 Analysis
What happens to Nasdaq100 if it breaks below $28,626.58?
A confirmed 4H close below $28,626.58 activates the next support cluster at $28,530.25, followed by the deeper level at $28,356.58. If selling accelerates beyond that zone, the daily support at $27,973.65 becomes the extended downside target. The 4H ADX at 38.48 confirms that trend momentum is strong enough to sustain a breakdown move if this level gives way on a closing basis.
Is the 2.32% Nasdaq100 drop to $28,708.84 an overreaction to the CPI data?
The May CPI print of +0.5% month-on-month met Bloomberg consensus exactly - there was no upside surprise beyond what markets had already anticipated. However, the daily RSI at 45.51 has not reached oversold levels, meaning technical buyers are not yet compelled to step in mechanically, making the overreaction thesis premature until $28,626.58 holds on a confirmed closing basis. The daily trend structure at 92% bullish strength suggests the broader framework remains intact if that support holds.
What does the 4H ADX reading of 38.48 mean for Nasdaq100 price forecast?
An ADX above 35 confirms that the current bearish trend has strong institutional conviction - this is not a weak drift but a directional move with organized selling behind it. At 38.48 on the 4H chart, the Nasdaq100 price forecast leans toward extended downside rather than a quick V-shaped recovery; bounces should be treated cautiously until the ADX begins to roll over. A meaningful trend change would require ADX to decline below 25 and price to reclaim the $28,896.58 resistance level on sustained 4H closes.
How will Fed rate-cut delays following the three-year high CPI affect Nasdaq100 this week?
The three-year high CPI print pushes the Federal Reserve's easing timeline further back, creating direct valuation pressure on high-multiple Nasdaq100 components through the discount rate mechanism. If subsequent inflation data (PPI, PCE) confirms the CPI trend, the Fed's higher-for-longer stance will keep the index under pressure, with $28,356.58 becoming a realistic near-term target. Only a dovish Fed communication or a meaningful reversal in inflation expectations would provide the catalyst needed to reactivate the bull case above $28,896.58.
Track markets in real-time
AI-powered analysis, technical indicators and real-time price data.
Join Our Telegram Channel
Breaking market news, AI analysis and trading signals instantly.
Join Channel