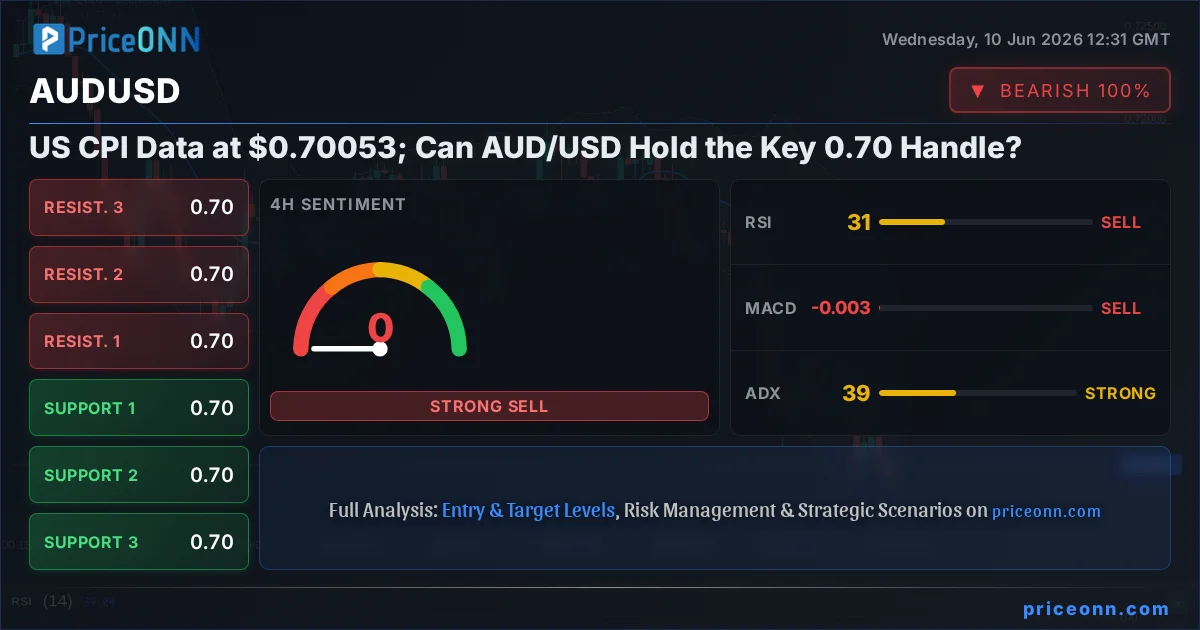
Rarely does a round number carry this much weight in the forex market. AUD/USD is pinned at $0.70053 - barely above the 0.70 psychological floor - as markets brace for the week's most consequential data release: US Consumer Price Index. The AUDUSD today analysis reveals a pair under relentless pressure, with sellers firmly in control across every major timeframe and bulls searching for any technical reason to step in before the data hits.
- AUD/USD at $0.70053 sits just $0.00007 above the critical 4H support level at $0.70046 - a near-term floor that could give way on a hot CPI print.
- ADX at 39.39 on the 4H chart confirms institutional-grade downtrend momentum; this is not a soft drift lower but a committed sell-side push.
- RSI at 30.64 on the 1H and 30.69 on the 4H is approaching oversold territory, raising the probability of a technical relief bounce before any deeper breakdown.
- All 8 of 8 technical indicators on the 4H chart are aligned bearish - a rare confluence that reflects genuine directional conviction, not noise.
Time Horizon: This AUDUSD support and resistance analysis is primarily structured for 4H to daily swing trade horizons, with 1H signals used for entry refinement and timing.
The Battle Lines: What $0.70053 Really Means
The 0.70 handle in AUD/USD is not just a round number. It is a reference point that generations of traders have used as a barometer for the Australian dollar's relative health. When this pair trades above 0.70, the narrative tends to be constructive - risk appetite is decent, commodity prices are supportive, and China's economy is pulling its weight. When it trades below, the conversation shifts to structural concerns about the currency's long-term positioning.
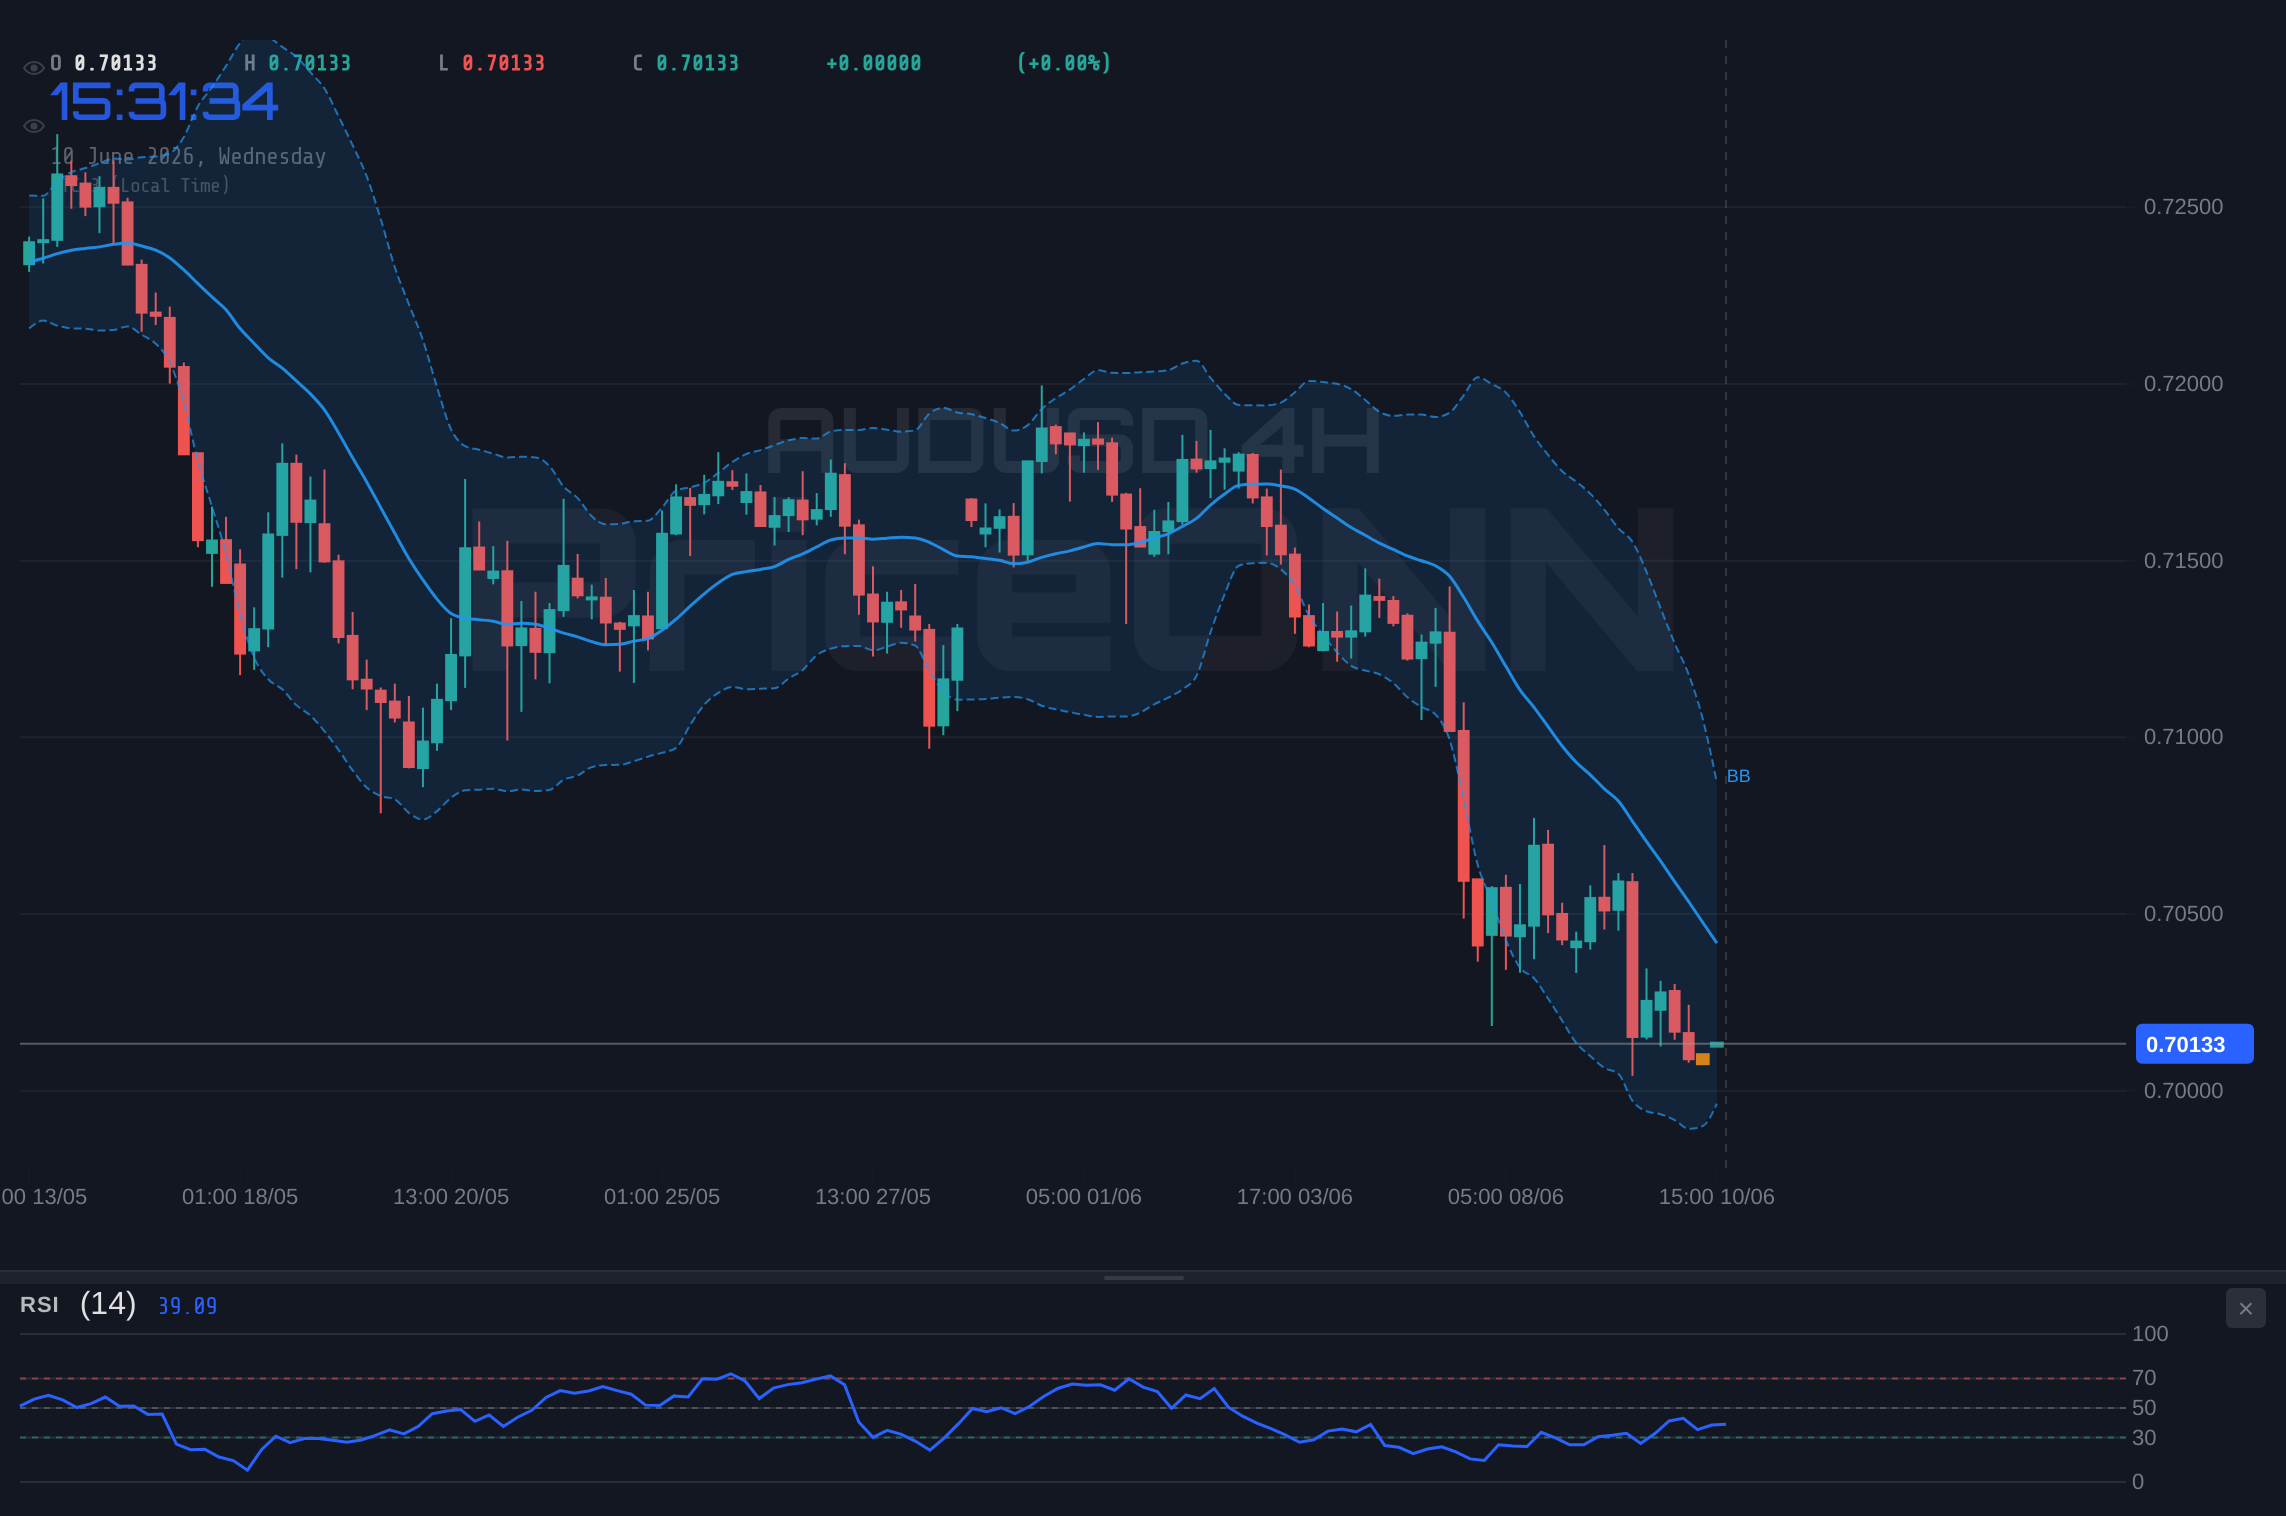
Right now, AUD/USD is at $0.70053. That is not below 0.70, but it is close enough that the psychological pressure is palpable. The daily session range of $0.70042 to $0.70695 tells the story succinctly: bulls attempted a recovery toward $0.70695, sellers rejected the move decisively, and price has been pulled back toward the lows. The bears are not just present - they are in charge of the narrative heading into this week's inflation test.
What makes this setup particularly significant is the confirmation from price action that the first layer of support has already been taken out. The 1H S1 at $0.70071 and the 4H S1 at $0.70107 are now both above current price - meaning that former support zones have been breached and are now acting as overhead resistance. Price is currently wedged between the 1H second support at $0.70038 and the 4H second support at $0.70046. This is not a comfortable place for longs to be sitting, and AUDUSD volatility analysis suggests the compression at these levels typically precedes a directional resolution rather than a prolonged range.
The Bull Case; Why the Australian Dollar Could Still Bounce
Let's be direct: the bull case for AUD/USD right now is not built on strength. It is built on exhaustion. And in forex trading, sometimes that is enough to produce a tradable move.
On the 1H chart, RSI has dropped to 30.64 - not yet technically oversold (below 30), but approaching the zone that historically precedes short-covering relief rallies in downtrending pairs. Pair this with the 4H RSI at 30.69 - also pressing toward oversold - and you have a situation where two major timeframes are simultaneously signaling seller fatigue. When both timeframes approach oversold at the same price zone, the statistical probability of at least a short-term bounce improves meaningfully. Historically, when AUDUSD RSI readings have compressed to these levels on multiple timeframes simultaneously, the pair has produced relief rallies of 30 to 80 pips before the primary trend resumed.
The 1H Stochastic with K at 19.69 and D at 26.43 reinforces this picture. Both K and D are in deeply depressed territory, and while K remains below D - confirming continued sell pressure - the absolute levels suggest there is limited downside momentum left without a fresh fundamental catalyst. Shorts who entered at higher levels are starting to see diminishing returns on their positions, and some will be tempted to take profits ahead of high-impact data.
Then there is the DXY angle. The Dollar Index at $99.71 is fractionally lower on the day and - critically - remains below the 100 psychological barrier. Despite DXY's 1H and 4H buy signals, its failure to break cleanly above 100 is a subtle constraint on dollar bulls. If the upcoming US CPI print disappoints expectations and comes in softer than forecast, the market would likely initiate a round of profit-taking on long dollar positions. AUD/USD would benefit disproportionately given how severely it has been sold into this data event - the asymmetry of a short squeeze from oversold levels should not be underestimated.
From a macro perspective, the Reserve Bank of Australia has maintained a hawkish-leaning posture relative to some of its peers. The RBA has not rushed to cut rates, and any signal of Chinese economic resilience - Australia's single largest trading partner - would provide the Aussie with a fundamental floor. For the moment, bulls are outnumbered and outgunned, but they have not entirely vacated the field. The $0.70046 to $0.70053 zone is a legitimate line where contrarian buyers might test their conviction.
The Bear Case; Why the Sellers Hold the Structural Edge
This is where the AUDUSD trend analysis becomes uncomfortable for bulls, and the numbers are genuinely difficult to argue with.
ADX at 39.39 on the 4H chart is not an ambiguous reading. A value above 25 confirms an active trend; above 40 signals institutional participation and commitment. At 39.39 - essentially knocking on the door of the 40 threshold - the bears are not just pressing a short-term trade. They are expressing a structural view on the Australian dollar with real capital behind it, and that means oversold RSI readings can persist far longer than traditional traders expect before producing a genuine reversal. The trend has momentum that is difficult to counter with technical signals alone.
The MACD on the 4H timeframe tells the same story: negative momentum, histogram below the signal line, and no bullish divergence to speak of. On the daily chart, the picture is even cleaner - MACD is in negative territory, Stochastic K sits at a devastatingly low 9.06 versus D at 37.85, and the Bollinger Bands show price trading below the lower band. When price prints below the lower Bollinger Band on a daily chart while the Stochastic is in the single digits, the chart is communicating systematic liquidation, not a routine correction that a quick bounce can repair.
The catalyst that could accelerate all of this is no mystery. According to recent coverage from Investing.com, 'AUD/USD Faces 0.70 Breakdown If US Core CPI Tops 3%.' The logic is mechanical: a hot inflation print forces Fed funds futures to reprice rate cut expectations, pushes Treasury yields higher, and strengthens the dollar broadly. In that scenario, the 4H second support at $0.70046 becomes a speed bump rather than a floor, and the move toward $0.69949 and eventually $0.69561 opens up with momentum. Per reporting from Bloomberg and Reuters, this week's CPI release is being treated as a pivotal binary event for dollar positioning across the G10.
The aggregate AUDUSD trading signals confirm the bear's case with unusual clarity. On the 4H timeframe: all 8 indicators registering sell signals, zero buys. The daily chart: 7 sells versus 1 buy. The 1H timeframe: 8 sells, zero buys. This kind of cross-timeframe unanimity is rare and significant. It tells you the market has made a directional decision and is communicating it loudly. The 4H downtrend strength at 95% and daily downtrend at 100% using AI technical analysis tools underscores that this is not a case of conflicting signals requiring complex interpretation.
Trading AUD/USD through high-impact US CPI data carries elevated volatility risk. Intraday swings of 50 to 100 pips in the 30 minutes following the release are common. Reduced position sizing and hard stops defined before the data release are strongly advisable.
Why the 4H Chart Is the Tiebreaker in This Bull vs Bear Debate
When short-term and longer-term signals conflict, the 4H chart frequently provides the clearest verdict for swing traders. And what the 4H AUDUSD price action analysis is showing right now is a pair sitting in structural no man's land - with every technical gate either already broken to the downside or clearly defined as the next battleground.
Price at $0.70053 sits between the 4H first support at $0.70107 (already broken - now resistance) and the 4H second support at $0.70046 (the next key level). The 4H Bollinger Bands show price below the middle band, confirming the ongoing bearish bias. A retest of the Bollinger middle band would require a recovery to approximately the $0.70265 area - which happens to coincide exactly with the 4H first resistance level. That is not a coincidence; it is confluence that defines the bull's first real target if they manage any kind of short-covering rally.
To flip the short-term technical picture, bulls need one thing above all else: a clean 4H candle close above $0.70265. Until that happens, every bounce into the $0.70071 to $0.70179 zone should be evaluated as a potential short entry opportunity for traders following the AUDUSD key levels framework. A failure to reclaim $0.70265 on the 4H chart would represent a classic lower-high structure, confirming that sellers are using each recovery to reload short positions at better levels - a pattern that has been playing out systematically throughout this decline.
The ADX on the daily chart at 24.38 is worth examining separately. While confirming a moderate trend, it is lower than the 4H ADX at 39.39, suggesting the daily trend is less mature than the 4H trend. In practical terms: the intermediate-term (4H) move is more aggressive than daily signals alone would suggest, but the daily structure is not yet at full commitment levels. This creates a window - however narrow - for a meaningful intraday bounce before the primary bearish structure fully reasserts itself through the 0.70 floor.
Three Paths for AUD/USD This Week
Bearish Scenario; The CPI Breakdown Play
65% ProbabilityNeutral Scenario; Pre-CPI Holding Pattern
20% ProbabilityBullish Scenario; Soft CPI Relief Rally
15% ProbabilityDXY at $99.71 and the Correlation Every AUD/USD Trader Must Track
No AUDUSD market sentiment analysis is complete without examining the Dollar Index, and right now DXY at $99.71 is sending a clear and consistent message. Despite trading marginally lower on the session, the DXY's technical structure is firmly bullish across multiple timeframes. On the daily chart, the DXY is generating 8 buy signals versus 0 sells, with ADX at 23.43 confirming a building uptrend with increasing structural strength. On the 1H and 4H charts, buy signals similarly dominate the picture. The dollar is not collapsing - it is consolidating below the 100 barrier before what many anticipate could be a CPI-driven push above that psychologically significant threshold.
For AUD/USD traders, the implication is direct and unavoidable. Every percentage point of DXY strength historically translates into material pressure on the Australian dollar, particularly when risk assets are also fragile. The SP500 at $6,572.87 is up +0.74% intraday, but its daily chart shows 5 of 7 indicators bearish - meaning the short-term bounce in equities has not materially shifted the medium-term risk-off tone. More telling is the Nasdaq 100 at $28,640.38, down -2.55% on the session - a loss of 750 points in a single day - with 4H ADX at 36.85 confirming a committed intermediate downtrend in technology stocks. When tech falls and the dollar strengthens simultaneously, the Australian dollar tends to suffer disproportionately relative to its G10 peers.
Brent crude at $94.96, down -1.66% on the session, adds another dimension to this analysis. Australia's export economy is heavily weighted toward raw materials and commodity exports. Softer energy and commodity prices reduce the perceived value of Australian export income, lower demand for Australian dollars from foreign buyers, and create a structural fundamental headwind for the currency. The commodity pressure and dollar strength are converging on AUD/USD from two separate directions simultaneously - a rare alignment that amplifies the technical bear signals rather than contradicting them.
Traders running AUDUSD breakout strategies should recognize that the confluence of a technically bullish DXY consolidating below 100, a fragile equity environment, and weak commodity prices creates an unusually clear directional setup. When macro fundamentals and multi-timeframe technical signals agree this clearly, the probability of a sustained directional move - rather than a choppy reversal - increases substantially. The price action analysis pointing to 65% probability for the bearish scenario is supported by this macro backdrop in a way that adds significant conviction to the technical read.
Where the Battles Will Be Fought; AUD/USD Key Levels
Frequently Asked Questions: AUDUSD Analysis
What happens to AUD/USD if it breaks below the $0.70046 support level?
A confirmed 4H close below $0.70046 would technically clear the path to $0.69949, the third 4H support level. In a high-conviction break driven by a hot US CPI print, the decline could extend to the daily support at $0.69561 - representing a move of approximately 0.70% from the current $0.70053 level. Both targets would likely be reached within one to three trading sessions following a clean close below the floor.
Should traders buy AUD/USD at $0.70053 given the 1H RSI is approaching oversold at 30.64?
The 1H RSI at 30.64 and 4H RSI at 30.69 approaching oversold can signal short-term technical bounces, and the statistical case for a relief rally is building. However, with all 8 of 8 4H indicators aligned bearish and ADX at 39.39 confirming strong institutional downtrend momentum, counter-trend long positions carry significant risk ahead of US CPI. The safer approach is waiting for a confirmed 4H close above $0.70265 before entering long, with $0.70017 as a hard stop on any position.
Why does the ADX reading of 39.39 suggest the AUDUSD downtrend is more reliable than the oversold RSI signals?
ADX measures trend strength rather than direction, and at 39.39 it signals institutional capital is driving the current downtrend - not just retail momentum. In strong-trend environments where ADX exceeds 25, oversold RSI readings frequently persist for extended periods because institutional sellers continue pressing on every bounce, keeping the pair from staging meaningful reversals. The 8/8 bearish signal alignment combined with ADX at 39.39 makes this one of the higher-conviction bearish setups currently visible across G10 forex pairs.
How will the upcoming US CPI data affect AUD/USD given its current position at $0.70053?
US CPI is this week's defining binary catalyst for AUD/USD. A Core CPI print above 3% would strengthen the dollar - DXY is already generating daily buy signals at $99.71 - and would likely trigger a decisive break below $0.70046 toward $0.69949. A softer-than-expected reading would prompt dollar profit-taking and could push AUD/USD toward 4H resistance at $0.70265. The pair's position just $0.00007 above the $0.70046 floor makes the data release unusually consequential for short-term direction and risk management.
The next 48 hours will deliver the verdict on the 0.70 standoff. The levels are defined, the catalyst is known, and the technical AUDUSD trading signals are unusually aligned. Whether the CPI data confirms the bears' thesis or hands the bulls an unexpected lifeline, traders who have mapped their key levels and defined their risk parameters ahead of time will have a structural advantage over those reacting in the moment. Discipline, preparation, and respect for the data - that is the framework that turns market volatility into opportunity rather than loss.
Track markets in real-time
AI-powered analysis, technical indicators and real-time price data.
Join Our Telegram Channel
Breaking market news, AI analysis and trading signals instantly.
Join Channel