The Australian Dollar against the US Dollar (AUDUSD) is currently teetering at the crucial $0.69979 level, a price point that's attracting significant attention as the prevailing bearish trend shows signs of deepening. With the latest market data revealing a strong downtrend across multiple timeframes and a backdrop of rising inflation fears, traders are closely watching to see if this support holds or if the downward momentum will accelerate. This analysis dives deep into the technical indicators, key price levels, and the broader market sentiment to decipher the AUDUSD's immediate future.
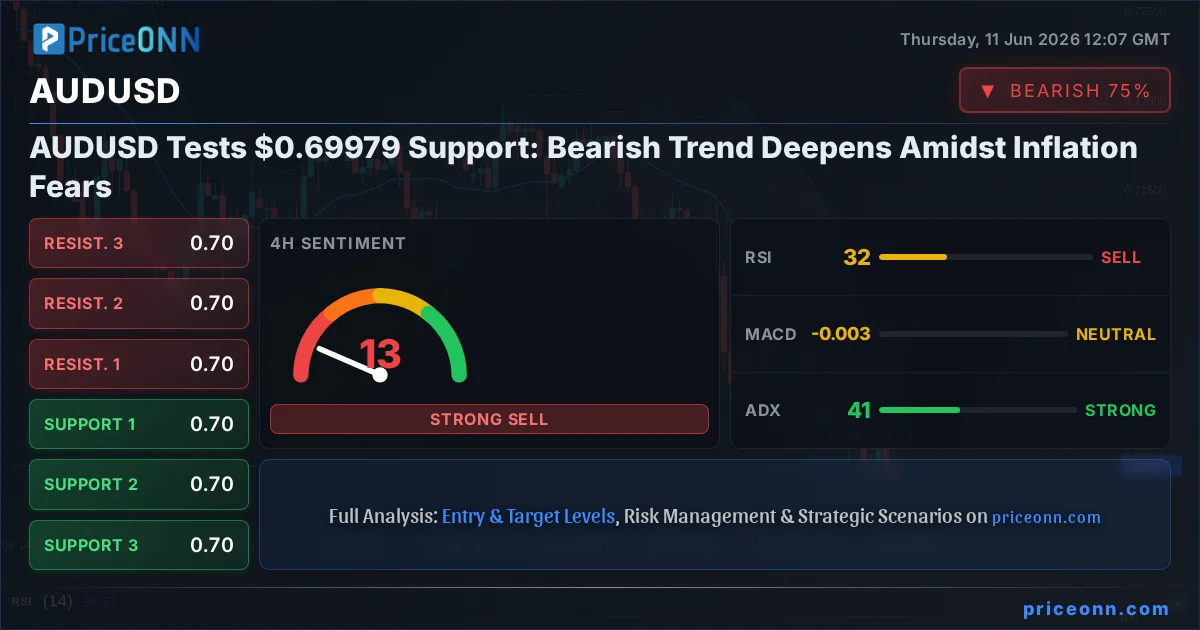
- AUDUSD is trading at $0.69979, testing a key support level amid a strong bearish trend.
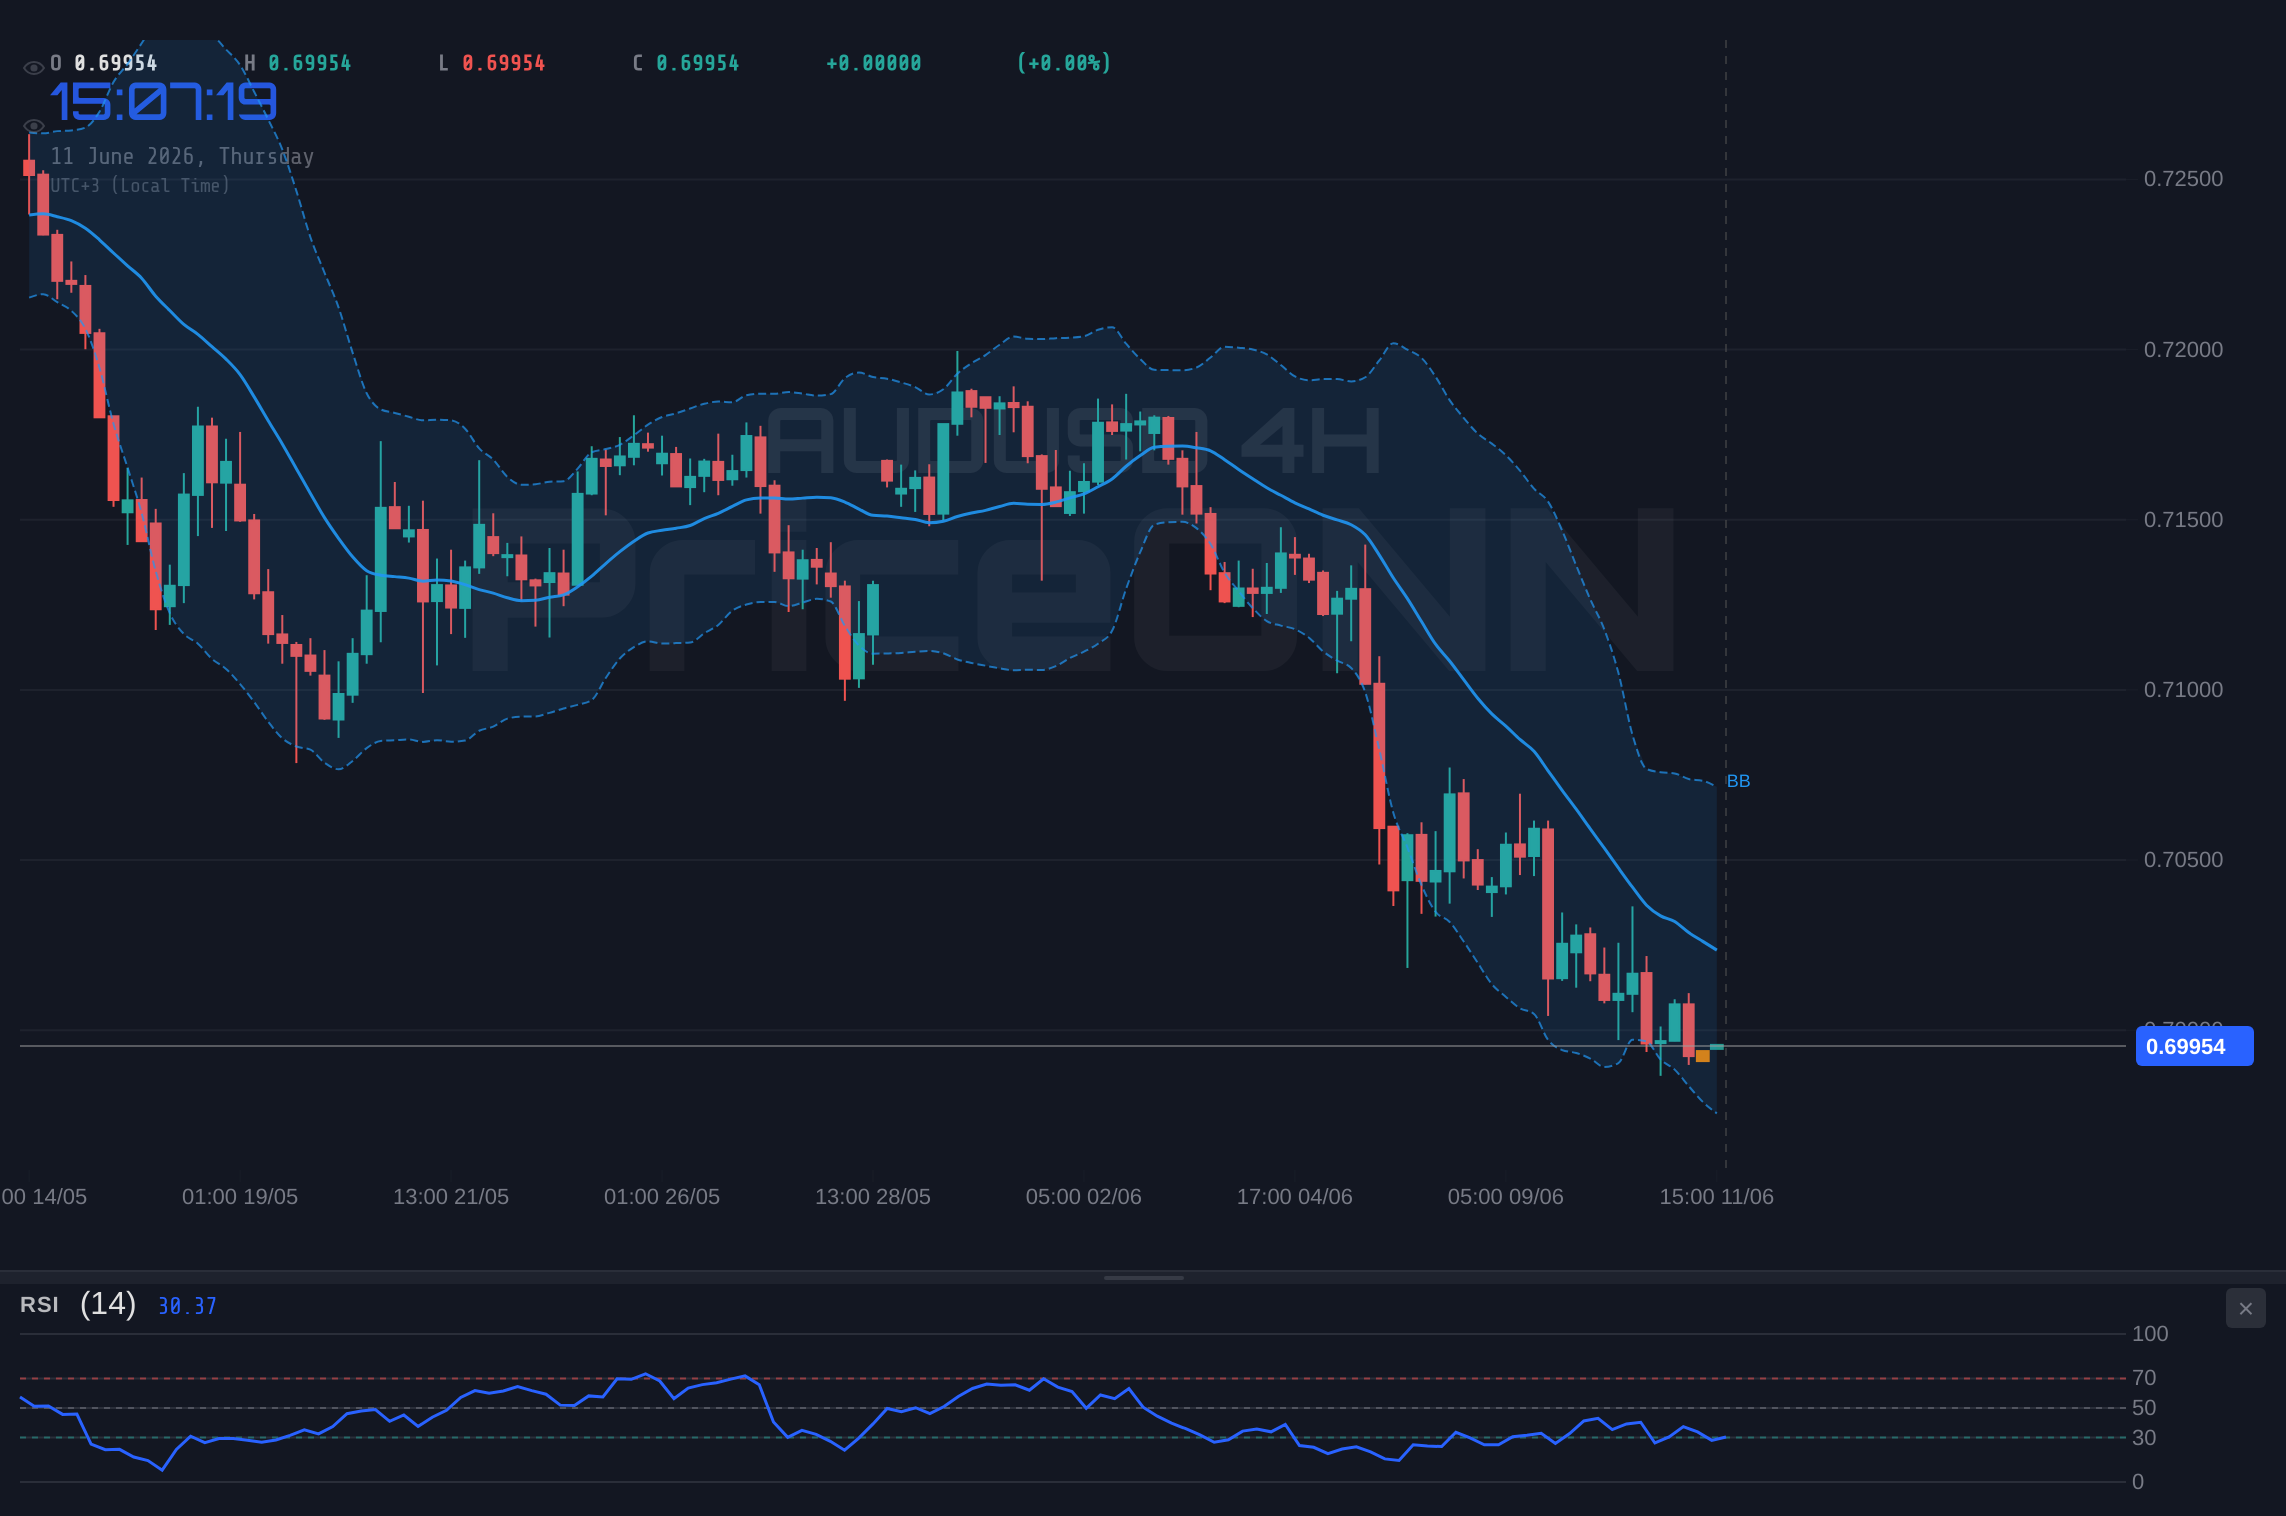
- The 4-hour chart shows a strong downtrend (ADX 45.38), with RSI at 32.93 indicating room for further decline.
- Key support levels are identified at $0.69966, $0.69677, and $0.69313, while resistance looms at $0.70619.
- The deepening downtrend on AUDUSD is influenced by a broader risk-off sentiment and the strengthening US Dollar Index (DXY) which is currently at 99.8.
Navigating the Bearish Tide: AUDUSD's Current Technical Landscape
The AUDUSD pair is currently entrenched in a significant downtrend, a narrative strongly supported by the technical indicators across various timeframes. On the 1-hour chart, while the trend is marked as neutral with a power of 50%, the ADX at 27.06 suggests a moderately strong trend, leaning towards bearish. The RSI(14) sits at 42.12, indicating a bearish bias without being oversold, while Stochastic shows a bearish signal (%K
As we zoom out to the 4-hour timeframe, the bearish conviction becomes much clearer. The trend is unequivocally in the 'Düşüş' (Downtrend) category, with a power of 100%. The ADX reading of 40.81 confirms a strong downtrend, a significant figure suggesting that momentum is firmly in the hands of the sellers. The RSI(14) is at 31.73, deep in neutral territory but with clear room to fall further before hitting oversold conditions, reinforcing the bearish outlook. Stochastic, however, provides a slight counter-signal with %K (22.47) crossing above %D (17.69), hinting at a potential, albeit weak, upward correction or at least a pause in the selling pressure. Yet, the Bollinger Bands remain below the middle band, and the overall signal is a strong 'SAT' (SELL) with 6 'SELL' signals against 1 'BUY'. This reinforces the dominance of the bears in the medium term.
On the daily chart, the AUDUSD's plight is starkly illustrated. The trend is overwhelmingly 'Düşüş' (Downtrend) with 98% power. The ADX at 26.38, while lower than the 4-hour, still signifies a strong trend, indicating that the downward move has substantial backing. The RSI(14) is at 33.95, firmly in neutral territory and suggesting ample room for further downside before reaching oversold conditions. The Stochastic indicator is showing a clear 'SELL' signal with %K (8.53) below %D (26.7), a potent warning for bulls. The Bollinger Bands are hugging the lower band, a classic sign of strong bearish momentum or an oversold condition that could lead to a bounce, but the prevailing trend is down. The overall signal remains a strong 'SAT' (SELL), with 7 'SELL' signals versus just 1 'BUY'. This consistent bearish sentiment across timeframes paints a clear picture: the path of least resistance for AUDUSD remains downwards.
Key Levels and Potential Price Action
The current price of AUDUSD at $0.69979 is a critical juncture. Looking at the provided support levels, the immediate floor is at $0.69966. A break below this level would be a significant bearish confirmation, potentially triggering further selling towards the next support at $0.69677. Should the downward momentum persist, the third key support level lies at $0.69313. These levels are not just arbitrary lines on a chart; they represent areas where, historically, buying interest has emerged or selling pressure has eased. However, with the current strong bearish trend indicated by the ADX and RSI readings, these support levels are being tested with considerable force.
On the resistance side, the immediate hurdle for any potential upward retracement is at $0.70619. A sustained move above this level would be the first sign that the bearish trend might be faltering, potentially opening the door for a test of the subsequent resistance at $0.70983. The R3 resistance level is set at $0.71272. These resistance levels represent areas where selling pressure is expected to intensify, capping any rallies and potentially reinforcing the downtrend. For the bears to remain in control, price action must stay below these resistance zones, particularly the R1 level.
Correlation Analysis: DXY and Market Sentiment
The US Dollar Index (DXY) is currently trading at 99.8, showing a slight increase (0.08%) and maintaining a generally upward trend. This strengthening dollar often acts as a headwind for riskier assets and commodity-linked currencies like the Australian Dollar. With the DXY hovering near its recent highs, it reinforces the bearish outlook for AUDUSD. A higher DXY typically means that US dollar-denominated assets are becoming more attractive, leading investors to divest from currencies like the AUD. The correlation is quite direct: as the dollar strengthens, AUDUSD tends to fall, and vice-versa. The current DXY level of 99.8 suggests that the dollar is still in a strong position, providing continued pressure on AUDUSD.
The broader market sentiment, as indicated by the SP500 and Nasdaq indices, also plays a crucial role. The SP500 is showing a moderate increase of 0.74% to 6572.87, while the Nasdaq 100 is down 0.74% to 28880.13. This divergence suggests a mixed risk appetite, but the slight weakness in Nasdaq, a tech-heavy index often sensitive to risk sentiment, could be interpreted as a cautious undertone. A decline in risk appetite typically favors safe-haven assets, which can indirectly support the US Dollar and put pressure on riskier currencies like the AUD. While the SP500's slight gain might offer some respite, the overall picture is not one of robust risk-on sentiment, which is generally negative for AUDUSD.
Economic Calendar: Inflation Data and Future Catalysts
The economic calendar presents a significant backdrop for AUDUSD's price action, particularly concerning inflation data. While the provided data does not show specific *actual* results for the current day's high-impact events, it highlights their importance. Upcoming inflation figures, especially from the US, are critical. The recent news mentioning that "Headline Inflation Climbs to a Three-Year High in May" and that "The Consumer Price Index (CPI) rose by 0.5% month-on-month (m/m) in May, meeting the Bloomberg consensus forecast" is highly relevant. If US core CPI were to top 3% as suggested by the news snippet "AUD/USD Faces 0.70 Breakdown If US Core CPI Tops 3%", it could significantly strengthen the US Dollar and push AUDUSD lower. Conversely, any indication of cooling inflation could provide a temporary reprieve for AUDUSD.
For the Australian economy, while specific high-impact data releases are not detailed for today, the general context of global economic conditions and commodity prices is paramount. Australia, being a major commodity exporter, is sensitive to global demand and commodity prices, particularly for iron ore and coal. A sustained downturn in commodity prices, often linked to a global economic slowdown or reduced demand from major economies like China, would further exacerbate the bearish pressure on AUDUSD. Investors will be keenly watching any further developments or forecasts related to Australian economic health and its key export markets.
Trading Scenarios and Probabilities
BEARISH SCENARIO: Trend Continuation
65% ProbabilityNEUTRAL SCENARIO: Consolidation and Divergence
25% ProbabilityBULLISH SCENARIO: Support Hold and Reversal
10% ProbabilityThe Road Ahead: What to Watch for AUDUSD Traders
The AUDUSD is currently at a critical juncture, with the bears firmly in control as indicated by the strong downtrend signals across multiple timeframes. The immediate focus will be on the support level at $0.69966. A decisive break below this level could accelerate the decline towards $0.69677 and potentially $0.69313. The strengthening US Dollar, evidenced by the DXY's position at 99.8, coupled with persistent inflation concerns, continues to exert downward pressure. Traders should pay close attention to upcoming US economic data, particularly inflation reports, as these could serve as catalysts for further USD strength or provide a brief respite for AUDUSD.
On the flip side, any sustained move above the $0.70619 resistance level, especially on significant volume and accompanied by positive divergence in oscillators like RSI or Stochastic, could signal a short-term bottom. However, given the overwhelming bearish technical setup, such a move would be considered a lower probability scenario. The ADX readings across timeframes consistently point to a strong trend, suggesting that any retracements might be short-lived unless fundamental drivers shift dramatically.
For those considering positions, a close below $0.69966 on the 4-hour chart would likely confirm the continuation of the downtrend, making short positions attractive with targets at $0.69677 and $0.69313. Conversely, any bullish scenario would require confirmation through a break of resistance levels and signs of trend exhaustion. Risk management remains paramount; setting tight stop-losses below key support levels for short positions, or above resistance for potential long entries, will be crucial in navigating this volatile environment. The market is currently favouring sellers, and until there is a clear shift in trend or fundamental catalysts, the path of least resistance for AUDUSD appears to be downwards.
| Indicator | Value | Signal | Interpretation |
|---|---|---|---|
| RSI (14) | 31.73 | Bearish | Room to fall before oversold, supports downtrend. |
| MACD Histogram | -0.0002 | Bearish | Negative momentum persists. |
| Stochastic (%K > %D) | 22.47 / 17.69 | Bullish | Potential short-term bounce signal, but weak in strong trend. |
| ADX | 40.81 | Strong Trend | Confirms a powerful downtrend. |
| Bollinger Bands | Below Middle Band | Bearish | Downward price pressure. |
Frequently Asked Questions: AUDUSD Analysis
What happens if AUDUSD breaks below the $0.69966 support level?
A break below $0.69966 would likely trigger further selling pressure, confirming the bearish trend. The next key targets would be $0.69677 and potentially $0.69313, as indicated by the technical analysis. This scenario is considered the most probable, with a 65% likelihood.
Should I consider buying AUDUSD at current levels around $0.69979, given the Stochastic signal?
While the Stochastic indicator shows a potential short-term bounce signal (%K > %D), the overall trend remains strongly bearish with ADX at 40.81. A bullish scenario is low probability (10%) and would require strong confirmation, such as a sustained close above $0.70619. Buying at current levels without further confirmation carries significant risk.
Is the RSI at 31.73 on the 4-hour chart a sell signal for AUDUSD?
An RSI reading of 31.73 is considered neutral but trending downwards, supporting the bearish outlook. It's not yet in the oversold territory (typically below 30), suggesting there is still room for the price to fall further before a significant bounce might occur. This reading aligns with the strong downtrend.
How might upcoming US inflation data impact AUDUSD trading near $0.69979?
Higher-than-expected US inflation data could strengthen the US Dollar, pushing AUDUSD below $0.69966 towards lower support levels. Conversely, cooler inflation might offer temporary USD weakness and a potential bounce for AUDUSD, though the strong bearish trend might limit upside potential.
Track markets in real-time
AI-powered analysis, technical indicators and real-time price data.
Join Our Telegram Channel
Breaking market news, AI analysis and trading signals instantly.
Join Channel