The precious metal, currently trading at $4,192.58, finds itself at a pivotal moment. While recent inflation data might suggest a tailwind for gold as a traditional inflation hedge, the complex interplay of macroeconomic factors, central bank policies, and shifting risk sentiment paints a more nuanced picture. This analysis delves into the current technical landscape, explores the correlation with key global markets like the US Dollar Index (DXY) and major equity indices, and assesses the potential scenarios that could shape gold's trajectory in the coming days. Understanding these dynamics is crucial for traders navigating the volatile commodity markets.
- RSI at 67.3 signals overbought pressure on the 1H chart, suggesting potential short-term cooling for XAUUSD.
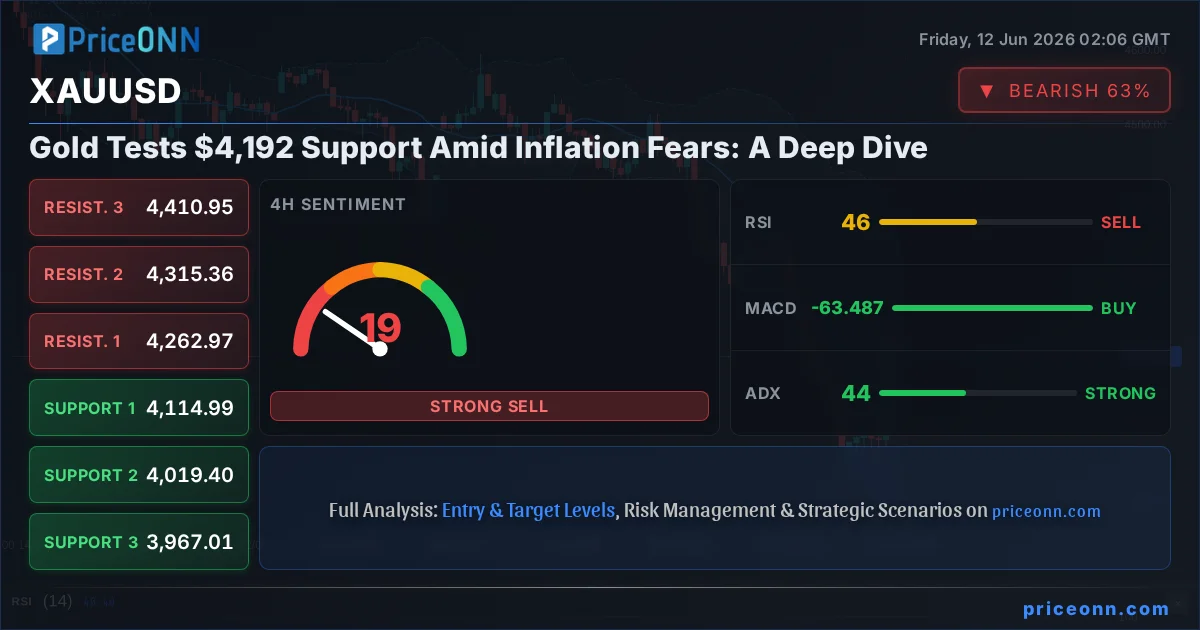
- Critical support sits at $4,195.51, tested multiple times in the last 24 hours, acting as a crucial line in the sand.
- The ADX at 44.11 on the 4H chart indicates a strong trend, though conflicting signals from other indicators warrant caution.
- DXY strength, currently at 99.86, is exerting pressure on gold, highlighting the inverse relationship between the dollar and the precious metal.
The recent surge in gold prices, pushing the metal to $4,192.58, has captured market attention. This upward momentum, however, is being met with significant headwinds. On the 1-hour timeframe, the Relative Strength Index (RSI) at 67.36 hovers near overbought territory, hinting that the recent bullish push might be losing steam. While not an immediate sell signal, it suggests that any further upside may be met with increased selling pressure, particularly if key resistance levels are challenged without sufficient conviction. The MACD on this timeframe remains positive, sitting above its signal line, which supports the ongoing uptrend for now, but traders are keenly watching for any signs of MACD histogram contraction.
Furthermore, the Stochastic Oscillator on the 1-hour chart presents a potential divergence, with the %K line at 77.82 falling below the %D line at 89.49. This 'death cross' in the Stochastics can sometimes precede a short-term pullback or consolidation. The ADX, however, at 31.54, still points to a strong trending environment, complicating the picture. This creates a classic scenario of conflicting signals, where traders must weigh the immediate overbought conditions against the underlying trend strength. The overall signal for the 1H timeframe leans towards 'BUY' (6 Buy, 2 Sell, 0 Neutral), but the nuances of the indicators suggest caution is warranted for aggressive long positions at these elevated levels.
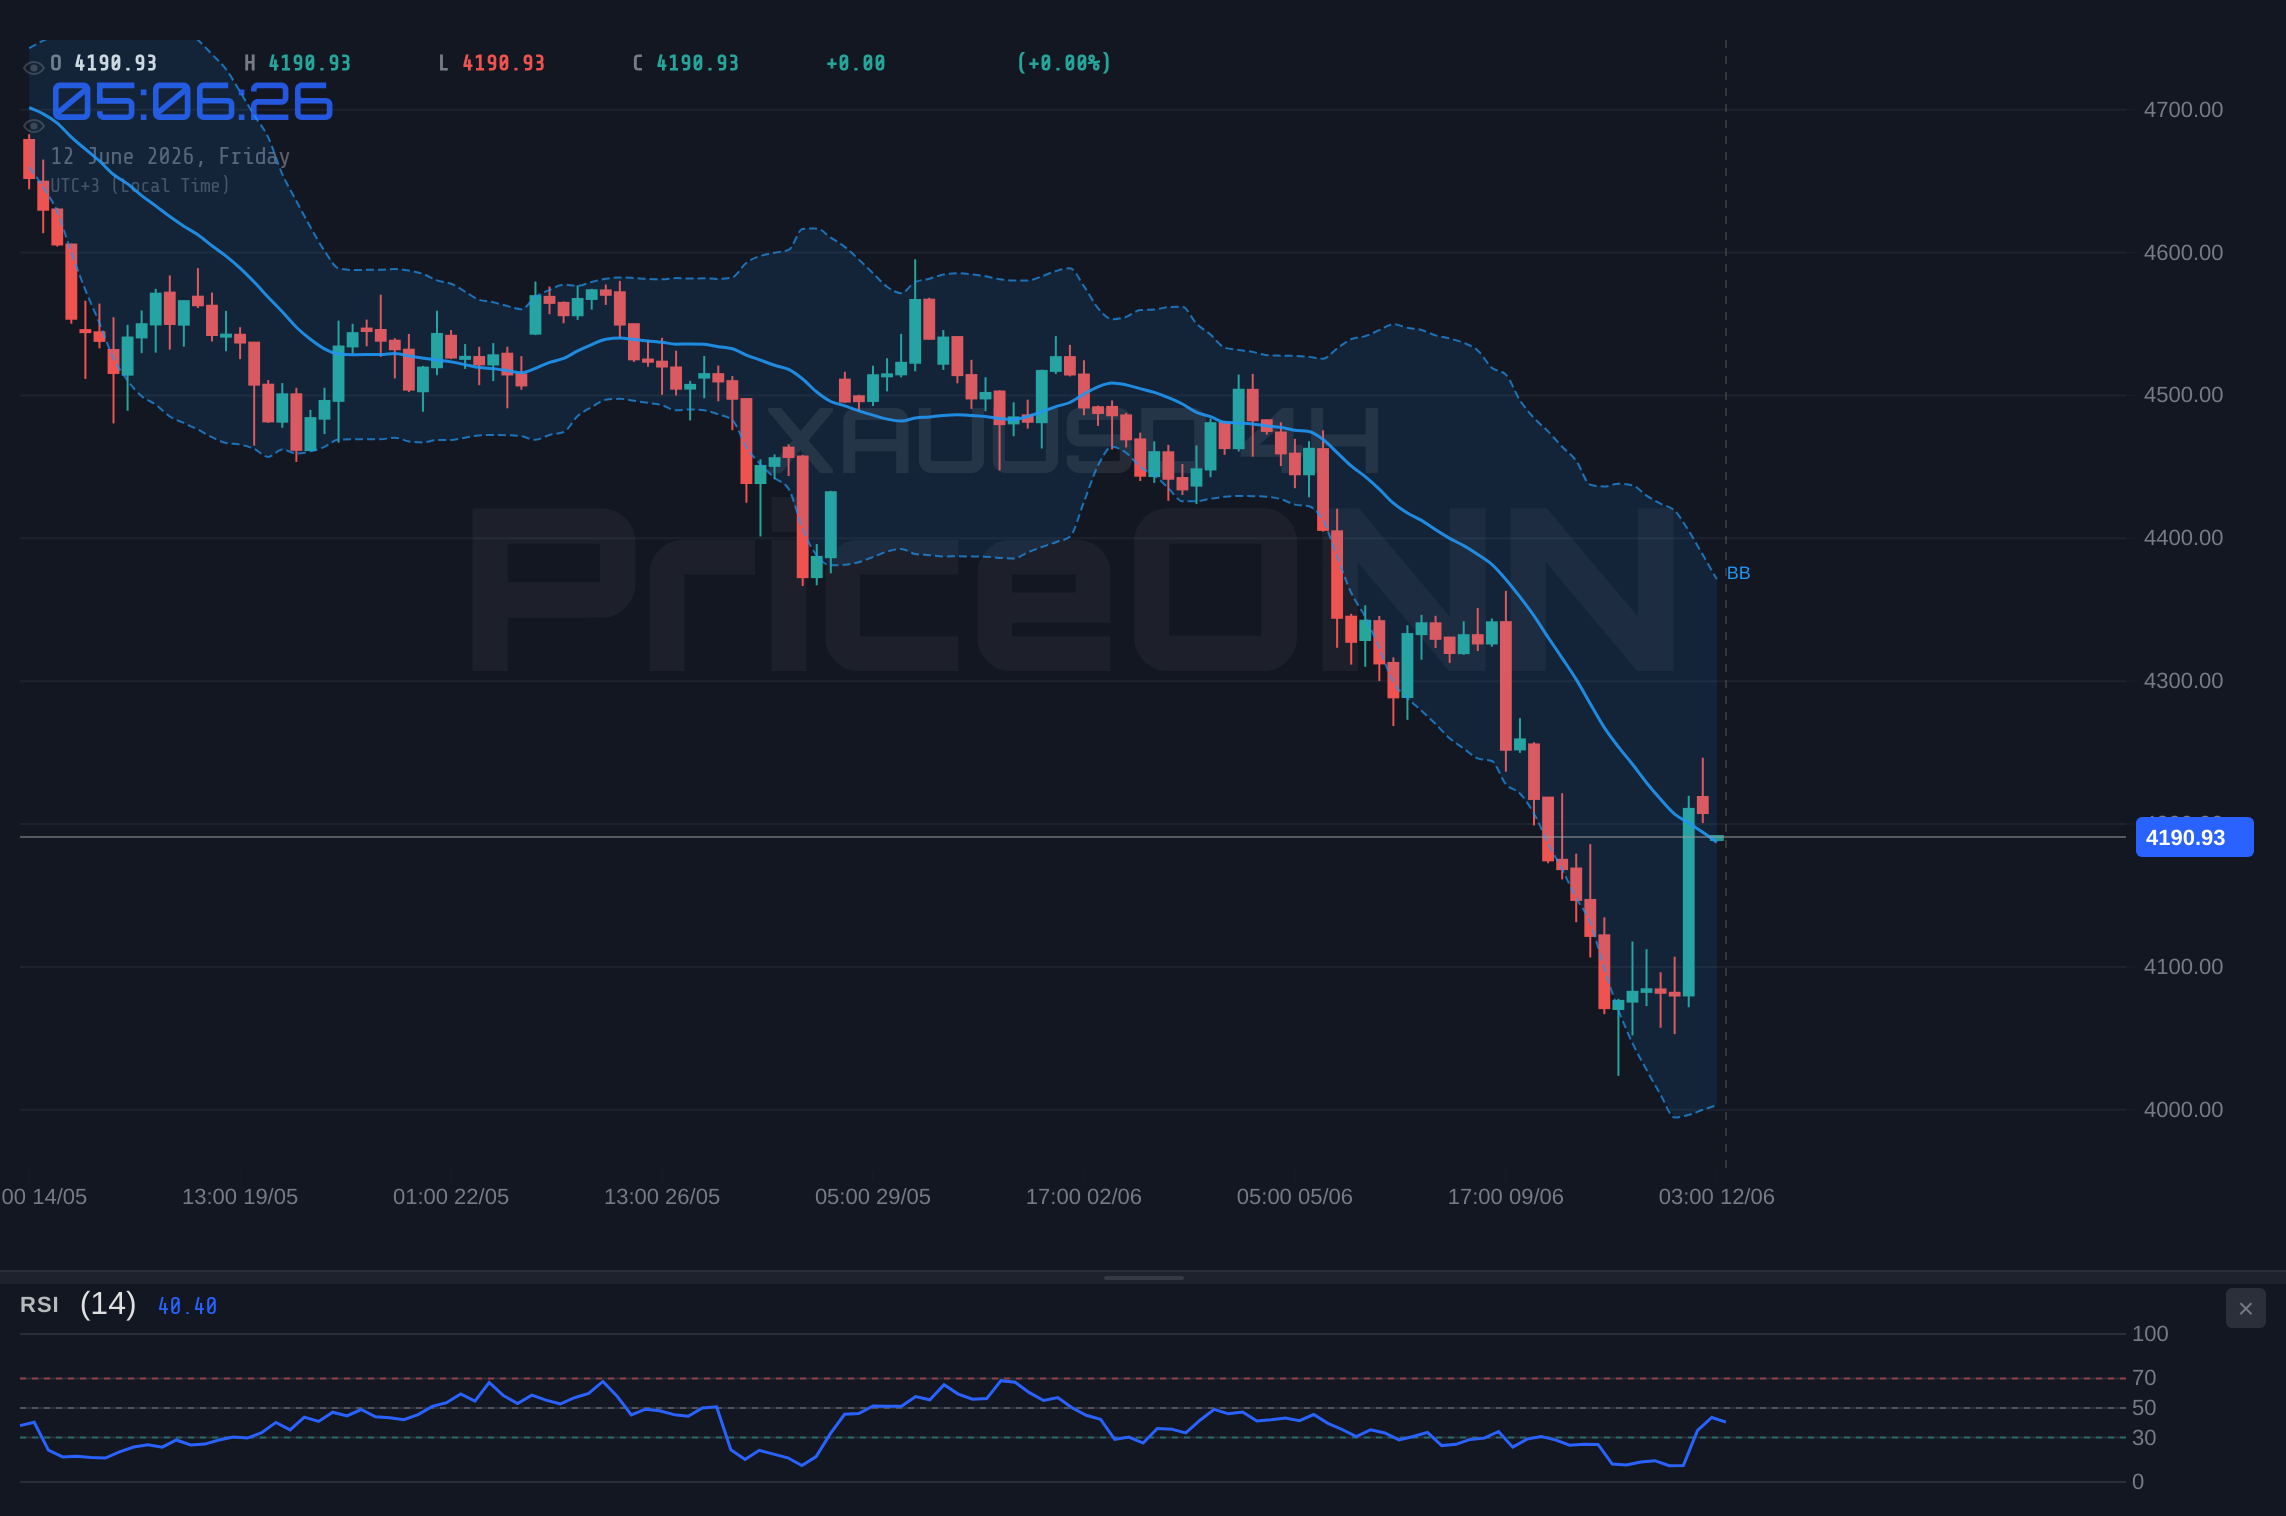
Shifting to the 4-hour timeframe, the technical picture for XAUUSD becomes more complex, reflecting a market in transition. The RSI here stands at 45.84, indicating a neutral stance with a slight downward bias, a stark contrast to the 1-hour chart's overbought conditions. This divergence across timeframes is typical during periods of market consolidation or indecision. The MACD on the 4-hour chart also shows positive momentum, still above the signal line, but its histogram is relatively flat, suggesting a lack of strong conviction. The Bollinger Bands are positioned below the middle band, indicating a bearish lean on this timeframe, further adding to the conflicting signals.
The Stochastic Oscillator on the 4-hour chart is more encouraging for bulls, with the %K line at 66.52 above the %D line at 34.47, suggesting potential upward momentum. However, the ADX value of 44.11 is a significant factor. This reading signifies a strong trend, but the directionality on this timeframe is ambiguous given the conflicting RSI and Bollinger Band readings. The general signal for the 4-hour chart is 'SELL' (3 Buy, 5 Sell, 0 Neutral), reflecting the mixed indicators and the potential for a correction from the 1-hour's overbought state. This multi-timeframe conflict is a hallmark of markets at critical junctures, where short-term optimism clashes with longer-term caution.
The daily chart presents the most bearish outlook, reinforcing the need for caution. The RSI(14) at 34.29 is firmly in the neutral zone, with a clear downward trajectory, suggesting that the recent rally might be a mere retracement within a larger downtrend. The MACD is deeply negative, trading well below its signal line, and the histogram shows persistent bearish momentum. Bollinger Bands are also positioned below the middle band, reinforcing the bearish sentiment on the daily scale. The Stochastic Oscillator, with %K at 13.15 and %D at 21.13, is nearing oversold territory, hinting at a potential bounce, but the overall ADX of 34.06 still indicates a strong trend, albeit one that has been predominantly downwards.
The daily signal is a clear 'SELL' (0 Buy, 8 Sell, 0 Neutral), aligning with the prevailing trend. This suggests that while short-term traders might find opportunities for quick gains on the 1-hour chart, the larger trend on the daily timeframe remains a significant headwind. The conflicting signals across timeframes - bullish on 1H, mixed on 4H, and bearish on 1D - create a complex trading environment. It implies that gold is currently navigating a period of indecision, potentially reacting to disparate economic data and geopolitical developments, making it imperative for traders to employ robust risk management strategies.
Why $4,195.51 is the Line in the Sand
Critical Support and Resistance Dynamics
The immediate price action for XAUUSD is heavily influenced by key support and resistance levels. On the 1-hour chart, the first level of support is observed at $4,195.51, followed by $4,183.33 and $4,166. These levels represent areas where buying interest has previously emerged, potentially halting further declines. Conversely, resistance is building at $4,225.02, then $4,242.35, and $4,254.53. A decisive break above these resistance levels would be needed to confirm a continuation of the bullish momentum seen on the shorter timeframes. However, given the daily chart's bearish leanings, a failure to break these resistance levels could lead to a sharp reversal.
Looking at the 4-hour chart, the support levels are more substantial, found at $4,114.99, $4,019.40, and $4,000. These are levels that, if breached, could signal a more significant downtrend. Resistance on this timeframe is located at $4,262.97, $4,315.36, and $4,410.95. The current price of $4,192.58 is precariously positioned between these significant levels, highlighting the current indecision in the market. The daily chart further extends this view, with major support at $4,006.33, $3,941.47, and $3,816.02, and resistance at $4,196.64, $4,322.09, and $4,386.95.
The proximity of the current price to the $4,196.64 daily resistance level is particularly noteworthy. A close above this level on the daily chart would be a significant bullish development, potentially invalidating the bearish sentiment seen on this timeframe. Conversely, a failure to break this level, especially with the DXY showing strength, could trigger a sharp sell-off. The interplay between these multi-timeframe support and resistance levels creates a critical zone around the current trading price, making clear directional trades challenging without a decisive break or failure.
Cross-Market Correlations: DXY and Equities in Focus
The Dollar's Shadow Over Gold
The US Dollar Index (DXY) is a crucial determinant of gold's price action, and its current movement provides context. The DXY is trading at 99.86, showing a slight increase on the day. Historically, a stronger dollar tends to put downward pressure on gold prices, as gold becomes more expensive for holders of other currencies. The DXY's upward trend on the 1-day chart, with RSI at 65.47 and ADX at 25.61, suggests underlying strength that could continue to weigh on gold. If the DXY breaks through the 100.00 psychological level, it could accelerate this pressure on XAUUSD, especially if it coincides with a bearish signal on gold's daily chart.
The correlation between gold and the broader equity markets, particularly the S&P 500 and Nasdaq, also offers insights. The S&P 500 is currently trading at 6572.87, showing a strong upward move of 0.74%. The Nasdaq is also up significantly, trading at 29549.47. This risk-on sentiment in equities typically correlates inversely with gold, which often acts as a safe-haven asset during periods of market turmoil. The strong performance in stock markets suggests that immediate safe-haven demand for gold might be muted, although underlying inflation fears could still provide some support. However, if equity markets were to reverse sharply, gold could see increased demand as a refuge, provided its own technical picture allows for it.
The energy market, represented by Brent crude oil trading at $91.27, is also a key influencer. The sharp 5.81% drop in Brent prices suggests a potential cooling of inflation expectations or a shift in geopolitical risk sentiment. Lower oil prices can reduce inflationary pressures, which might lessen the appeal of gold as an inflation hedge. Conversely, any resurgence in oil prices due to geopolitical tensions could reignite inflation fears and bolster gold's safe-haven status. The current downward move in oil prices, coupled with a strengthening dollar and strong equities, creates a challenging environment for gold bulls.
Navigating the Trade: Scenarios and Strategy
Trade Plan and Outlook
Given the conflicting signals across different timeframes and the interplay of macroeconomic factors, a clear directional trade on gold requires careful consideration of risk. The 4-hour chart's ADX of 44.11 indicates a strong trend, but the direction is unclear due to mixed shorter-term and longer-term indicators. This suggests a potential range-bound market or a period of consolidation before the next significant move. The current price of $4,192.58 is caught between the immediate 1-hour bullishness and the daily bearish trend.
Bearish Scenario: The $4,195.51 Line Crumbles
65% ProbabilityNeutral Scenario: Consolidation Around $4,192
25% ProbabilityBullish Scenario: Breaking the Daily Resistance
10% ProbabilityFrequently Asked Questions: XAUUSD Analysis
What happens if XAUUSD breaks below the $4,195.51 support level?
A break below $4,195.51 on the 1-hour chart would trigger a bearish scenario. The first target would be $4,183.33, followed by $4,166.00, invalidating the trade if price closes above $4,225.02.
Should I buy XAUUSD at current levels of $4,192.58 given the mixed signals?
Given the conflicting signals across timeframes and the daily bearish outlook, buying at current levels carries significant risk. A confirmed break above $4,196.64 on the daily chart would be needed for a higher-probability bullish setup.
Is the RSI at 67.36 a sell signal for XAUUSD right now?
An RSI of 67.36 on the 1-hour chart indicates overbought conditions, suggesting potential for a short-term pullback or consolidation, not necessarily a direct sell signal on its own. Traders should look for confirmation from other indicators or price action.
How will DXY strength at 99.86 affect XAUUSD this week?
The DXY's strength at 99.86 typically exerts downward pressure on gold. If the dollar index continues its upward trend and breaks 100.00, it could exacerbate any bearish move in XAUUSD, especially if gold fails to hold its key support levels.
Track markets in real-time
AI-powered analysis, technical indicators and real-time price data.
Join Our Telegram Channel
Breaking market news, AI analysis and trading signals instantly.
Join Channel