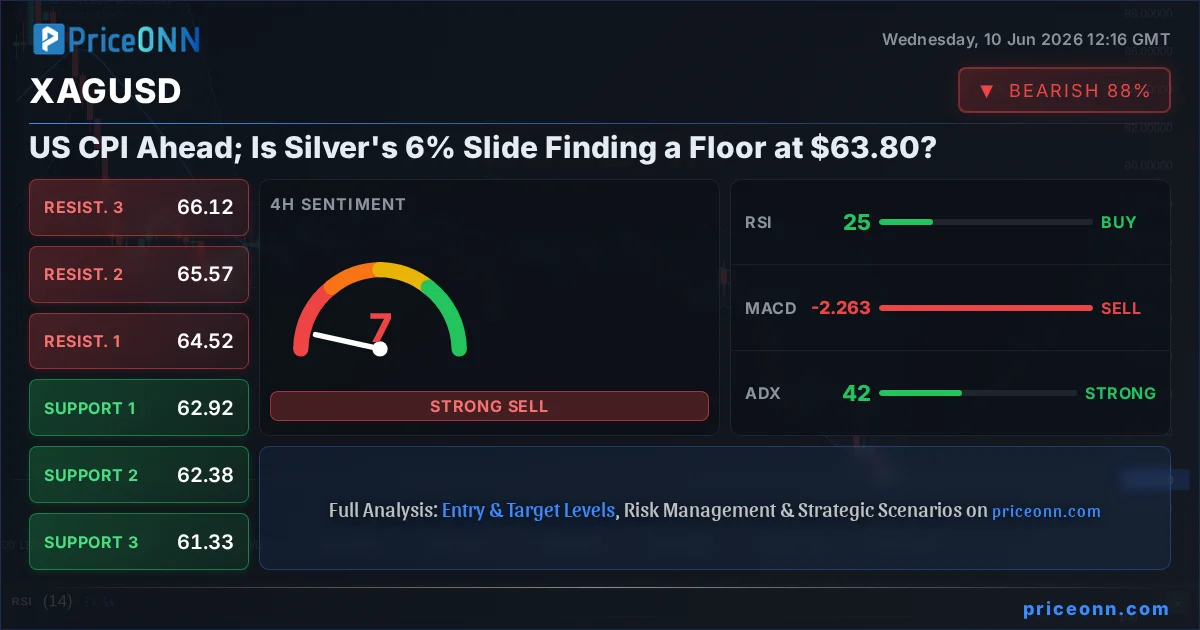
Two sessions. A 6.37% wipeout. Silver is sitting at $63.80 and the bulls are scrambling for a narrative. The metal cratered from intraday highs near $69 all the way through what were supposed to be key support zones, and the technical picture across every major timeframe is aligned in one direction. This XAGUSD today analysis tackles the only question that matters right now: is this a high-conviction trend continuation that targets $62.92 and beyond, or is an exhausted, deeply oversold market quietly coiling for a violent CPI-fuelled reversal?
- Silver (XAGUSD) is down 6.37% to $63.80, trading below even the daily session low of $64.34 - a significant structural breakdown across all timeframes.
- 4-hour RSI has collapsed to 26.56 and Stochastic %K is at an extreme 5.42, both signaling deeply oversold conditions, yet ADX at 42 confirms the downtrend remains dominant and unconvinced of a reversal.
- Nearest 4-hour support sits at $62.92; a decisive close below this level would open the path toward $62.38 and $61.33 on the extended bearish scenario.
- US CPI data is the pivotal binary catalyst this week: a hot print extends dollar strength and silver's slide, while a softer reading could ignite a short-covering rally from extreme oversold lows toward $64.52 resistance.
The Bear's Dominance; Why Every Timeframe Is Pointing Lower
The bear case for silver right now is not subtle, and it does not require creative interpretation of the data. Across the 1-hour, 4-hour, and daily timeframes, the XAGUSD trend analysis delivers sell signals with vote counts of 7-1 or 8-0 in favor of sellers on every chart. That kind of synchronized, cross-timeframe alignment does not happen by accident. It reflects genuine market conviction and a seller base that is active, coordinated, and unwilling to give ground.
Start with the 4-hour chart. ADX has climbed to 42 - firmly in the strong trend category and not showing any sign of peaking. When ADX sits at 42 and price is still falling, it tells you this is not a drift lower or a random session of profit-taking. Sellers are pressing with authority, and buyers who have tried to step in front of this move have been overwhelmed. The 4-hour MACD histogram remains negative, sitting below the signal line, confirming that downside momentum has not shifted structurally. Every attempted bounce has faded quickly.
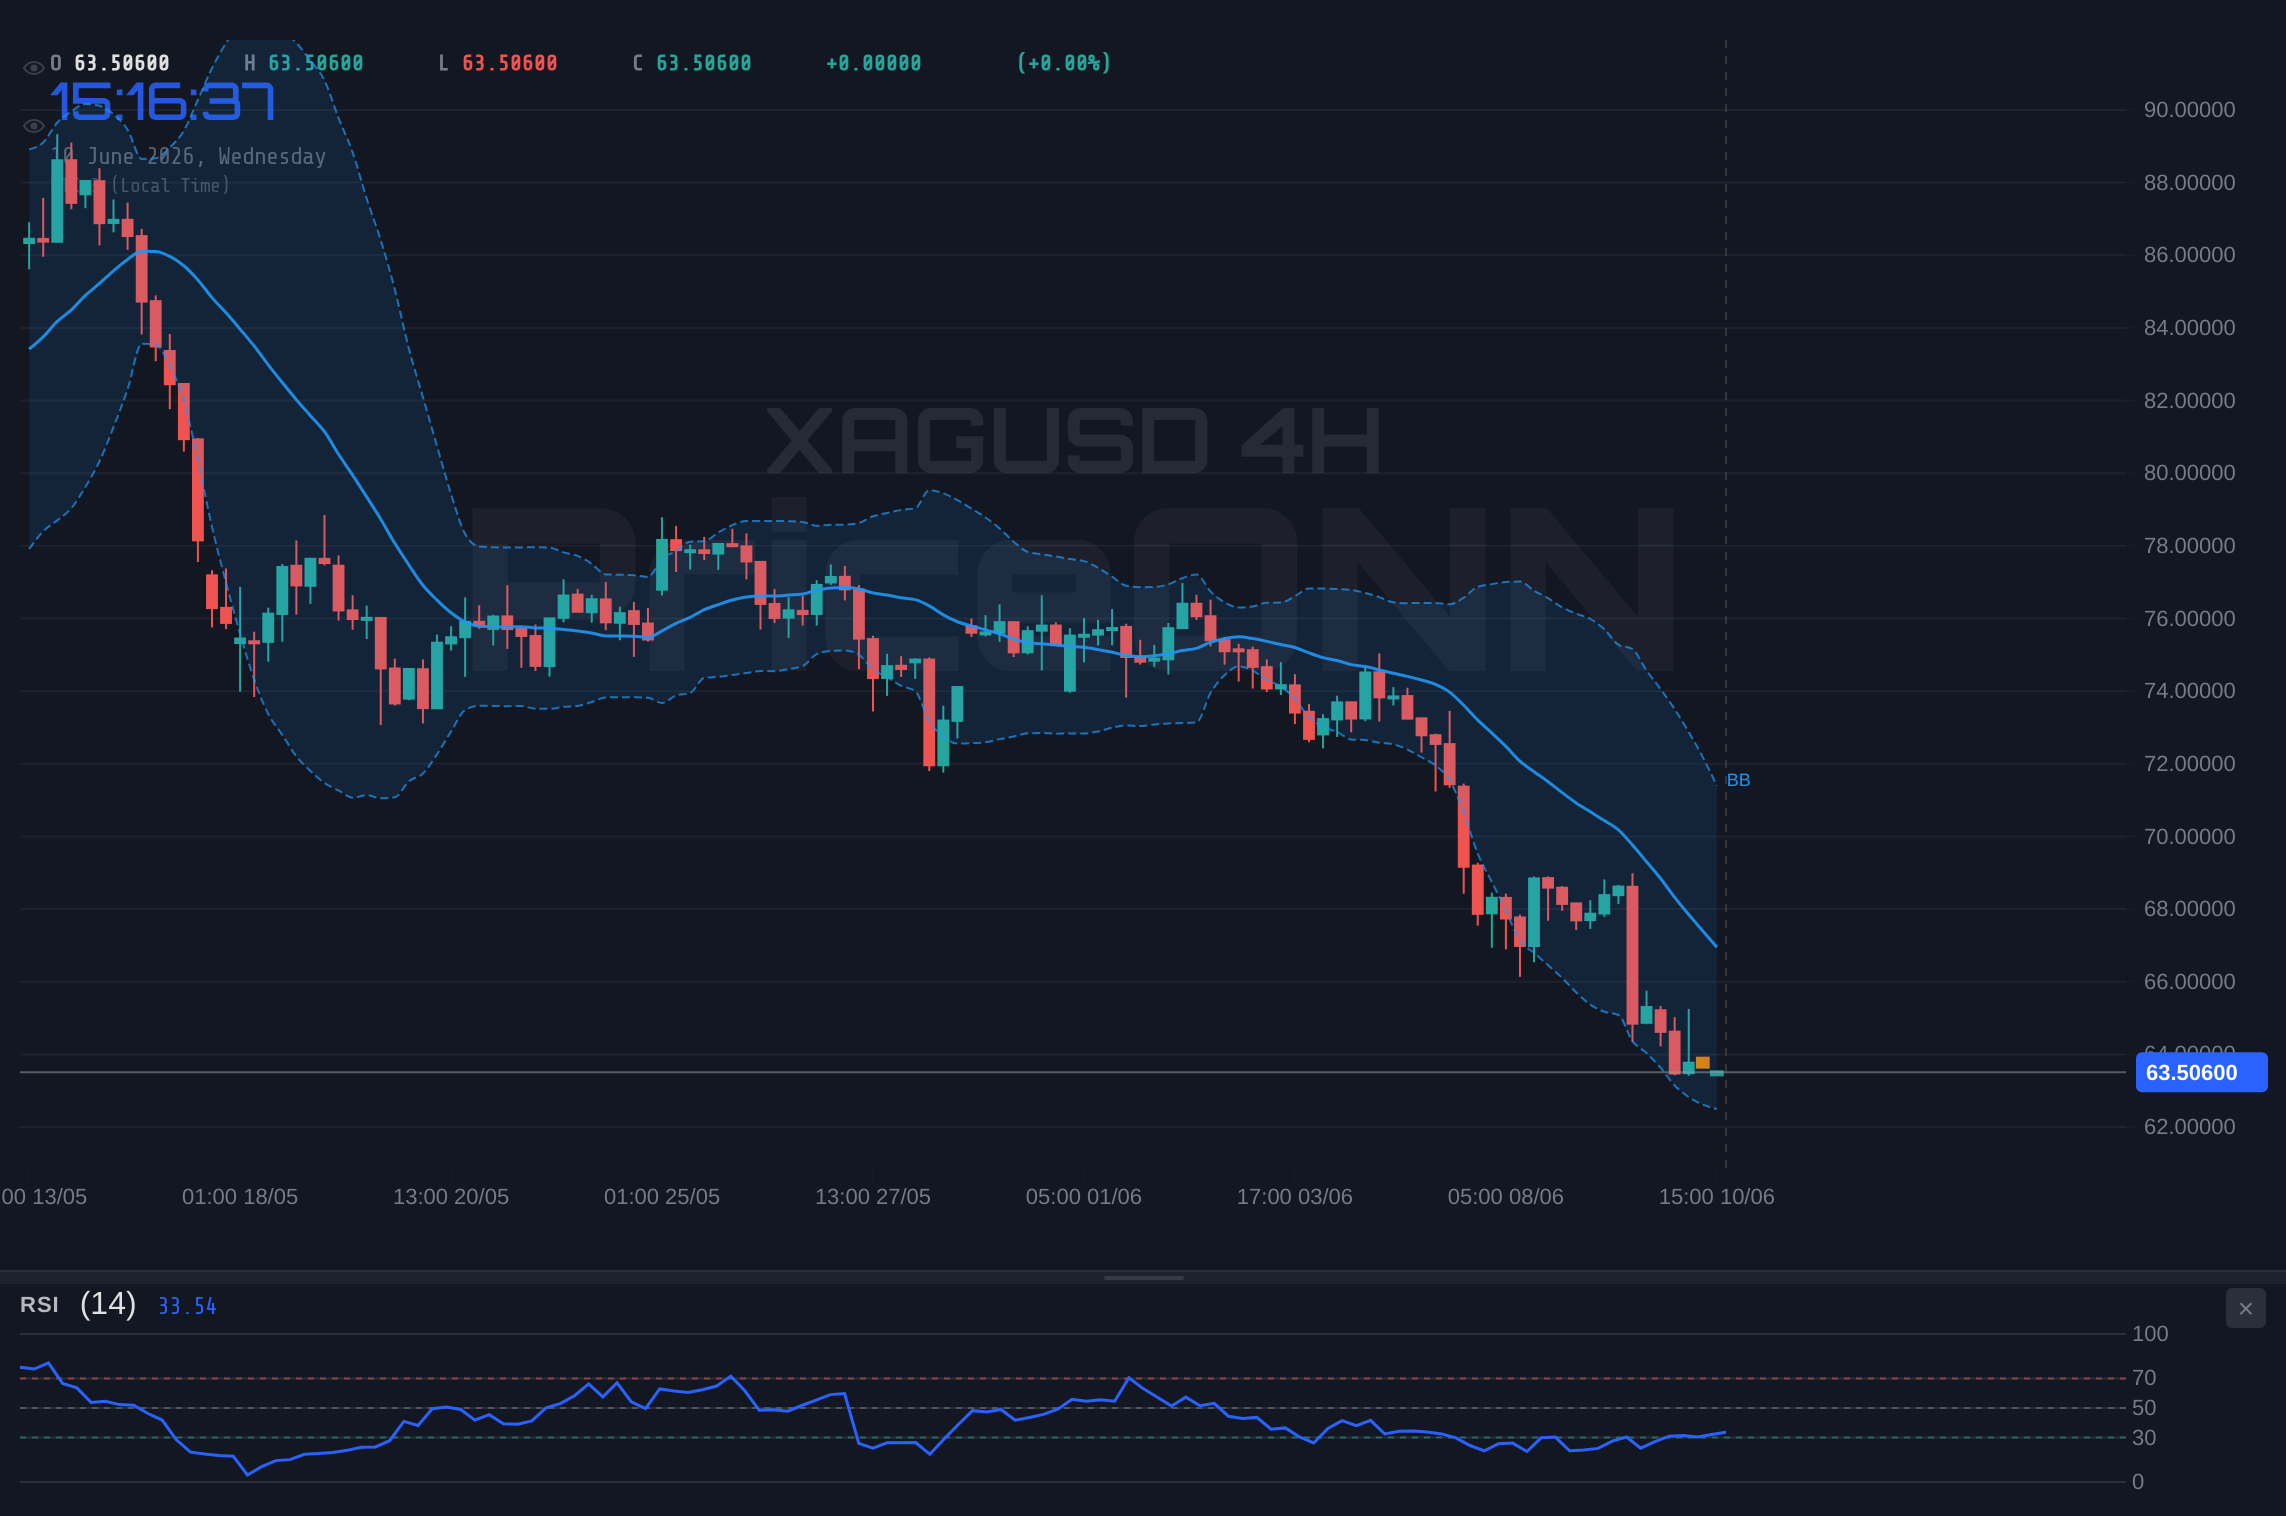
The daily picture adds another layer of concern for anyone holding longs. The daily Bollinger Bands have been pierced on the downside - price is trading below the lower band, a condition that can indicate either profound oversold exhaustion or a genuine breakdown where the old statistical range no longer applies. The daily Stochastic %K at 6.9 with %D at 25.13 shows that selling has been relentless enough to drive this oscillator to extreme lows, yet the market has not rewarded dip buyers. The daily ADX at 21.92, while lower than its 4-hour counterpart, is still in moderate trend territory - meaning the daily trend has room to develop further before reaching structural exhaustion.
What really seals the bearish argument is the structural damage done to former support levels. The 1-day chart had support zones at $64.96 and $66.55 that have now been broken with conviction, converting them into overhead resistance zones. Silver did not just briefly probe below these levels; it closed through them decisively. The nearest remaining daily support sits at $63.79 - essentially where price is right now. This is the final wall. A daily close below $63.79 would be a clear signal that the structural breakdown is continuing, not consolidating, and the 4-hour support at $62.92 becomes the next destination.
Gold's parallel collapse reinforces the broader metals selloff narrative. XAUUSD has tumbled 4.18% to $4,148.49, breaking below what multiple technical frameworks had identified as critical support near $4,400, with Bloomberg analysts noting a major bearish trend line now forming on gold's chart. Silver's relationship with gold is historically tight, with silver exhibiting a higher beta - meaning that where gold leads, silver follows but with amplification. If gold continues its descent, silver faces compounded downside risk. There is no divergence signal yet between the two metals, no indication that silver is about to decouple to the upside while gold sinks.
The Bull Case; When Extreme RSI Readings Signal a Coming Reversal
Now for the other side of this debate - and it deserves a serious hearing. The 4-hour RSI at 26.56 is not just casually below the 30 oversold threshold. It is deep into territory that historically precedes at least a temporary exhaustion of selling pressure. When silver moves this fast, this far, in this short a time, the elastic band effect becomes real. Historically, when XAGUSD RSI reaches sub-28 levels on the 4-hour chart, the market is pricing in a level of panic selling that is difficult to sustain without at least a sharp short-covering bounce. The bulls do not need to be right about the long-term trend to profit from a counter-trend snap.
The Stochastic oscillator on the 4-hour chart makes an even more striking case. With %K at 5.42 and %D at 34.23, the divergence between these two lines is massive. When %K is this far below %D, a bullish crossover - where %K rises back through %D - can happen quickly, and it is typically one of the first technical signals that short-term buying pressure is beginning to reassert itself. Counter-trend traders watching XAGUSD support and resistance levels will have this Stochastic crossover marked as a critical trigger on their checklist. Without it, trying to catch the knife is dangerous; with it, a tactical long with a tight stop below $62.92 becomes a higher-quality setup.
The 1-hour chart adds an interesting subplot. While the overall 1-hour trend remains bearish - ADX at 41.86, RSI at 37.57 - the MACD on the hourly timeframe has shifted to positive momentum, trading above its signal line. This is a micro-divergence from the broader bearish picture on the 4-hour. Short-term buying is beginning to appear, even if it has not yet challenged the dominant selling force. These early positive divergences on shorter timeframes can be early-warning signals that the selling wave is losing energy at the margin, even before the primary trend confirms a turn.
Risk sentiment adds a complicated footnote. The S&P 500 is up 0.74% at 6,572.87, with 4-hour signals in firm buy territory and ADX at 49.72 showing a strong uptrend in equities. Normally, equity resilience would support silver through the risk-appetite and industrial demand channels - silver has significant industrial consumption in electronics, solar panels, and medical devices that benefits from economic growth. The puzzle is whether equities' positive tone can bleed through to metals, or whether silver's specific macro headwinds - dollar strength, falling inflation expectations, rising real yields - are overriding the growth narrative entirely.
When RSI drops below 30 on multiple timeframes simultaneously alongside a volatile, sharp sell-off, the risk/reward for new short positions deteriorates significantly even if the trend remains intact. Professional traders typically tighten stops on existing profitable shorts rather than adding fresh entries at these extremes. The smart money short was entered near $68-69, not at $63.80.
What DXY at 99.75 and Gold's Collapse Reveal About XAGUSD Key Levels
The intermarket XAGUSD correlation analysis begins and ends with the dollar index. DXY is trading at 99.75, and its signals across multiple timeframes are firmly bullish: RSI at 64.2 on the daily chart, Stochastic at K=88.86 approaching overbought levels but ADX at 23.43 confirming a moderate uptrend is still building. A strengthening dollar is structurally negative for silver because the metal is priced in dollars globally - when the greenback rises, silver becomes more expensive for international buyers, which compresses demand at the margin and typically pushes prices lower.
Dollar strength is itself a function of the macro narrative that has dominated since the US employment report landed earlier this week. Reuters reported that traders responded to a stronger-than-expected jobs print by pricing in a higher-for-longer Federal Reserve policy path. The euro has attempted a modest stabilization (EURUSD at 1.15364) but remains under significant pressure, with daily signals uniformly bearish. AUD/USD is sitting precisely at the critical 0.70 level - down 0.61% - and analysis from multiple desks suggests a break below this handle if US core CPI tops 3% is a serious risk. Dollar strength against the euro, the yen (USDJPY at 160.507, with all timeframes aligned bullish), and the commodity currencies creates a broad, synchronized headwind for all dollar-denominated commodities including silver.
Oil's decline adds a second layer of pressure on the inflation-hedge component of silver demand. Brent crude is at $95.31, down 1.29%, and WTI is at $90.94, off 1.48%. Kuwait has reportedly offered its first crude cargoes to Asia since the Iran war started - a supply-side development that could keep energy prices under additional pressure near term. Falling oil prices reduce inflation expectations, and silver's hard-asset premium is partly a function of its role as an inflation hedge. When oil falls and real yields rise, this specific demand pillar for silver weakens, removing buyers who would otherwise step in at these levels.
The full intermarket XAGUSD market sentiment picture leaves little ambiguity about the dominant force: a strengthening dollar, falling oil, synchronized gold weakness, and a Nasdaq100 that has dropped 2.56% to 28,639.13 raising questions about technology valuations and risk appetite. Silver rarely stages a meaningful, sustained recovery when all of these correlated markets are pointing in the wrong direction simultaneously. Something needs to break in this correlation matrix - and the most likely candidate is the US CPI print.
How US CPI Will Determine the XAGUSD Price Forecast This Week
The crux of this entire setup. As both Reuters and Bloomberg analysis highlighted this week, inflation data is set to dominate sentiment across asset classes. For silver specifically, the upcoming US CPI release functions as a binary fork in the road. The market is positioned cautiously ahead of it - Reuters noted that traders took profits with conviction absent, which means positioning is relatively light in both directions, creating the conditions for an outsized move whichever way the number lands.
The previous US CPI figures showed price pressures that remain stubborn. Looking at the economic calendar's previous readings - the unemployment rate tracking near 3.8%, with various CPI sub-components showing month-on-month changes of 0.4% to 0.6% - if the incoming print delivers another upside surprise, the dollar would strengthen further, rate cut expectations would be pushed back meaningfully, and silver's already-damaged daily support at $63.79 would face immediate retesting. In that scenario, the path to $62.92 as the primary 4-hour support becomes the likely destination, with $62.38 and $61.33 as extended bearish targets.
A softer CPI reading tells an entirely different story. If inflation shows meaningful deceleration toward the Fed's target, rate cut expectations would be repriced aggressively, the dollar would retreat from 99.75, and silver's extreme oversold condition would provide the technical fuel for a sharp relief rally. The 4-hour RSI at 26.56 with Stochastic at K=5.42 means there is significant compressed energy in this market. A CPI miss could snap that rubber band upward with force, targeting the $64.52 resistance first, with $65.57 and $66.12 as the extended recovery levels if short-covering momentum builds. Short positions that were placed near the highs would face painful stop-outs in that scenario.
Japanese yen dynamics add another dimension to the macro picture. USDJPY at 160.507 reflects persistent yen weakness, with the Bank of Japan expected to maintain rates near 0.5% per current market forecasts. The JPY economic calendar shows the BoJ rate decision ahead, and any signal of policy continuity rather than acceleration would keep yen carry trades attractive - historically channeling capital away from non-yielding assets including silver and gold. Until the BoJ shows genuine tightening intent, this structural dynamic remains a headwind for the precious metals complex.
The Verdict; Bears Win Short-Term, But the Bounce Setup Is Building
Here is the honest assessment after running the full multi-timeframe XAGUSD analysis. The bears are correct to be in control. ADX at 42, three timeframes aligned in sell territory, structural support levels broken at $64.96 and $66.55, dollar rising, gold falling in tandem - this is a bear market in silver on the short-to-medium term timeframe, and trend-following short positions entered near the highs remain valid.
What changes the calculus is the extreme nature of the oversold readings now in play. A 6.37% single-session decline with 4-hour RSI touching 26.56 and Stochastic at 5.42 is not the moment to be piling into fresh short entries with abandon. The risk/reward for new bearish positions at $63.80 has deteriorated significantly. Bears who entered near $68-69 have substantial open profit and every reason to tighten stops. Adding to those positions at current levels means a very tight stop above $64.52 with limited additional downside relative to the size of the reversal risk if CPI disappoints.
For position traders and those monitoring XAGUSD support and resistance on the daily chart, the $63.79 level is the line in the sand. A daily close above this level keeps the possibility of a recovery attempt alive. A decisive break below opens the next chapter in this bearish story. Swing traders should note that the Stochastic crossover on the 4-hour chart - when %K eventually reclaims %D from sub-10 levels - combined with a CPI catalyst, is the specific setup that would justify a counter-trend tactical long with well-defined risk parameters.
XAGUSD Trade Scenarios; Three Paths Forward
Bearish Scenario; The Next Floor Gets Tested
65% ProbabilityBullish Scenario; Oversold Extremes Spark a Short Squeeze
20% ProbabilityNeutral Scenario; CPI In Line Creates Range Compression
15% ProbabilityFrequently Asked Questions: XAGUSD Analysis
What happens if XAGUSD breaks below the $62.92 support level?
A break below $62.92 - the key 4-hour S1 support - would confirm that sellers are overcoming even the deeply oversold technical conditions and targeting the $62.38 S2 level next. Should $62.38 also fail to hold, the extended bearish projection points toward $61.33 as the next structural floor. This breakdown scenario becomes most likely if US CPI delivers an upside surprise, strengthening DXY above 100 and removing the short-term relief case for silver entirely.
Should traders buy XAGUSD at $63.80 given the 4-hour RSI reading of 26.56?
While RSI at 26.56 is deeply oversold territory, the ADX at 42 confirms a strong downtrend that can keep oversold readings depressed far longer than intuition suggests. The recommended approach is to wait for a 4-hour Stochastic %K crossover above %D from the current extreme of K=5.42 versus D=34.23 before considering a counter-trend long, ideally combined with a softer-than-expected CPI print as the macro catalyst. Buying purely on oversold RSI without confirmation risks being caught in continuation selling and missing the actual reversal trigger.
Is silver's 6.37% daily decline driven by the same factors hitting gold at $4,148.49 today?
Yes - both metals are experiencing synchronized weakness driven primarily by dollar strength (DXY at 99.75), a hawkish repricing of Federal Reserve expectations following a strong US employment report, and reduced inflation-hedge demand as oil prices decline. Gold (XAUUSD) is down 4.18% to $4,148.49, breaking a critical support zone, and silver is amplifying that move because of its higher beta to gold prices. There is no divergence between the two metals currently, which removes one potential support argument for silver bulls.
How will this week's US CPI data affect the XAGUSD price forecast?
US CPI is the binary catalyst that will determine silver's next significant directional move. A hotter-than-expected print would strengthen DXY further, pressure the $63.79 daily support level, and likely extend the decline toward $62.92 and $61.33. A softer-than-expected reading would trigger dollar selling and, combined with the extreme oversold readings of 4-hour RSI at 26.56 and Stochastic K at 5.42, could ignite a sharp short-covering bounce toward $64.52 and $65.57 resistance. Position sizing should reflect this binary risk environment ahead of the release.
Technical Outlook Summary
| Indicator | Value | Signal |
|---|---|---|
| RSI (14) - 4H | 26.56 | Oversold |
| MACD Histogram - 4H | Negative | Bearish Momentum |
| Stochastic K/D - 4H | 5.42 / 34.23 | Extreme Oversold |
| ADX - 4H | 42.00 | Strong Downtrend |
| Bollinger Bands - 1D | Below Lower Band | Breakdown Mode |
| RSI (14) - 1D | 30.9 | Near Oversold |
| ADX - 1H | 41.86 | Strong Downtrend |
Track markets in real-time
AI-powered analysis, technical indicators and real-time price data.
Join Our Telegram Channel
Breaking market news, AI analysis and trading signals instantly.
Join Channel