The global energy landscape is in constant flux, and the recent movements in West Texas Intermediate (WTI) crude oil, now hovering around the critical $75.58 mark, underscore this dynamic. As traders digest a complex interplay of geopolitical developments, shifting risk sentiment, and macroeconomic indicators, the $75.58 level for WTI is proving to be a pivotal point. This analysis delves into the confluence of factors driving oil prices, examining how events far beyond the energy sector are shaping its trajectory and what this means for market participants.
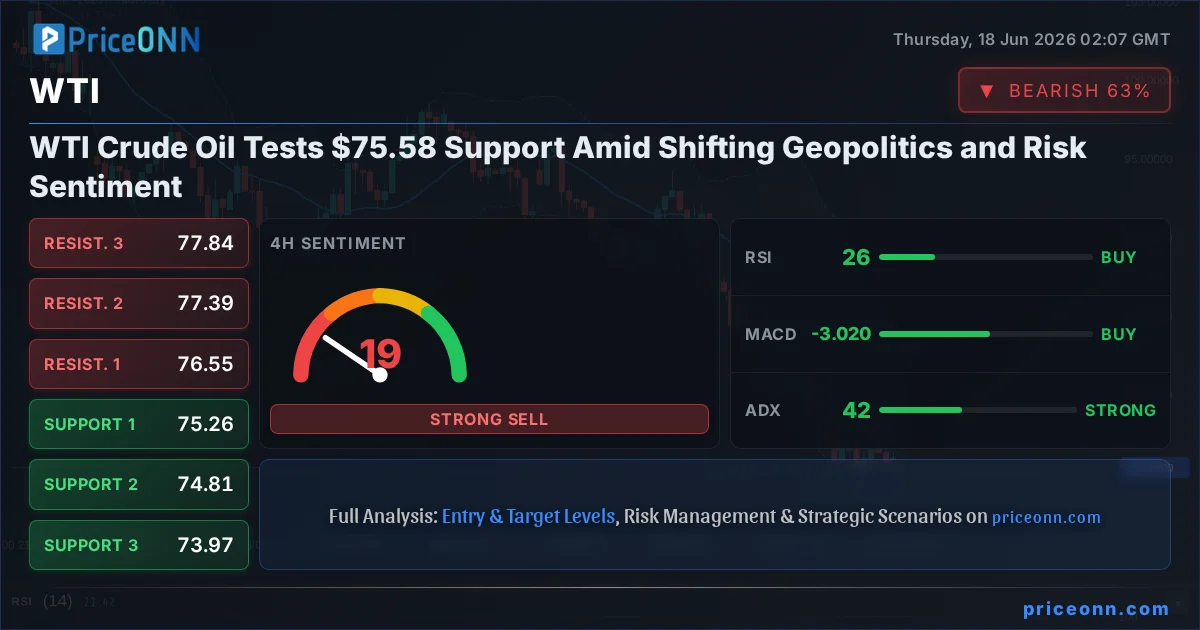
- WTI Crude Oil is currently trading at $75.58, testing key support levels amid a bearish trend.
- Critical support for WTI is identified at $75.42, with immediate resistance at $76.10.
- The US Dollar Index (DXY) is strong at 100.34, increasing pressure on oil prices.
- Geopolitical shifts, including tentative Iran peace talks, are influencing oil market sentiment.
Navigating Macroeconomic Crosscurrents
The price action in WTI crude oil is rarely a solitary story; it is deeply interwoven with the broader macroeconomic narrative. Currently, the US Dollar Index (DXY) is exhibiting significant strength, trading at 100.34 and showing a robust upward trend across multiple timeframes. This strengthening dollar acts as a headwind for dollar-denominated commodities like oil. When the dollar strengthens, it becomes more expensive for holders of other currencies to purchase oil, potentially dampening demand and putting downward pressure on prices. The DXY's upward momentum, supported by a strong 1H trend and positive momentum signals on the MACD, suggests that this currency headwind will likely persist in the near term, adding to the bearish case for WTI.
Furthermore, the performance of major equity indices like the S&P 500 and Nasdaq provides crucial context for risk appetite. The S&P 500, currently showing a mixed picture with a strong 1H trend but a bearish 1D trend, hovers around 6572.87. While it has seen some gains, the underlying caution in broader equity markets can translate into reduced demand for riskier assets, including commodities. A decline in risk appetite typically favors safe-haven assets, but in the current environment, it also signals a potential slowdown in economic activity. This reduced economic outlook, coupled with the strong dollar, creates a challenging environment for oil prices. The ADX at 26.87 on the 1H chart for WTI indicates a strong downtrend, reinforcing the bearish sentiment.
Geopolitical Ripples in the Oil Market
The energy market is inherently sensitive to geopolitical developments, and recent news suggests a potential easing of tensions in the Middle East, which could impact oil supply dynamics. Reports indicate tentative progress in U.S.-Iran peace talks, a development that, if it leads to a de-escalation or a lifting of sanctions, could bring more oil onto the global market. Historically, increased supply from major producers or a reduction in geopolitical risk premiums has led to downward price pressure on crude oil. While the extent and certainty of any such deal remain unclear, the mere possibility is enough to weigh on prices as traders price in potential future supply increases. This sentiment is echoed in news suggesting that falling oil prices could ease pressure on India's trade deficit, hinting at a broader global expectation of lower energy costs.
Conversely, any setback or renewed escalation in geopolitical situations can swiftly reverse these trends. The intricate balance of power and ongoing conflicts in various regions mean that supply disruptions remain a constant threat. For now, the market appears to be leaning towards the narrative of potential supply increases or reduced demand fears, contributing to the current downward pressure on WTI. The RSI at 34.11 on the 1H chart for WTI, while not yet in oversold territory, indicates a weakening bullish momentum and a leaning towards bearish conditions, reflecting this cautious outlook.
Technical Picture: WTI at a Crossroads
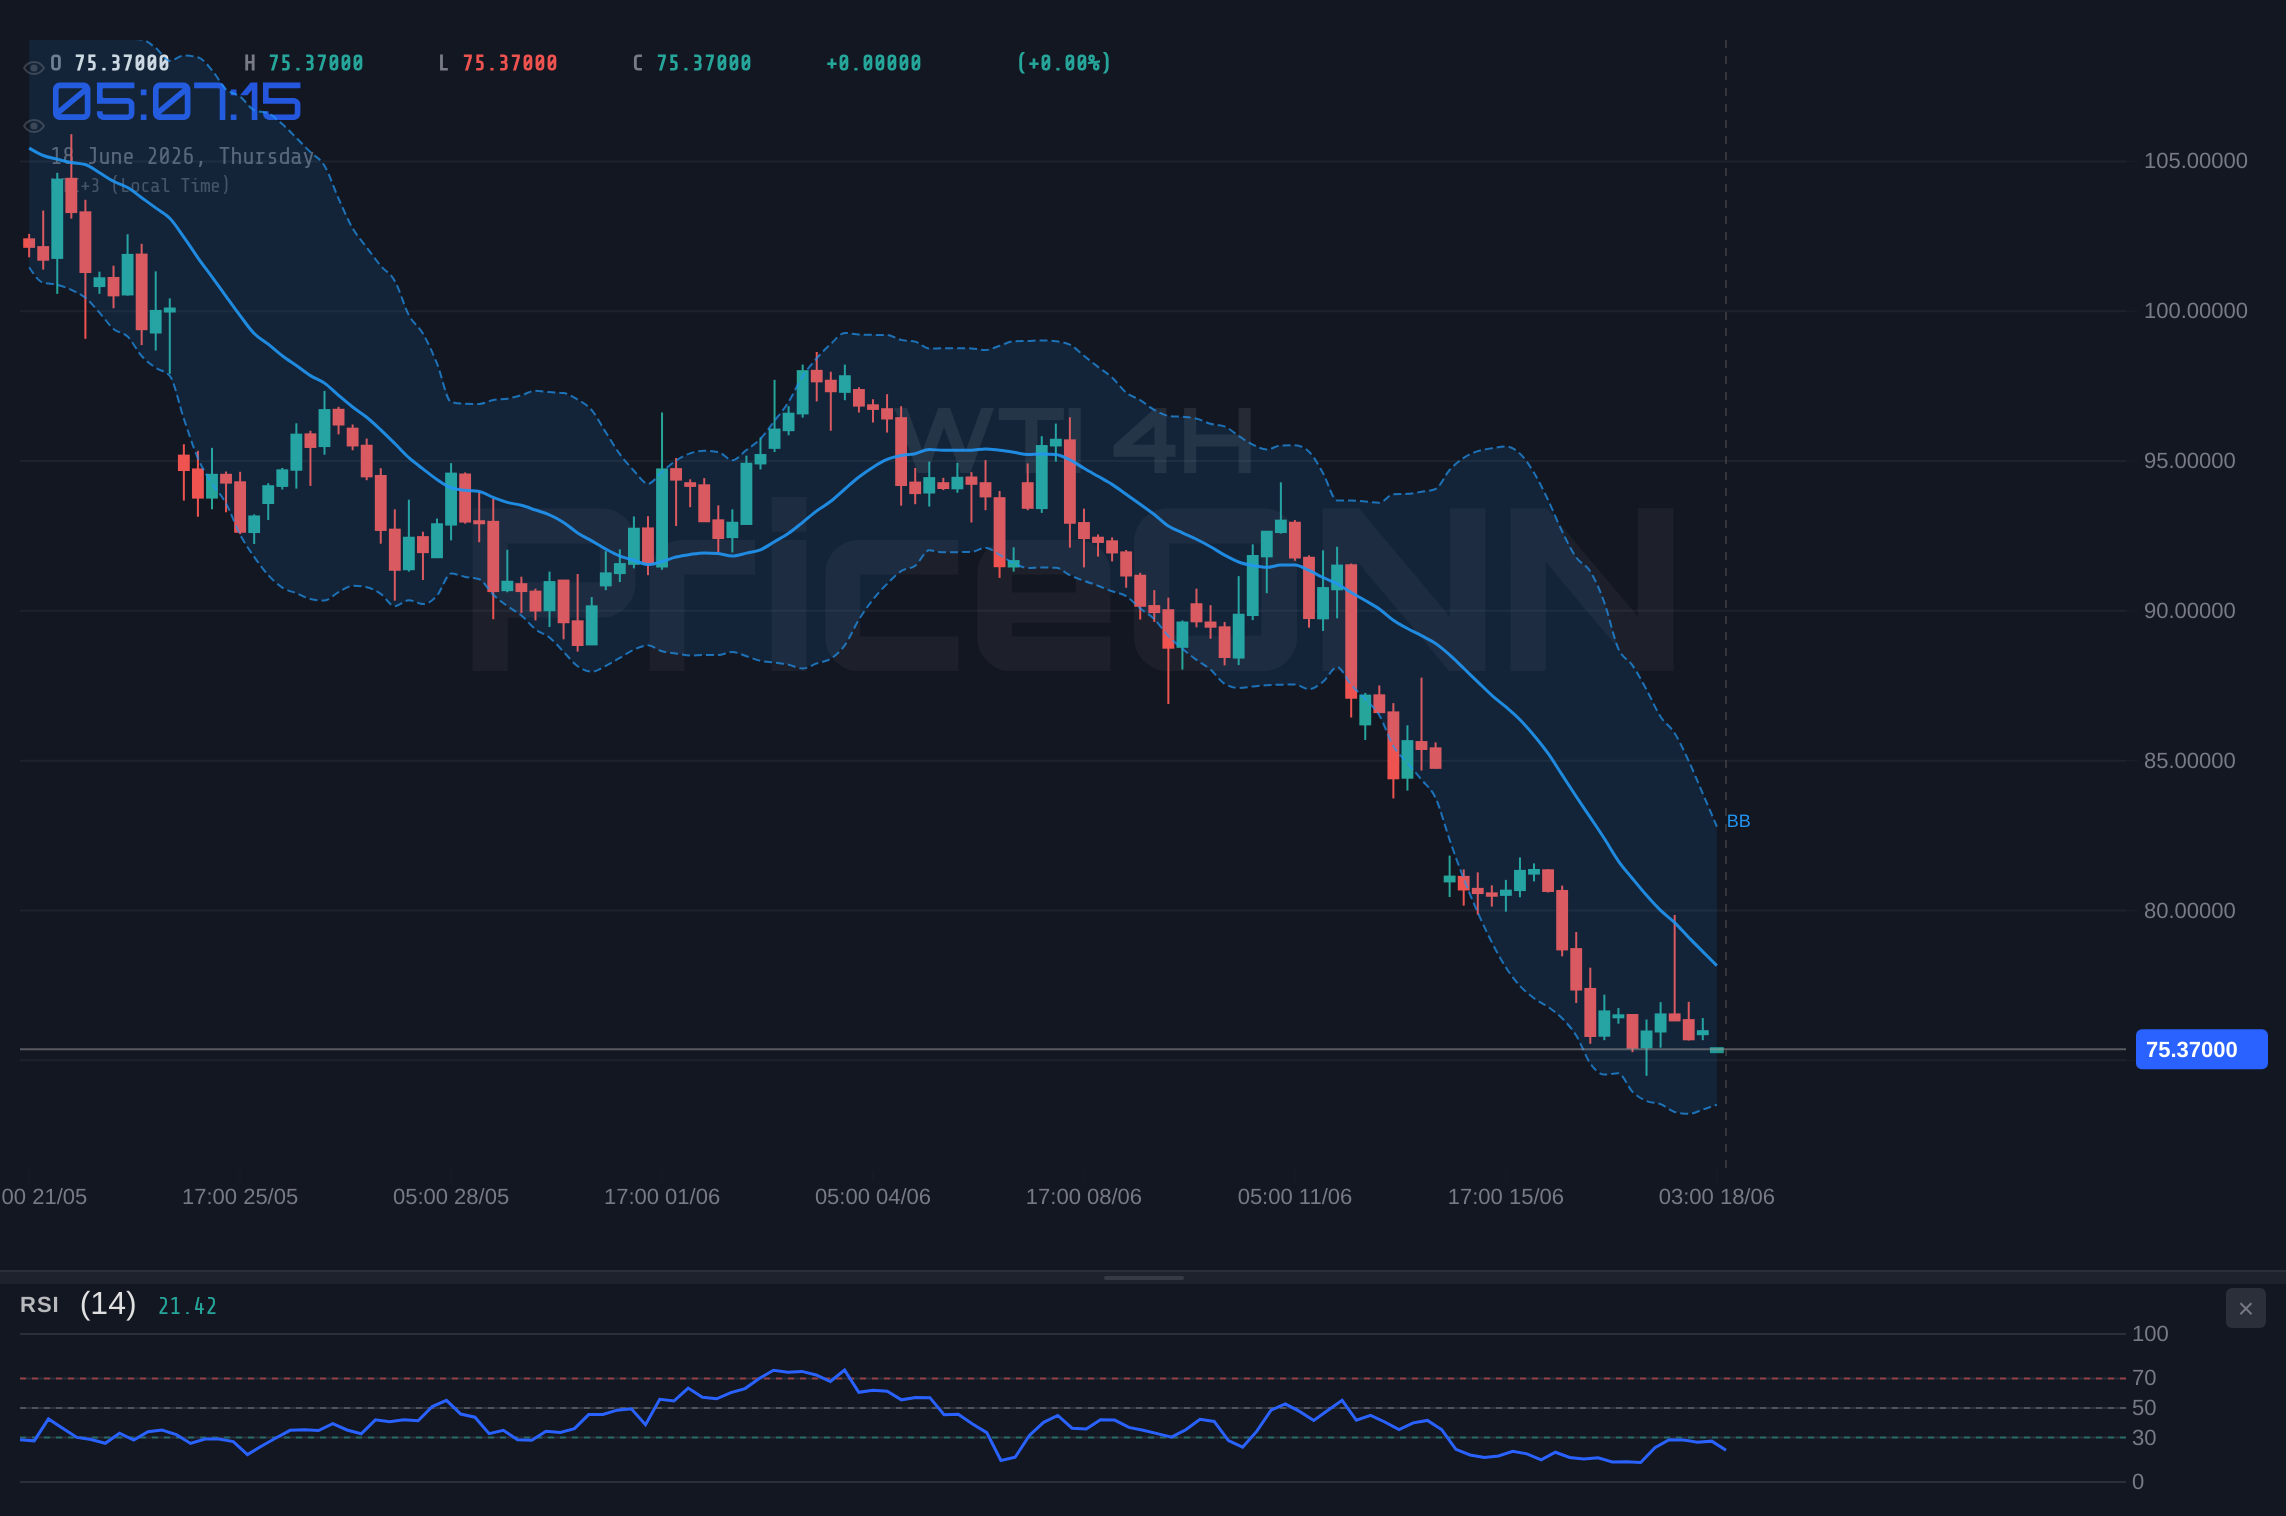
From a technical standpoint, WTI crude oil is exhibiting a clear bearish trend on the daily timeframe, with an ADX of 35.48 indicating strong trend strength. The current price of $75.58 sits precariously close to the immediate support level of $75.42. The 1D RSI at 43.44 suggests room for further decline before reaching oversold conditions, while the MACD is showing negative momentum, with the MACD line below the signal line. The Bollinger Bands on the daily chart are positioned below the middle band, confirming the bearish bias.
Looking at the shorter timeframes, the 1H chart shows a neutral trend with a strong downtrend ADX of 28.72. The price is currently trading below the middle Bollinger Band, and the RSI at 39.19 indicates further downside potential. However, the Stochastic indicator on the 1H chart is showing K=12.63 and D=8.52, which are deep in oversold territory and suggesting a potential for a bounce. This divergence between the overall bearish trend and oversold short-term indicators presents a complex picture for traders, highlighting the importance of precise entry and exit points. The conflict between the strong daily downtrend and the oversold short-term stochastic is a key element to watch.
The 4H chart also reinforces the bearish outlook, with an ADX of 42.12 pointing to a strong downtrend. The RSI at 26.45 is firmly in oversold territory, indicating that the selling pressure may be nearing exhaustion, at least in the short term. The Stochastic K=24.11 and D=20 also support this oversold condition. Despite the oversold readings on intraday charts, the persistent strength in the daily downtrend suggests that any bounce might be a short-lived correction rather than a reversal. Patience and risk management are paramount for traders navigating this environment.
Intermarket Correlations: DXY, Equities, and Brent
The correlation between WTI and other major markets provides vital clues about the broader economic sentiment. The strong performance of the DXY at 100.34 is a significant factor, directly pressuring WTI. For every point the DXY rises, it generally implies increased costs for non-dollar buyers of oil, thus suppressing demand. This inverse relationship is a cornerstone of commodity trading analysis.
The performance of equity indices, particularly the S&P 500 at 6572.87 and Nasdaq at 30082.5, offers insight into risk appetite. A risk-off environment, often signaled by falling stocks, can lead investors to reduce exposure to commodities perceived as riskier assets. While the S&P 500 shows some resilience, the underlying bearish trend on the daily chart suggests that this risk appetite may be fragile. This broader market sentiment directly influences the demand outlook for oil, impacting WTI's price trajectory.
Comparing WTI's performance to Brent crude, currently trading at $78.41, is also essential. Both benchmarks are experiencing similar downward pressure, with Brent also showing a bearish trend and trading below its key support levels. This synchronized movement indicates that the factors driving the oil market are broad-based, affecting global crude benchmarks rather than being specific to one region or grade. The fact that Brent is trading above WTI, with a $78.41 price compared to WTI's $75.58, reflects the typical spread between these benchmarks, but the directionality remains consistent.
The Macroeconomic Backdrop: Inflation, Rates, and Growth
While specific economic calendar data for the immediate 48 hours isn't provided in granular detail, the overarching macroeconomic themes remain critical. Concerns about persistent inflation and the subsequent policy responses from central banks, particularly the US Federal Reserve, continue to shape market expectations. If inflation remains elevated, it could force central banks to maintain higher interest rates for longer, or even implement further tightening. Higher interest rates increase borrowing costs, potentially slowing economic growth and reducing demand for energy. Conversely, signs of cooling inflation could lead to expectations of rate cuts, which might stimulate economic activity and support oil prices. The current ADX of 28.72 on the 1H chart for WTI suggests a strong trend, but the underlying macroeconomic uncertainty means this trend could be vulnerable to shifts in central bank policy expectations.
The market is constantly pricing in future economic scenarios. For oil, a strong global growth outlook is generally bullish, as it implies higher industrial activity and transportation demand. Conversely, signs of an impending recession or a significant global economic slowdown would be bearish for WTI. The current mixed signals from equity markets and the strong dollar suggest that the global growth narrative is far from settled, contributing to the volatility and uncertainty surrounding oil prices. Traders are watching for any economic data releases that could clarify the path forward for inflation and growth.
Scenario Analysis: Defining the Path Forward
Bearish Scenario: Sustained Downtrend
65% ProbabilityNeutral Scenario: Range-Bound Consolidation
25% ProbabilityBullish Scenario: Short-Term Bounce
10% ProbabilityKey Levels and Trading Implications
The immediate price action for WTI hinges on the $75.58 level. Immediate support is found at $75.42, followed by $75.26 on the 4-hour chart. A decisive break below $75.42 would likely trigger further selling pressure, potentially targeting the $74.81 level, which is another significant support on the 4H chart. Conversely, resistance is currently encountered around $76.10 on the 1H chart, with further resistance at $76.22 and $76.44. A sustained move above $76.10 could signal a temporary reprieve for WTI, but the broader daily downtrend remains a significant hurdle.
The technical indicators present a mixed but predominantly bearish picture. The daily ADX at 35.48 confirms a strong downtrend. However, the oversold conditions on the 1H and 4H Stochastic indicators (K=12.63, D=8.52 on 1H; K=24.11, D=20 on 4H) suggest that the downward momentum might be facing short-term exhaustion. This could lead to a period of consolidation or a minor bounce, especially if price holds the $75.42 support. Traders should remain vigilant, as the strength of the daily trend implies that any upward moves might be corrective rather than indicative of a trend reversal.
Given the confluence of a strong dollar (DXY at 100.34), potential geopolitical easing, and a bearish technical setup on WTI (RSI 43.44 on 1D), the path of least resistance appears to be downwards. The divergence between the strong daily downtrend and the oversold short-term indicators warrants a cautious approach. A break below $75.42 could accelerate declines, while holding this level might lead to a short-term consolidation phase. The overall market sentiment, heavily influenced by inflation expectations and central bank policies, will be crucial in determining the direction from these levels.
The energy market is subject to rapid shifts due to geopolitical events and economic data releases. Traders should exercise strict risk management, utilize stop-loss orders, and be aware of potential volatility around key economic announcements and news developments. The current trend strength suggests that any counter-trend moves may be short-lived.
Frequently Asked Questions: WTI Crude Oil Analysis
What happens if WTI breaks below the $75.42 support level?
If WTI decisively breaks below the $75.42 support, it would confirm the bearish trend and likely trigger further selling. The next significant downside targets would be $74.81 and then $73.97, based on 4-hour chart support levels. This scenario is supported by the strong daily downtrend and the persistent strength of the US Dollar Index (DXY).
Should I consider buying WTI at current levels around $75.58 given the oversold Stochastic?
While the 1H and 4H Stochastic indicators are deeply oversold (K=12.63, D=8.52 on 1H), this does not guarantee a reversal. The strong daily downtrend (ADX 35.48) and bearish MACD signals suggest that any bounce might be a short-lived correction. A more prudent approach would be to wait for confirmation, such as a hold above $75.42 and a move towards $76.10 resistance, before considering long positions, with a high probability of invalidation if price drops below $75.42.
Is the RSI at 43.44 on the daily chart a sell signal for WTI?
An RSI reading of 43.44 on the daily chart is below the 50 neutral level, indicating a bearish bias and suggesting that sellers have the upper hand. While it's not yet in the oversold territory (typically below 30), it confirms the overall downtrend and implies that there is room for further price depreciation before any potential support is reached. This reading aligns with the broader bearish technical setup for WTI.
How will the tentative U.S.-Iran peace talks affect WTI prices this week?
Tentative U.S.-Iran peace talks, if successful, could lead to an increase in global oil supply, potentially putting significant downward pressure on WTI prices. This development contributes to the current bearish sentiment, as traders begin to price in the possibility of reduced geopolitical risk premiums and increased supply. A de-escalation could target lower support levels for WTI, such as $74.81, if confirmed by further supply data.
Technical Outlook Summary
| Indicator | Value | Signal | Interpretation |
|---|---|---|---|
| RSI (14) | 43.44 | Bearish | Nearing oversold on daily, confirms downtrend. |
| MACD | -0.78 | Bearish | Negative momentum, below signal line. |
| Stochastic | K=12.63, D=8.52 | Oversold | Deeply oversold on 1H, potential for short-term bounce. |
| ADX | 35.48 | Strong Trend | Confirms strong downtrend on daily. |
| Bollinger | Middle Band | Below | Price is below the middle band, indicating bearish pressure. |
Key Levels
Track markets in real-time
AI-powered analysis, technical indicators and real-time price data.
Join Our Telegram Channel
Breaking market news, AI analysis and trading signals instantly.
Join Channel