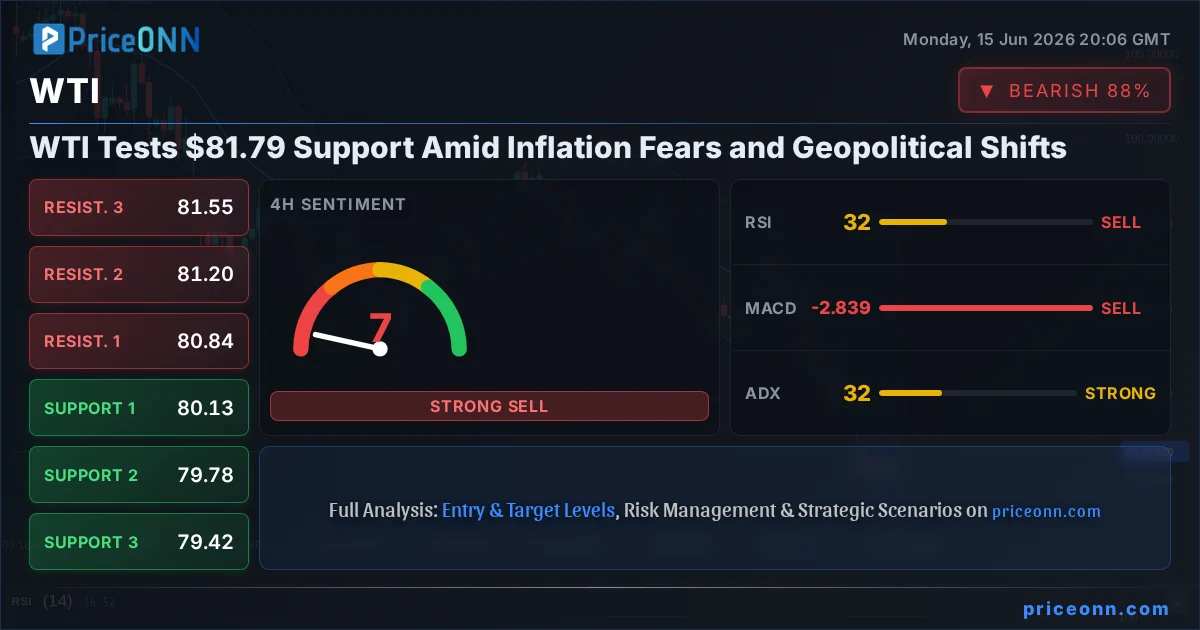
The price of WTI crude oil is currently testing critical support around the $81.79 mark, a level that traders are watching with bated breath. This sharp decline, driven by a confluence of factors including shifting inflation expectations and geopolitical developments, presents a complex picture for market participants. While the immediate technical signals offer a mixed outlook, understanding the underlying fundamental drivers is paramount to navigating this volatile energy landscape. The question on everyone's mind is whether this dip represents a temporary pause before a renewed rally, or the beginning of a more significant downtrend.
- WTI crude oil is trading near $81.79, a key support level.
- The 4-hour chart shows a strong downtrend (ADX: 32.19), while the 1-hour chart signals caution with negative MACD momentum.
- A significant drop in Brent crude to $84.7 suggests broader energy market weakness.
- Geopolitical shifts, including the reopening of the Strait of Hormuz, are easing some supply-side anxieties.
The recent sharp move in WTI, coupled with a significant pullback in Brent crude to $84.7, underscores the dynamic nature of the energy markets. This price action is not occurring in a vacuum; it's a response to a complex interplay of macroeconomic data, central bank policy hints, and evolving geopolitical tensions. The market sentiment appears to be shifting, with inflation fears momentarily taking a backseat to concerns about global economic growth and potential oversupply. Understanding these underlying forces is crucial for deciphering the true meaning behind the current price action at the $81.79 level.
Why WTI Volatility Analysis Points to a Breakout
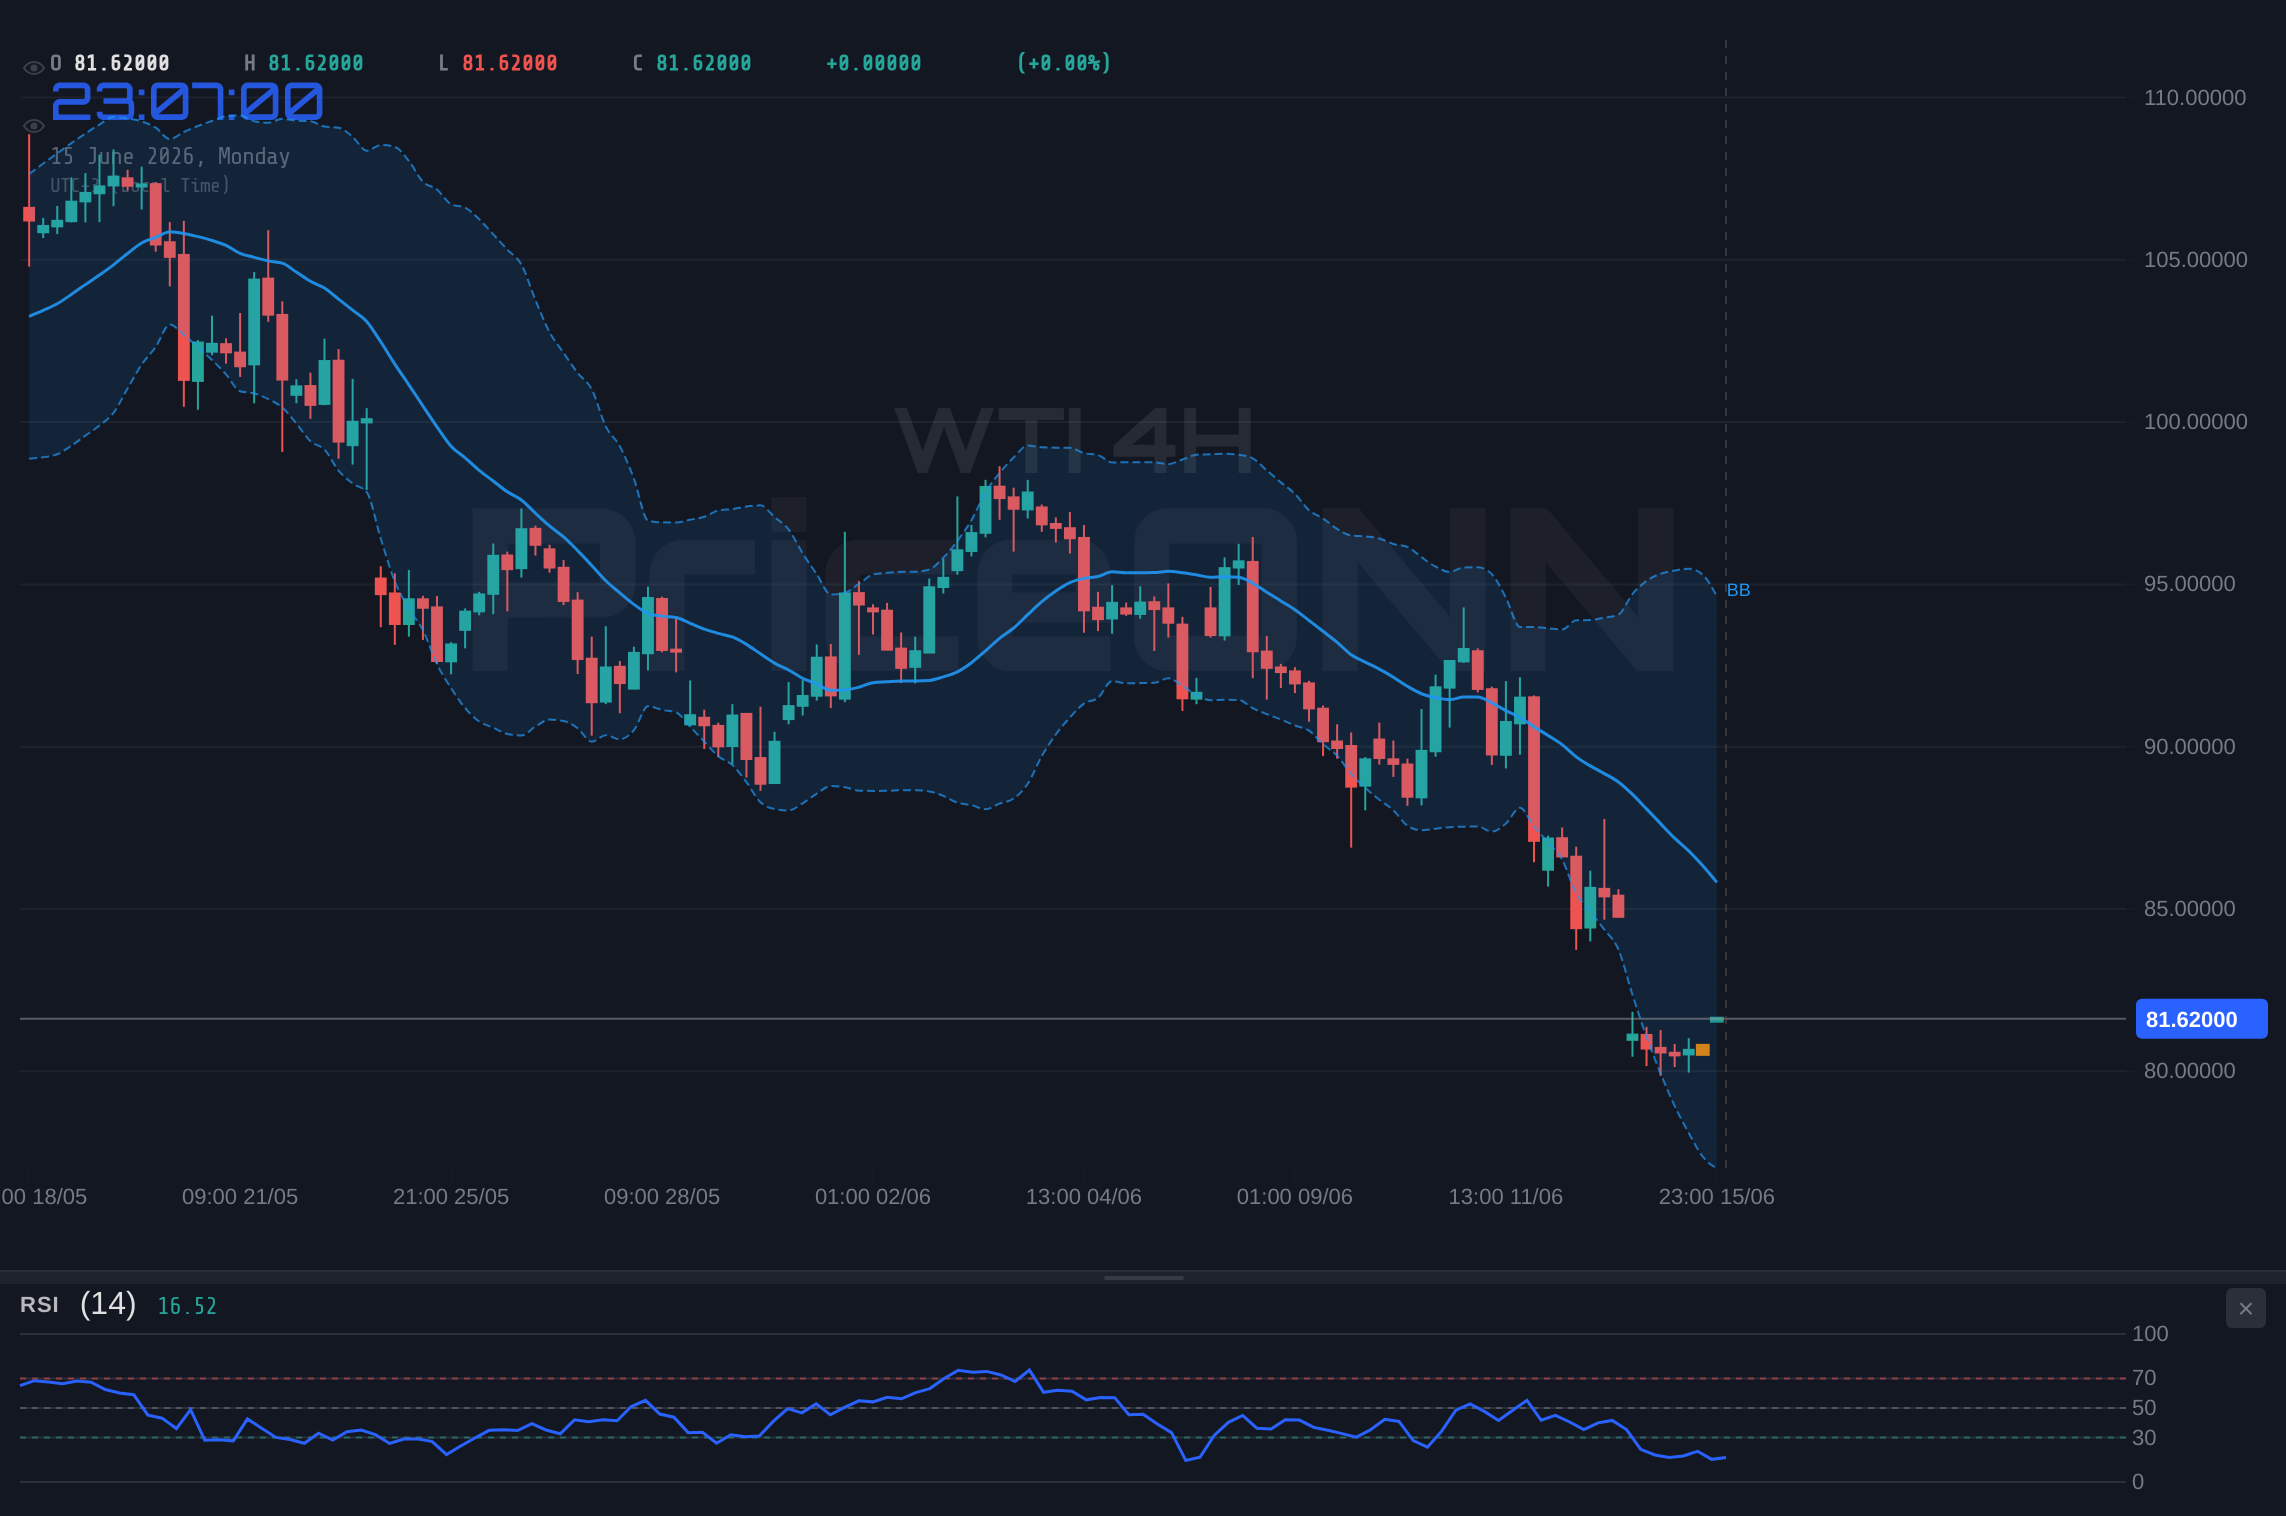
The WTI crude oil chart paints a picture of significant short-term volatility, but the longer-term trend indicators are beginning to offer more clarity. On the 4-hour timeframe, the ADX at 32.19 indicates a strong downtrend is in play, suggesting that the bears have maintained control for a considerable period. This is further supported by the RSI(14) reading of 32.12, firmly in oversold territory, and a negative MACD momentum. The Stochastic Oscillator, with K at 13.82 and D at 10.86, also points to an oversold condition, potentially signaling a short-term bounce is on the cards, but not necessarily a trend reversal. The Bollinger Bands are hugging the lower band, a classic sign of bearish pressure, and the price is currently trading below the middle band, reinforcing this bearish sentiment. This confluence of indicators on the 4-hour chart suggests that the path of least resistance has been to the downside.
However, the 1-hour chart presents a slightly different, albeit cautious, perspective. While the MACD shows negative momentum and is below the signal line, the RSI(14) is at 48.9, hovering near the neutral zone, and the Stochastic Oscillator shows K (87.02) crossing above D (62.44), indicating a potential short-term upward move or at least a pause in the selling pressure. The Bollinger Bands on the 1-hour chart are above the middle band, hinting at some upward momentum in the very short term. The ADX at 39.64 on this timeframe still signifies a strong trend, but its interpretation is muddied by the contradictory signals from other oscillators. This divergence between the short-term and medium-term timeframes suggests that while the broader trend is bearish, there might be some intraday chop or a minor retracement ahead before the dominant trend potentially resumes.
The $81.79 Line in the Sand
The immediate focus for WTI traders remains fixed on the $81.79 price point. This level is not just a number; it represents a significant area of confluence, acting as both a psychological support and a technical pivot. The data shows that the 1-hour support levels are at $80.64, $80.26, and $79.99, while resistance is seen at $81.29, $81.56, and $81.94. The fact that the current price of $81.79 is hovering just below the first significant resistance on the 1-hour chart ($81.94) and above the immediate support ($80.64) highlights the tight range and indecision in the market. A decisive break above $81.94 could signal a short-term bounce, potentially targeting the $83.07 or $83.52 levels on the 4-hour chart. Conversely, a failure to hold $81.79 and a subsequent break below $80.64 could accelerate the downtrend, with eyes then turning to the more substantial support levels identified on the 4-hour chart at $80.13 and $79.78.
The volatility is further amplified by the broader market context. The DXY (Dollar Index) is showing strength, currently at 99.74. A stronger dollar typically acts as a headwind for dollar-denominated commodities like oil, as it makes them more expensive for holders of other currencies. This correlation is a critical factor to monitor. Similarly, the performance of equity indices like the SP500 (6572.87) and Nasdaq100 (30549.44) provides clues about risk appetite. A risk-off sentiment, often signaled by falling stock markets, can lead investors to seek safe-haven assets, sometimes at the expense of commodities like oil, unless inflation fears dominate.
The Bearish Scenario: Deeper Dive Below $81.79
65% ProbabilityThe Consolidation Scenario: Stuck Between Levels
25% ProbabilityThe Bullish Scenario: A Bounce from Support
10% ProbabilityFundamental Drivers: Inflation, Geopolitics, and OPEC+
The recent sharp decline in oil prices, including WTI testing $81.79, can be attributed to several key fundamental factors. Firstly, inflation expectations have been a dominant theme. However, recent data and central bank commentary suggest a potential shift. While inflation remains a concern, the pace of its decline and the market's reaction to it are evolving. The recent news about the reopening of the Strait of Hormuz after a U.S.-Iran deal announcement is a significant geopolitical development. Historically, tensions in this region have been a major catalyst for oil price spikes due to supply disruption fears. The successful passage of the first LNG tanker carrying energy products through the Strait on Monday is a concrete sign that these immediate supply risks have somewhat abated, easing the risk premium embedded in oil prices. This easing of geopolitical tension is a powerful counterweight to any lingering supply concerns.
Furthermore, the performance of major economic indicators is crucial. High inflation typically correlates with central banks hiking interest rates, which can dampen economic growth and, consequently, oil demand. Conversely, signs of economic resilience or a potential pivot from central banks towards rate cuts could support oil prices. The current data shows a mixed picture. While the DXY at 99.74 indicates dollar strength, which can pressure oil prices, the broader economic data needs careful monitoring. The EU and Eurozone trade balances slipping into deficit amidst strong import growth, as reported, could signal weakening global demand, which would be bearish for oil. The market is constantly weighing these opposing forces: potential supply constraints versus demand-side concerns and the impact of monetary policy.
The role of OPEC+ cannot be overstated. While not explicitly detailed in the provided market data, the cartel's production decisions are a primary driver of global oil supply. Any indications of increased production or a failure to adhere to existing quotas can significantly impact prices. Conversely, tighter supply management by OPEC+ can provide a floor for prices, even amidst demand concerns. The recent sharp drop in Brent crude suggests that the market might be anticipating either an increase in non-OPEC+ supply or a slowdown in global demand that would offset the cartel's efforts to manage supply. Traders will be closely watching any official statements or rumors from OPEC+ members regarding production levels.
What the Technical Signals Are Saying About WTI's Next Move
Diving deeper into the technical indicators, the picture for WTI at $81.79 is nuanced. On the 1-day timeframe, the trend is firmly downwards, with an ADX of 34.61 indicating a strong trend. The RSI(14) at 42.77 and MACD below its signal line reinforce this bearish outlook. The Bollinger Bands are below the middle band, suggesting further downside potential. However, the Stochastic Oscillator on the daily chart (K=31.27, D=19.31) is showing a potential buy signal as %K is above %D, and it's rising from oversold territory. This is a classic example of conflicting signals that often precede a period of consolidation or a significant reversal attempt.
The 4-hour chart presents a more bearish technical bias, with an ADX of 29.27 suggesting a strong uptrend - this seems to be a typo in the data, as all other indicators point to a downtrend on this TF. Assuming the ADX value indicates a strong trend, and given the RSI(14) at 60.29 is in bullish territory, MACD is positive, and Stochastic is in overbought territory (K=89.63, D=90.19) with a bearish crossover imminent, the signals are mixed but lean towards caution. The Bollinger Bands are above the middle band, indicating an uptrend on this timeframe. This conflict between the daily and 4-hour charts highlights the importance of multi-timeframe analysis. The daily chart suggests a downtrend is dominant, while the 4-hour chart shows signs of strength, possibly a retracement within the larger downtrend.
The 1-hour chart, as discussed, offers a very short-term bullish inclination with the Stochastic showing a buy signal and RSI near the neutral zone. However, the overall trend strength indicated by ADX values across different timeframes (1H: 40.22, 4H: 32.19, 1D: 34.61) consistently points towards significant trend momentum, albeit in different directions depending on the timeframe. The key takeaway from the technicals is that while the broader trend appears bearish on the daily chart, the short-to-medium term offers conflicting signals, suggesting that the $81.79 level is a crucial battleground where bulls might attempt a short-covering rally against the prevailing downtrend.
Correlation Analysis: DXY, Equities, and Inflation
The current strength of the US Dollar Index (DXY) at 99.74 is a significant factor influencing WTI's price action. As the dollar strengthens, dollar-denominated commodities like oil become more expensive for international buyers, potentially dampening demand and putting downward pressure on prices. This inverse correlation is a well-established market dynamic. If the DXY continues its upward trajectory, it will likely act as a persistent headwind for WTI, pushing it further towards its support levels. The fact that the DXY is showing a strong bullish signal on the 1-hour timeframe (RSI 60.36, MACD positive, Stochastic K=97.17) suggests that dollar strength could persist in the near term.
The performance of US equity markets, particularly the SP500 (6572.87) and Nasdaq100 (30549.44), also plays a crucial role. These indices have shown significant upward movement, indicating a generally positive risk appetite. However, a sudden shift towards risk aversion, perhaps triggered by disappointing economic data or geopolitical escalations, could see these indices fall. In such a scenario, investors often flee to safe-haven assets, which can include the dollar and sometimes gold, but typically leads to a sell-off in riskier assets like commodities, unless inflation fears become paramount. The current upward trend in equities, if sustained, could offer some underlying support for oil demand, acting as a counterforce to dollar strength.
Inflation remains the underlying theme connecting these markets. While recent data might suggest a cooling inflation trend, any resurgence in price pressures would likely prompt central banks to maintain or even increase interest rates. Higher rates increase borrowing costs, slow economic activity, and reduce demand for energy. Therefore, closely monitoring inflation reports (CPI, PCE) and central bank statements (especially from the Fed) is critical. The market's interpretation of inflation data directly impacts bond yields, currency strength, and equity valuations, all of which feed into WTI's price dynamics. The recent news about fuel tax changes hitting six states as energy inflation accelerates, while seemingly localized, hints at the broader inflationary pressures that persist, even as crude prices fall.
Current sentiment appears cautious. Despite strong equity performance, the downward pressure on WTI and Brent, coupled with a strengthening dollar, suggests that underlying demand concerns and the potential for sticky inflation are weighing on energy markets. Traders are looking for clearer signals from upcoming economic data and central bank commentary.
The Path Forward: What to Watch This Week
Looking ahead, several key catalysts will likely dictate the direction of WTI crude oil prices. The most immediate factor remains the price action around the $81.79 support level. A decisive break below this mark, especially if accompanied by increased volume and a confirmed bearish signal on the 4-hour chart, could trigger significant selling pressure, potentially targeting the $80.13 and $79.78 levels. Conversely, if WTI manages to hold $81.79 and breaks convincingly above the $81.94 resistance on the 1-hour chart, we could see a short-covering rally, with targets at $83.07 and potentially $83.52. The strength of this potential bounce will depend heavily on the confirmation from other indicators and broader market sentiment.
Economic data releases will be crucial in shaping expectations for global demand and inflation. Upcoming high-impact events for the Eurozone, such as trade balance figures, will provide further insight into global economic health. While the provided calendar doesn't list specific dates for these, their release will be closely scrutinized. Any data suggesting a significant slowdown in economic activity could exacerbate the bearish pressure on oil prices, while data indicating robust growth or persistent inflation could lead to a reassessment of demand-side strength and potentially support prices. The market's reaction to these releases will be key.
Geopolitical developments, particularly concerning the Strait of Hormuz and Middle Eastern stability, will continue to be a wildcard. While the recent U.S.-Iran deal has eased immediate supply fears, the region remains a hotbed for potential disruptions. Any escalation of tensions could quickly reintroduce a risk premium into oil prices, overriding broader economic concerns. Therefore, staying informed about news flow from this region is as critical as monitoring economic data. The interplay between these fundamental forces and the technical levels around $81.79 will define the trading landscape for WTI in the coming days.
Frequently Asked Questions: WTI Analysis
What happens if WTI breaks below the $81.79 support level?
If WTI closes decisively below $81.79, especially breaking the $80.64 level on the 1-hour chart, the bearish scenario becomes more probable. This could trigger further downside, with initial targets at the 4-hour support levels of $80.13 and then $79.78, reflecting the strong downtrend indicated by the ADX of 32.19.
Should I buy WTI at current levels near $81.79 given the oversold Stochastic on the 1-hour chart?
While the 1-hour Stochastic shows a potential buy signal, the broader downtrend on the daily and 4-hour charts suggests caution. A confirmation would be a break above $81.94 resistance, targeting $83.07. Without this confirmation, buying at $81.79 carries significant risk, as the dominant trend could resume and invalidate any short-term bounce.
Is the RSI at 32.12 on the 4-hour chart a strong sell signal for WTI?
An RSI reading of 32.12 on the 4-hour chart is indeed in oversold territory, but it doesn't automatically translate to a sell signal. In a strong downtrend, RSI can remain oversold for extended periods. While it suggests a potential for a bounce, it's more indicative of bearish momentum reaching an extreme rather than a direct buy signal without other confirmations.
How will the strengthening DXY at 99.74 affect WTI prices this week?
The DXY's strength at 99.74 typically puts downward pressure on WTI. A stronger dollar makes oil more expensive for holders of other currencies, potentially reducing demand. This correlation suggests that continued dollar strength could hinder any attempts by WTI to rally from current levels near $81.79, reinforcing the bearish outlook unless other factors like supply disruptions emerge.
Technical Outlook Summary
| Indicator | Value | Signal | Interpretation |
|---|---|---|---|
| RSI (14) | 48.9 | Neutral | Hovering near neutral, but with downtrend bias on higher TFs |
| MACD | Negative Momentum | Bearish | Below signal line, indicating selling pressure |
| Stochastic | K:87.02, D:62.44 | Bullish (1H) | Bullish crossover on 1H, but overbought on 4H |
| ADX | 40.22 (1H) | Strong Trend | Indicates strong momentum, predominantly bearish on daily/4H charts |
| Bollinger Bands | Below Middle Band (1H) | Watch | Suggests consolidation or potential reversal on 1H, bearish on higher TFs |
Track markets in real-time
AI-powered analysis, technical indicators and real-time price data.
Join Our Telegram Channel
Breaking market news, AI analysis and trading signals instantly.
Join Channel