The Battleground at $81.24: WTI Crude Oil Caught Between Bullish Momentum and Bearish Signals
Time Horizon: This analysis focuses on short-to-medium term trading signals, spanning 1-hour to 1-day timeframes.
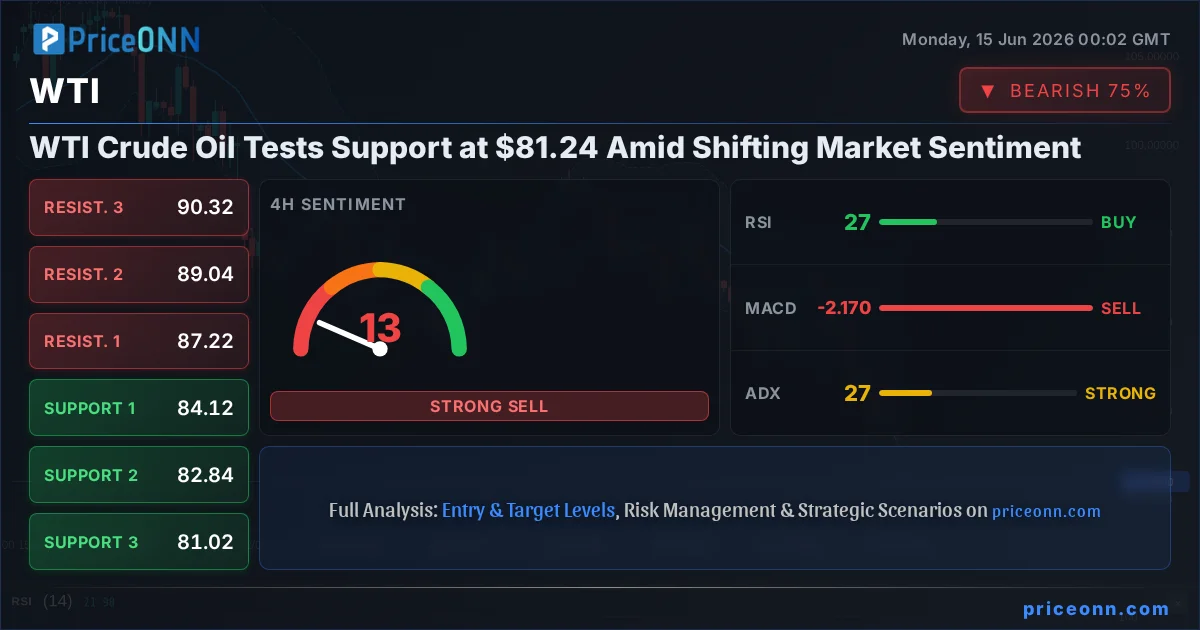
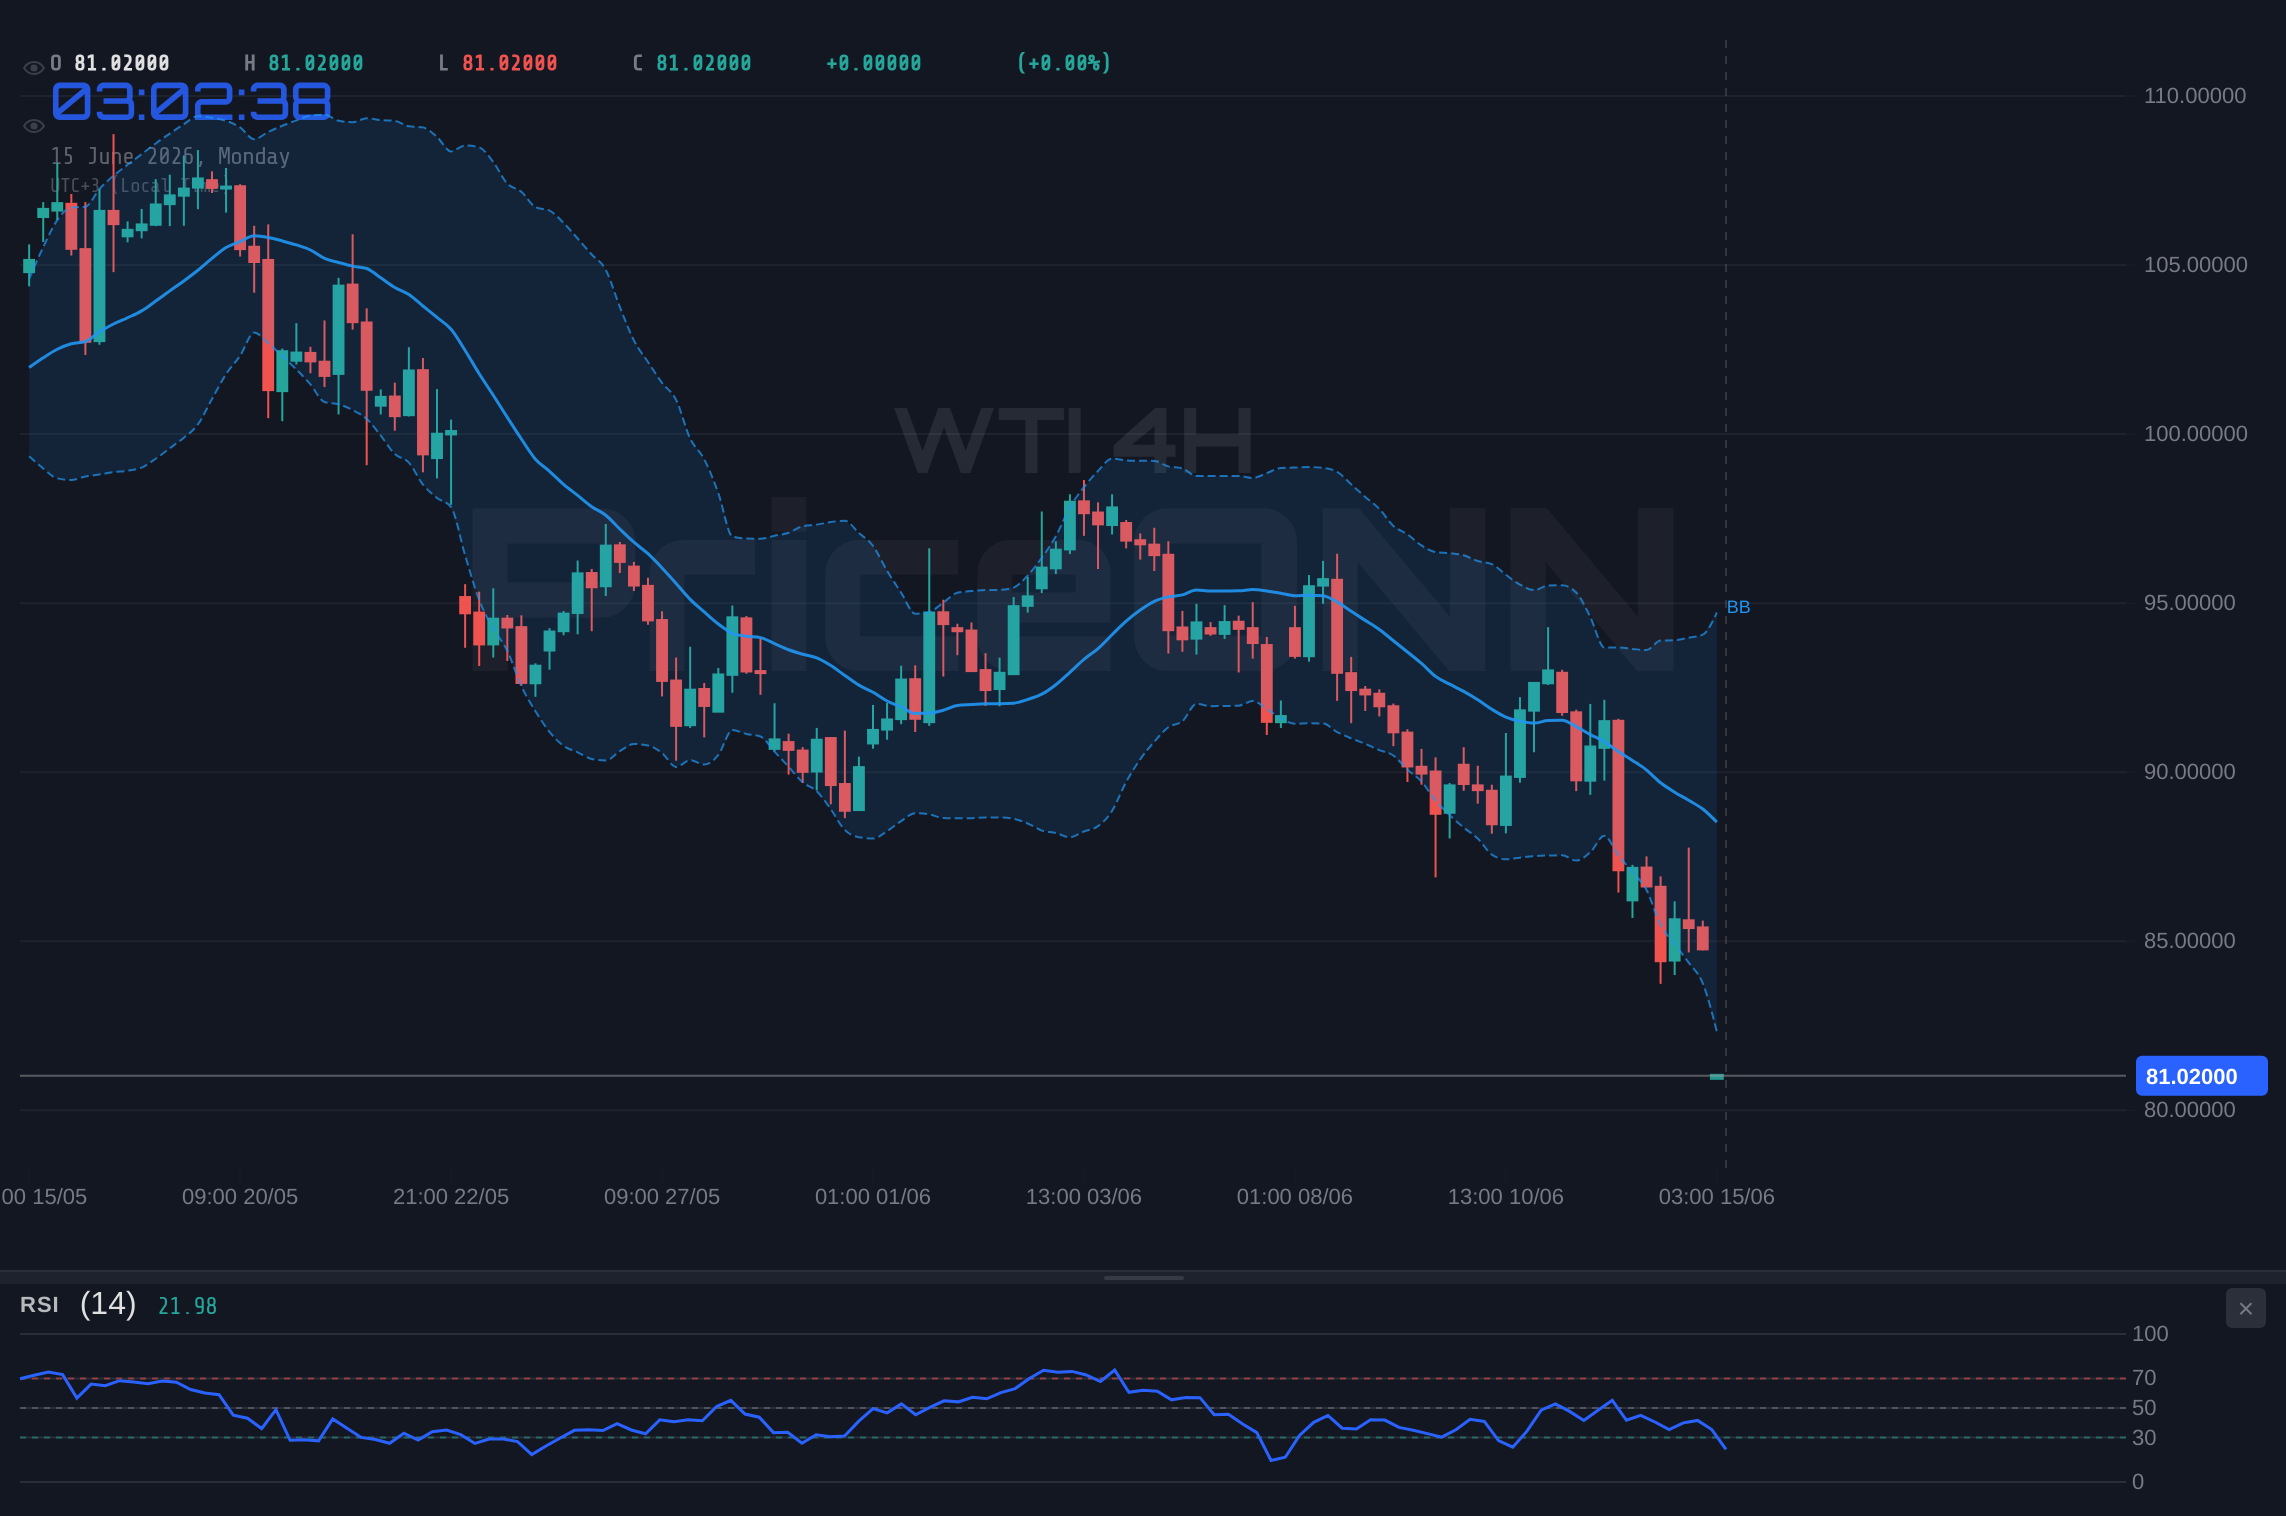
The energy markets are currently witnessing a pivotal moment for West Texas Intermediate (WTI) crude oil, with the price hovering around the critical $81.24 mark. This level is more than just a number; it represents a fierce tug-of-war between prevailing bullish momentum and emerging bearish signals, as indicated by a complex interplay of technical indicators and market sentiment. Having recently experienced a sharp decline, WTI is now finding itself at a crossroads, where a breakdown could signal deeper losses, while a hold of this support might reignite upward potential. The current technical picture, characterized by conflicting readings across various timeframes, demands a nuanced approach from traders and investors alike. Understanding the underlying drivers, from the broader macroeconomic landscape to the specific chart patterns, is paramount in navigating this volatile environment. This deep dive aims to dissect the forces at play, offering a clear perspective on the potential paths forward for WTI.
- WTI crude oil is currently trading at $81.24, testing key support levels.
- The ADX at 26.61 indicates a strong downward trend on the daily chart, while 1H and 4H charts show mixed signals.
- RSI readings are in oversold territory on shorter timeframes (1H: 25.46, 4H: 27.2), suggesting potential for a short-term bounce.
- The correlation with a strengthening DXY (99.54) adds downward pressure on oil prices.
Decoding the WTI Price Action: A Tale of Two Trends
The Daily Chart's Bearish Narrative
On the daily timeframe, the narrative for WTI crude oil is decidedly bearish, painting a picture of significant downward pressure. The current price of $81.24 finds itself well within a broader downtrend, with the daily ADX standing at 26.61. This reading suggests a strong trend is in play, and crucially, the trend is downwards. The MACD indicator on the daily chart further reinforces this bearish outlook, showing negative momentum with the MACD line positioned below its signal line. This indicates that selling pressure has been dominant and is continuing to build. Bollinger Bands on the daily chart are also printing below the middle band, a classic sign of bearish sentiment and potential for further downside. While the Stochastic oscillator shows K=18.12 and D=33.85, which technically suggests a potential for an upward move as %K
Short-Term Signals: A Glimmer of Hope?
However, the story shifts dramatically when we zoom into the shorter timeframes. On the 1-hour chart, WTI is showing a general signal of 'SELL' (Al: 2, Sat: 6, Nötr: 0), but the technical readings provide a more complex picture. The RSI(14) is at 25.46, deep within oversold territory. This condition often precedes a short-term bounce as traders look to capitalize on extreme selling. The MACD on the 1H chart also shows negative momentum, aligning with the daily trend, but the Stochastic oscillator (K=9.07, D=18.7) is showing a strong oversold condition with %K
The Bull Case: A Bounce Off the Support Zone?
The bullish argument for WTI crude oil hinges primarily on the oversold conditions present in the shorter timeframes (1H and 4H) and the strategic importance of the $81.24 price level. Traders looking for a bullish setup will point to the RSI values dipping below 30 on both the 1-hour and 4-hour charts as a classic signal for potential reversal. When an asset falls too far, too fast, a snap-back rally often occurs, regardless of the longer-term trend. The fact that WTI is currently testing the daily support level around $81.24 ($81.43 is the closest specific support from the data) is a critical factor. A failure to break decisively below this level could lead to a short-covering rally, pushing prices back towards the $84.26 resistance. The Stochastic oscillators on the 1H and 4H charts are screaming 'oversold', and while they can remain in this territory for extended periods in strong trends, they often precede a bounce. Furthermore, the general 'SELL' signals on the shorter timeframes are accompanied by a considerable number of 'BUY' signals on the 1D timeframe (Al: 6, Sat: 1, Nötr: 0), suggesting that while the daily trend is down, there's a significant divergence in short-term momentum that could fuel a counter-trend move.
From a pure price action perspective, the $81.24 level represents a significant area of interest. Historically, such levels often act as turning points. If WTI can hold this price and begin to consolidate, it might set the stage for a move higher. The immediate resistance levels to watch on the upside would be the 1-hour resistance at $82.03, followed by $82.62, and then the more significant daily resistance at $84.26. A decisive break above $82.62, especially with increasing volume, would lend more credibility to the bullish argument. The market sentiment, while leaning bearish on the daily, could shift rapidly if a catalyst emerges, such as unexpected geopolitical developments or a sudden change in central bank rhetoric that weakens the dollar. The current ADX on the 1H chart is 28.99, indicating a strong trend, but in oversold conditions, this strength can quickly reverse.
The Bear Case: Trend is Friend Until It Breaks
The bearish case for WTI crude oil is built on the foundation of the established daily trend and the prevailing macroeconomic headwinds. The daily chart paints a clear picture: WTI is in a strong downtrend, with an ADX reading of 26.61 confirming trend strength. The MACD is below its signal line, and the Bollinger Bands are below the middle band, all pointing towards continued weakness. The RSI at 34.06, while not extremely oversold, is trending downwards, indicating that the path of least resistance is still to the downside. The primary argument for the bears is that short-term oversold conditions on the 1H and 4H charts are mere pauses in a larger downtrend, not signals of an imminent reversal. History often shows that in strong daily trends, assets can remain 'oversold' for days or even weeks before a significant bottom is formed. The current price of $81.24 is hovering near the first daily support at $81.43, but a break below this level would open the door for a rapid descent towards the next support at $76.41. The fact that the daily chart has a predominantly 'SELL' signal (Al: 1, Sat: 7, Nötr: 0) is a strong indicator that the dominant trend is still in play.
Furthermore, external factors are likely contributing to the bearish pressure. The DXY (Dollar Index) is currently at 99.54 and showing signs of strength, particularly on the 4H chart where it has a 'SELL' signal (Al: 2, Sat: 6, Nötr: 0) but is showing a rising RSI at 46.34. A stronger dollar generally exerts downward pressure on dollar-denominated commodities like oil, making them more expensive for holders of other currencies. Recent news also suggests a challenging environment for oil prices. Reports indicate that fuel tax changes are hitting six states as energy inflation accelerates, and oil markets extended their decline on Friday. While some news mentions rising energy bills fueling a home battery boom, this is a longer-term structural shift rather than an immediate catalyst for crude oil prices. The ongoing geopolitical landscape, while often a driver of volatility, does not currently present a clear bullish narrative for crude oil that outweighs the technical downtrend and macroeconomic pressures. The bears are likely betting on a decisive break of the $81.43 support, which would invalidate any short-term bullish arguments and confirm the continuation of the daily downtrend, targeting lower levels.
Technical Confluence: Indicators Weighing the Scales
When we examine the confluence of technical indicators across different timeframes, the picture for WTI crude oil at $81.24 becomes even more complex, highlighting the uncertainty. On the 1-hour chart, the RSI at 25.46 and Stochastic at K=9.07, D=18.7 are screaming oversold, suggesting a potential for a bounce. However, the MACD shows negative momentum, and the ADX at 28.99 indicates a strong trend. This creates a conflict: oversold oscillators against a strong trend. The 4-hour chart echoes this sentiment, with RSI at 27.2 and Stochastic deeply oversold, yet the ADX at 26.61 still points to trend strength. The MACD here also shows negative momentum. These shorter-term indicators are flashing red for immediate continuation of the downtrend, but they are not yet providing a clear buy signal for a sustained reversal. The daily chart, however, presents a more unified bearish front. The RSI at 34.06 is trending down, MACD shows negative momentum, and the ADX at 26.61 confirms a strong trend. The Stochastic on the daily chart (K=18.12, D=33.85) is also trending down, aligning with the overall bearish structure, despite being in oversold territory.
The conflicting signals between the short-term oversold conditions and the persistent daily downtrend create a high degree of ambiguity. A trader looking for confirmation might wait for a break above the 1-hour resistance of $82.03, or more significantly, a decisive close above the daily resistance at $84.26. Conversely, a breakdown below the immediate daily support at $81.43 would confirm the bearish thesis and likely lead to further selling pressure towards $76.41. The current ADX readings across timeframes (1H: 28.99, 4H: 26.61, 1D: 26.61) are all indicative of a trending market, but the specific directionality is being challenged by the oversold conditions on shorter frames. This suggests that while a trend exists, it's currently in a state of flux, with the market possibly consolidating or preparing for a significant move, the direction of which is not yet clear from the indicators alone. The key will be observing how price reacts to the $81.24 support level and whether the shorter-term oversold signals can overcome the daily bearish momentum.
Trade Scenarios and Probabilities
Bearish Scenario: Trend Continuation
65% ProbabilityNeutral Scenario: Consolidation and Range-Bound Action
25% ProbabilityBullish Scenario: Short-Term Reversal
10% ProbabilityNavigating the Uncertainty: What Traders Should Watch
Given the conflicting signals between the daily bearish trend and the shorter-term oversold conditions, caution is the order of the day for WTI crude oil traders. The immediate focus must be on the $81.24 price level. A decisive break below this point, particularly a close below the closest daily support at $81.43, would likely trigger the bearish scenario, opening up significant downside potential towards $76.41. Bears will be watching for this breakdown as confirmation that the short-term bounces are merely opportunities for further selling. On the other hand, if WTI holds above $81.24 and shows signs of stabilization, traders will be looking for confirmation of a potential short-term rally. This would likely involve a move back towards the $82.62 level on the 1-hour chart, with eyes then set on the more significant daily resistance at $84.26. A bullish confirmation would require sustained buying pressure and a break above these resistance levels, invalidating the prevailing daily downtrend.
The correlation with the DXY (Dollar Index) at 99.54 is also a critical factor. A continued strengthening of the dollar would likely add headwinds to oil prices, reinforcing the bearish sentiment. Conversely, any sign of weakness in the dollar could provide a tailwind for WTI, potentially fueling a bounce. For those looking to trade this setup, risk management is paramount. Entry should be carefully considered, ideally after price action provides clearer confirmation of either a breakdown or a bounce. Scalpers might attempt to trade the short-term oversold bounces, aiming for quick profits before the larger trend reasserts itself. Swing traders, however, would be wise to wait for a clearer signal, either a confirmed break of support or resistance, to avoid getting caught in a whipsaw.
Frequently Asked Questions: WTI Analysis
What happens if WTI breaks below the $81.43 daily support level?
A break below the $81.43 daily support level would invalidate short-term bullish hopes and likely trigger the bearish scenario. This would signal a continuation of the dominant daily downtrend, with the next significant target being the support at $76.41. Bears would gain strong conviction, anticipating further downside.
Should I buy WTI at current levels of $81.24 given the oversold RSI on shorter timeframes?
Buying at $81.24 based solely on oversold RSI on shorter timeframes carries significant risk due to the strong daily downtrend. A more prudent approach would be to wait for confirmation, such as a confirmed bounce off this support with increasing volume, or a break above the 1H resistance at $82.03. Patience is advised, as the probability of a continued downtrend remains higher.
Is the RSI at 25.46 a buy signal for WTI right now?
An RSI reading of 25.46 on the 1-hour chart indicates oversold conditions, which can precede a short-term bounce. However, it is not a standalone buy signal, especially with the daily chart showing a strong downtrend. Confirmation from price action, such as holding above $81.24 and breaking key intraday resistances, is needed for a credible bullish signal.
How will the DXY's current level of 99.54 affect WTI this week?
With the DXY at 99.54 and showing signs of strength on intermediate timeframes, a stronger dollar generally puts downward pressure on dollar-denominated commodities like WTI. This correlation suggests that any further dollar strength could exacerbate WTI's decline, reinforcing the bearish outlook unless other bullish catalysts emerge.
Technical Outlook Summary
| Indicator | Value | Signal | Interpretation |
|---|---|---|---|
| RSI (14) | 34.06 | Neutral | Daily: Downtrending, 1H/4H: Oversold |
| MACD Histogram | - | Bearish | Daily: Negative momentum, 1H/4H: Negative momentum |
| Stochastic | K=18.12, D=33.85 | Bearish | Daily: Downtrending, 1H/4H: Deeply oversold |
| ADX | 26.61 | Bullish | Strong trend on Daily (downward) |
| Bollinger Bands | Below Middle Band | Bearish | Daily: Downtrending, 1H/4H: Oversold |
Key Levels
Support Levels
Resistance Levels
Track markets in real-time
AI-powered analysis, technical indicators and real-time price data.
Join Our Telegram Channel
Breaking market news, AI analysis and trading signals instantly.
Join Channel