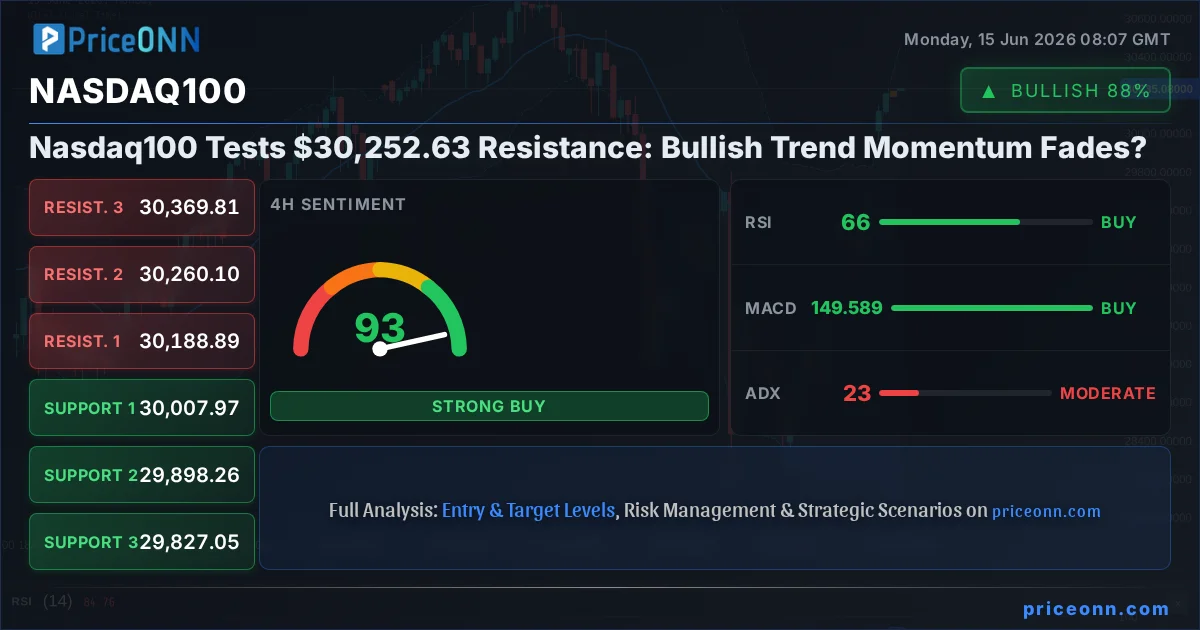
Nasdaq100 today analysis reveals a market at a critical juncture. The index has pushed towards the $30,252.63 resistance level, showcasing significant bullish momentum over the past few sessions. However, as we delve deeper into the technical indicators and market structure, a more nuanced picture emerges. While the bulls have undeniably taken control in the short term, the underlying signs suggest that this rally may be approaching a point where caution is not just advised, but necessary. Understanding the interplay between the current price action, key technical levels, and broader market correlations is paramount for any trader navigating these choppy waters.
- RSI at 66.57 signals a strong uptrend but is approaching overbought territory, indicating potential for a pullback.
- The Nasdaq100 is testing resistance near $30,252.63, a level that has historically seen significant price action.
- ADX at 22.83 suggests a moderate uptrend, but a lack of strong conviction means the market is still susceptible to reversals.
- Correlation with DXY at 99.54 shows a developing inverse relationship, where dollar strength could pressure the index.
Navigating the Nasdaq100's Ascent Towards Key Resistance
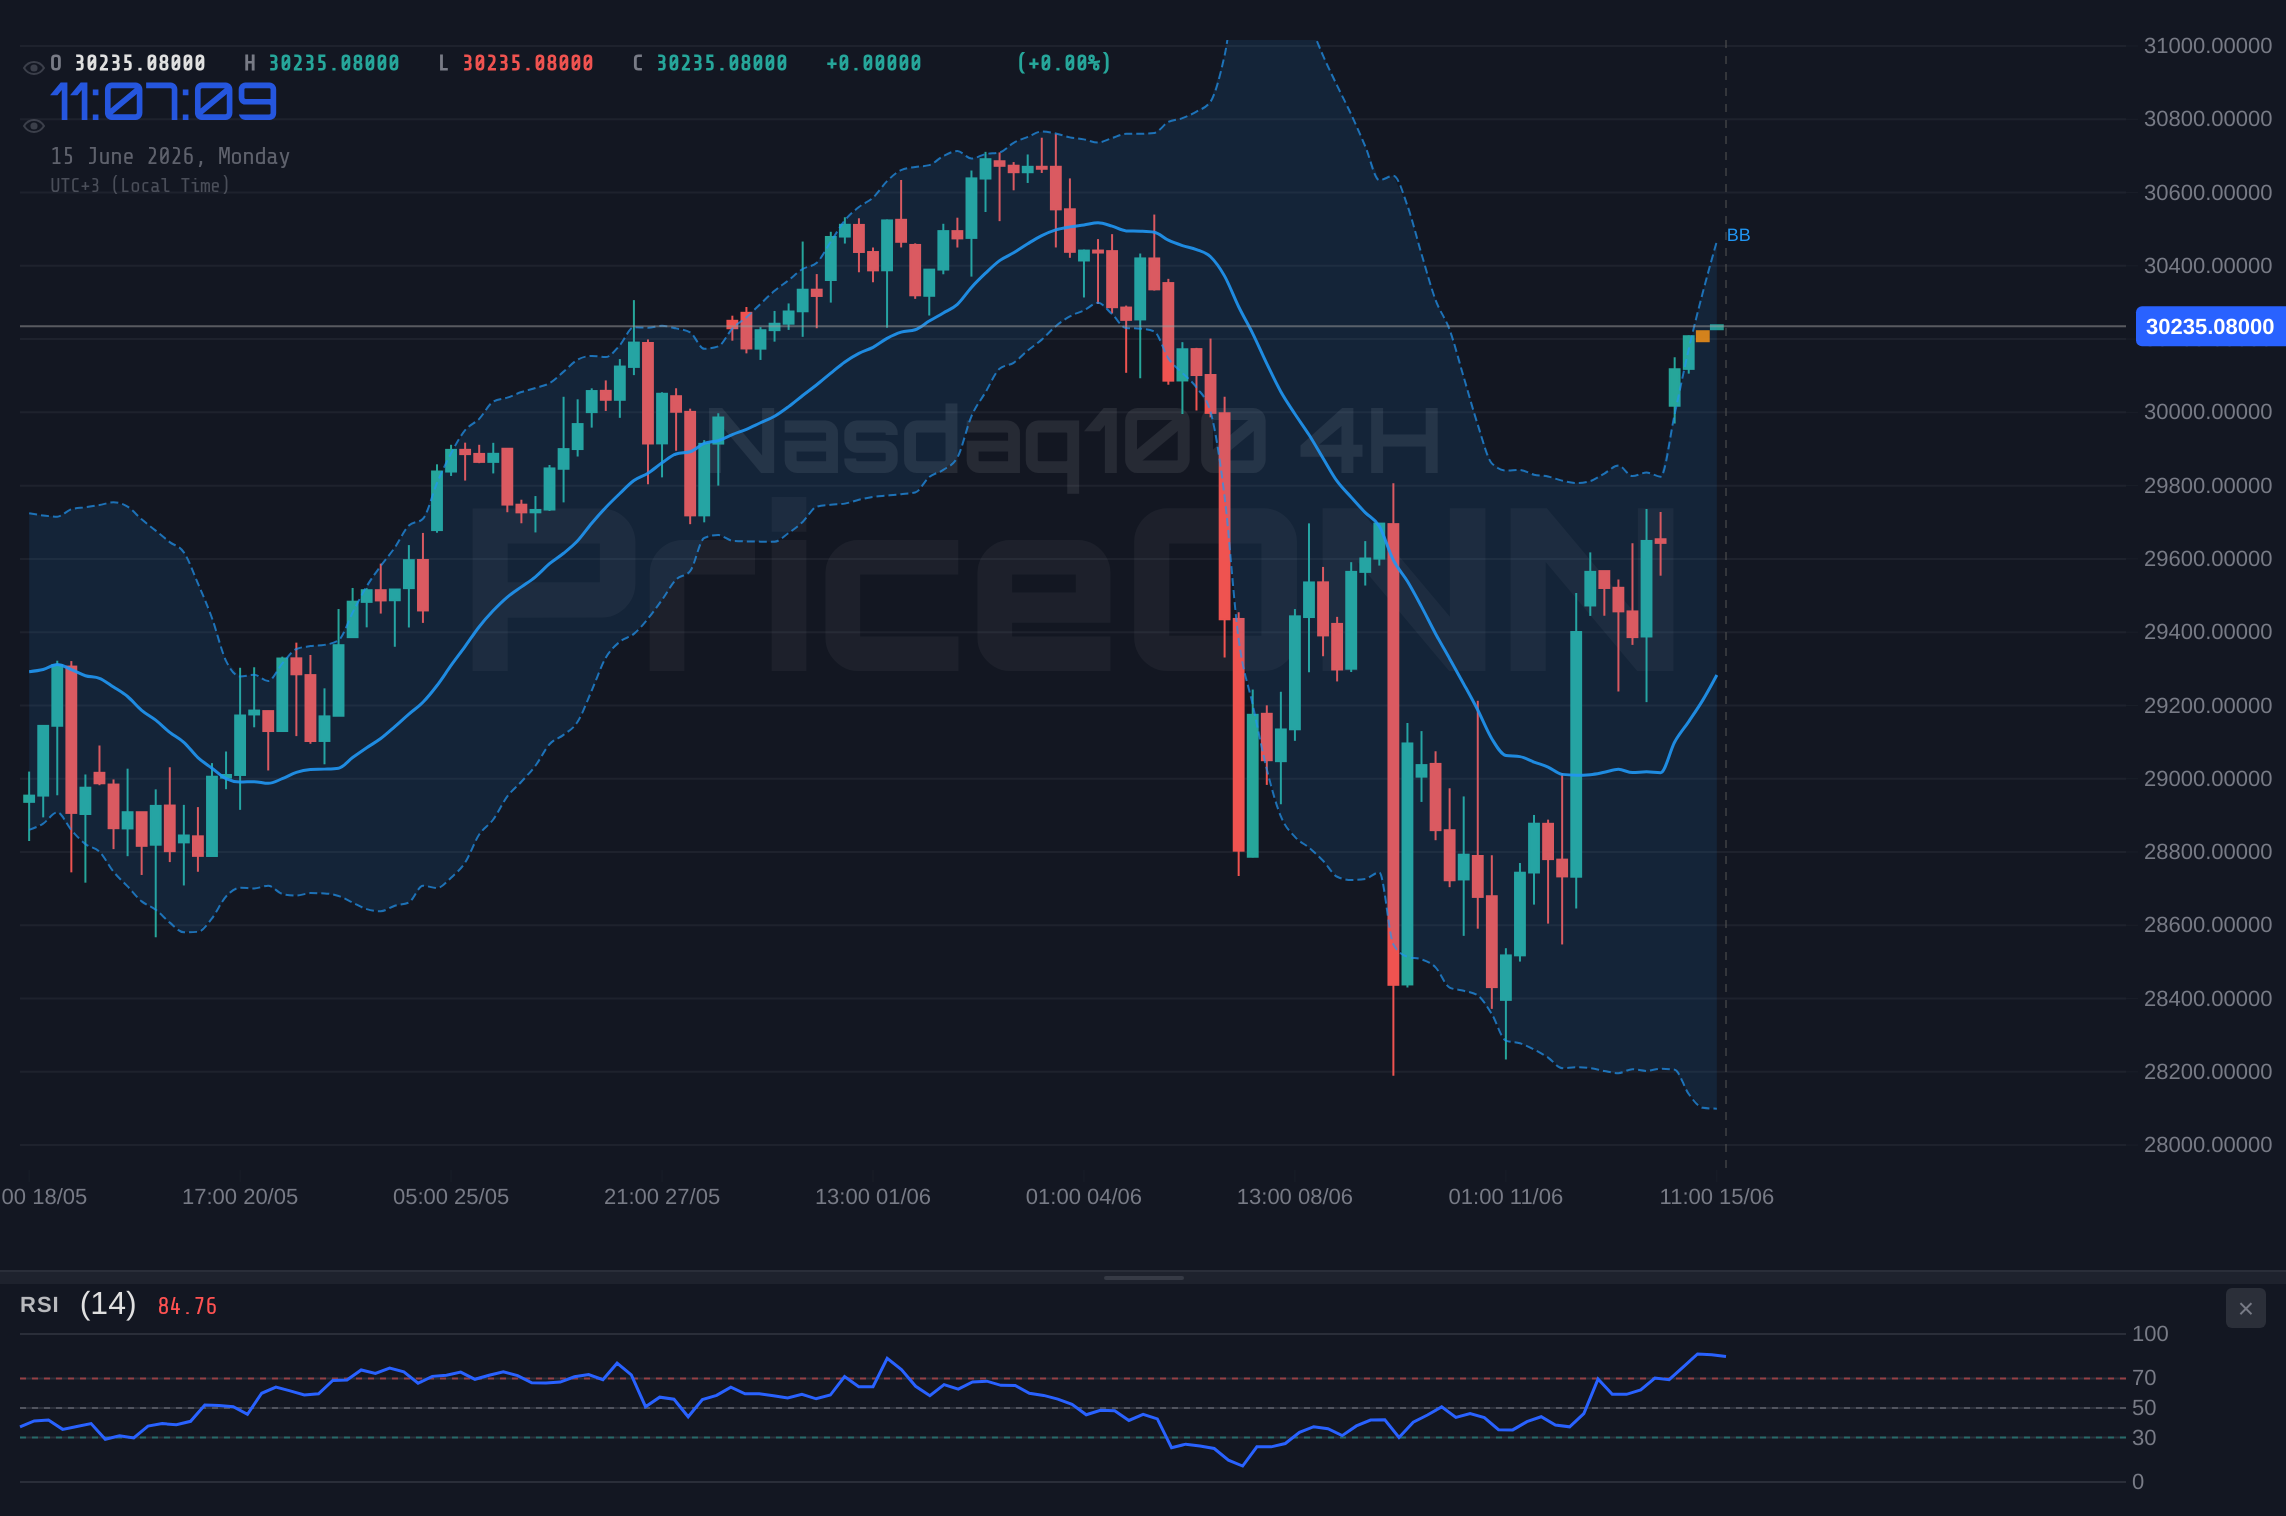
The Nasdaq100 has been on an impressive run, driven by a confluence of factors that have bolstered risk appetite across the tech-heavy index. Currently trading around $30,252.63, the index has experienced a notable surge, particularly evident in the 1-hour and 4-hour timeframes where the trend strength indicators point towards solid upward momentum. The 1-hour chart, for instance, shows a powerful bullish trend with an ADX of 49.72, indicating strong conviction behind the move. This ascent has brought the index to the doorstep of significant resistance, a zone where sellers have previously intervened, potentially capping further upside and leading to profit-taking or a consolidation phase.
The recent upward push is impressive, with the Nasdaq100 gaining 852.23 points on the day, closing at $30,252.63. This rally has been supported by positive momentum across multiple timeframes. On the 4-hour chart, the ADX stands at 24.23, suggesting a developing uptrend, while the MACD remains in positive territory, signaling that buyers are in control. The Stochastic Oscillator on this timeframe is in the extreme overbought zone at 97.85/86.96, which, while confirming the strength of the current move, also raises a red flag for potential exhaustion. This divergence between strong upward price action and overbought oscillator readings is a classic sign that the market may be due for a pause or even a reversal.
Looking at the daily timeframe, the picture becomes more complex. While the 1-hour and 4-hour charts paint a bullish narrative, the daily trend is currently classified as 'Düşüş' (Bearish) with 100% strength, and the RSI sits at 45.35, indicating a prevailing bearish sentiment. This contrast between short-term bullishness and a longer-term bearish trend highlights the ongoing battle between buyers and sellers. The daily MACD is below its signal line, and Bollinger Bands are also indicating a downward inclination. This suggests that while the intraday and short-term trends are positive, the overall market sentiment on a daily basis remains cautious, and any significant shift could quickly unwind the recent gains.
Technical Indicators: Whispers of Caution Amidst the Rally
The Relative Strength Index (RSI) on the 1-hour chart is currently at 70.95, firmly in overbought territory. While this indicates strong buying pressure, it also suggests that the index is becoming overextended and could be due for a correction. A sustained RSI reading above 70 often precedes a pullback, as buyers begin to exhaust themselves and sellers find opportunities to enter the market. The 4-hour RSI at 62.83 is more neutral but still leans towards the bullish side, showing continued upward momentum without being excessively overbought. However, the daily RSI at 45.35 clearly shows that the longer-term trend is not yet convinced by the recent rally, reinforcing the idea that this move might be a retracement within a larger downtrend or a period of consolidation before a significant directional move.
The Moving Average Convergence Divergence (MACD) offers a mixed signal across different timeframes. On the 1-hour chart, the MACD histogram is in negative territory, suggesting that momentum is actually waning despite the price rise, which is a bearish divergence. However, the MACD line is above the signal line, a bullish signal. The 4-hour MACD is in positive territory and the MACD line is above the signal line, indicating bullish momentum. Yet, the daily MACD histogram is negative and the MACD line is below the signal line, reinforcing the bearish sentiment on the longer timeframe. This conflicting MACD signal across timeframes highlights the indecision in the market and the importance of considering multiple perspectives before making a trade.
The ADX (Average Directional Index) provides insight into the strength of the trend. On the 1-hour chart, the ADX is at a high 49.72, indicating a very strong uptrend. This suggests that the recent price action has significant conviction behind it. However, on the 4-hour chart, the ADX drops to 24.23, still indicating a moderate uptrend, but with less conviction. The daily ADX is at 47.51, showing a strong downward trend in the longer term. This divergence in ADX readings across timeframes is crucial. While the short-term trend is strong, the lack of sustained strength on the daily chart suggests that the current rally might be a counter-trend move or a temporary phase within a broader bearish structure. A strong ADX reading on a higher timeframe often signifies a trend that has more staying power.
Key Levels and Price Action Dynamics
The Nasdaq100 is currently pushing against a critical resistance zone. On the 1-hour chart, the immediate resistance is identified at $30,256.63, followed by $30,278.58. A decisive break above these levels, particularly with strong volume, could signal further upside potential. However, the daily chart presents a more formidable resistance at $31,133.11, indicating that even if the index breaks the immediate hurdles, there's a long way to go to challenge the overall bearish trend's upper boundary. The support levels on the 1-hour chart are located at $30,204.88 and $30,182.93. A break below these could signal a short-term reversal, especially if accompanied by increasing volume and bearish indicator signals.
On the 4-hour chart, support is found at $30,188.89 and $30,14.53, while resistance lies at $30,551.93 and $30,61.07. These levels provide a clearer picture of the trading range in the medium term. The proximity of the current price to the 1-hour resistance at $30,252.63 means that any failure to break through could lead to a swift move back towards the support levels. The daily support levels are much further down, with the closest significant support at $29,860.13, followed by $28,587.15. The significant gap between the current price and these daily support levels underscores the risk of a sharp reversal if the bullish momentum falters.
The interplay between these levels and the current market sentiment is key. The fact that the Nasdaq100 is approaching resistance while many indicators on shorter timeframes are showing overbought conditions, coupled with a bearish daily trend, suggests that the risk-reward for new long positions might be deteriorating. Traders will be watching closely to see if the index can decisively break through the immediate resistance levels or if it will face rejection, leading to a potential move back towards the support zones. The volume accompanying any move through these critical levels will be a significant confirmation factor.
Correlation Analysis: DXY and Equity Markets
The Dollar Index (DXY) is currently trading around 99.54, showing a slight upward trend on the 1-hour and 4-hour charts, though it's classified as neutral on the daily timeframe. Historically, a strengthening DXY often puts pressure on risk assets like equities and commodities, including gold. Currently, the DXY's upward movement, albeit modest, could be a subtle headwind for the Nasdaq100. If the dollar continues to gain strength, it might draw capital away from riskier assets, leading to a slowdown or reversal in the Nasdaq100's rally. The inverse correlation between the DXY and major equity indices is a well-established market dynamic, and traders should monitor this relationship closely.
The broader equity market context, represented by the S&P 500 and Nasdaq 100 themselves, shows that the tech-heavy Nasdaq is outperforming. The S&P 500 is also in a bullish trend on the 1-hour chart but shows a bearish daily trend. Its RSI is at 45.35, similar to the Nasdaq100, indicating that the broader market sentiment is also cautious on a daily basis. This indicates that the strength in the Nasdaq100 might be a sector-specific phenomenon or a leading indicator for the broader market. If the S&P 500's bearish daily trend persists, it could eventually drag the Nasdaq100 lower, especially if risk appetite globally starts to wane. The current divergence between the short-term bullishness in Nasdaq and the longer-term bearish signals in both the S&P 500 and Nasdaq's daily charts warrants attention.
Trade Scenarios and Probabilities
Bearish Scenario: Resistance Holds Firm
65% ProbabilityNeutral Scenario: Consolidation Around Resistance
25% ProbabilityBullish Scenario: Breakout Confirmation
10% ProbabilityFrequently Asked Questions: Nasdaq100 Analysis
What happens if Nasdaq100 fails to break above $30,256.63 resistance?
If the Nasdaq100 fails to break above $30,256.63, the primary scenario suggests a move towards support levels at $30,204.88 and potentially $30,182.93. This bearish outlook is favored with a 65% probability.
Should I consider buying Nasdaq100 at current levels of $30,252.63 given the RSI at 66.57?
Buying at current levels carries risk as RSI is approaching overbought territory. A bullish breakout above $30,278.58 with high volume would be a stronger buy signal, but this is currently assigned a lower 10% probability. Caution is advised.
Is the ADX at 22.83 a strong signal for Nasdaq100 trend continuation?
An ADX of 22.83 on the 4-hour chart indicates a moderate uptrend but not a strong commitment. While it supports the current bullish move, it also suggests that the trend is not deeply entrenched and could be vulnerable to reversals, especially if other indicators show divergence.
How will the DXY's current level of 99.54 affect Nasdaq100's price action this week?
The DXY at 99.54 exhibits a slight upward trend on shorter timeframes, which typically creates headwinds for risk assets like the Nasdaq100. If the dollar index continues to strengthen, it could pressure the index lower, potentially contributing to the bearish scenario with a 65% probability.
Track markets in real-time
AI-powered analysis, technical indicators and real-time price data.
Join Our Telegram Channel
Breaking market news, AI analysis and trading signals instantly.
Join Channel