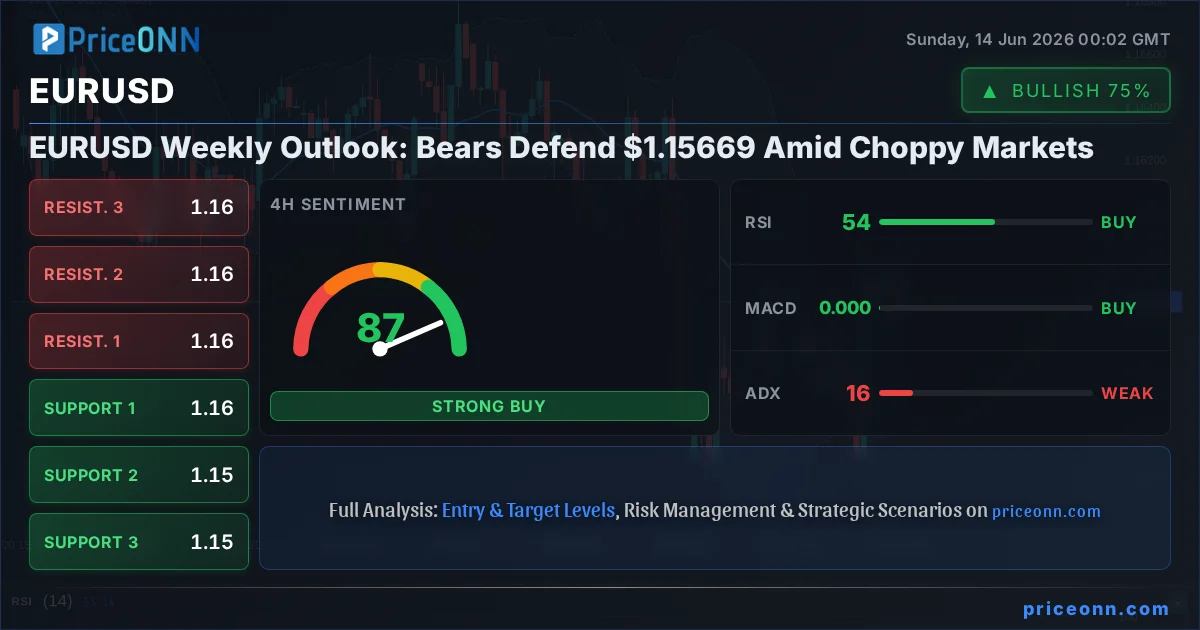
The EURUSD pair finds itself at a critical juncture, trading around the $1.15669 mark as last week concluded with a palpable sense of indecision. Last Friday's close saw the pair teetering, reflecting a market caught between conflicting signals and a lack of strong directional conviction. While the Dollar Index (DXY) showed signs of weakness, the Euro struggled to capitalize, painting a picture of a market that’s more range-bound than trending. This analysis delves into the technical underpinnings, fundamental whispers, and the crucial levels to watch as we navigate the week ahead, dissecting the tug-of-war between the bulls and the bears.
- EURUSD is trading around $1.15669, showing indecision with mixed technical signals.
- Critical support for EURUSD is located at $1.15203, while resistance looms at $1.15605.
- The ADX at 15.64 indicates a weak trend, suggesting choppy, range-bound conditions.
- DXY's recent movements and upcoming economic data releases will be key catalysts for EURUSD direction.
The Battleground: $1.15669 and the Fight for Direction
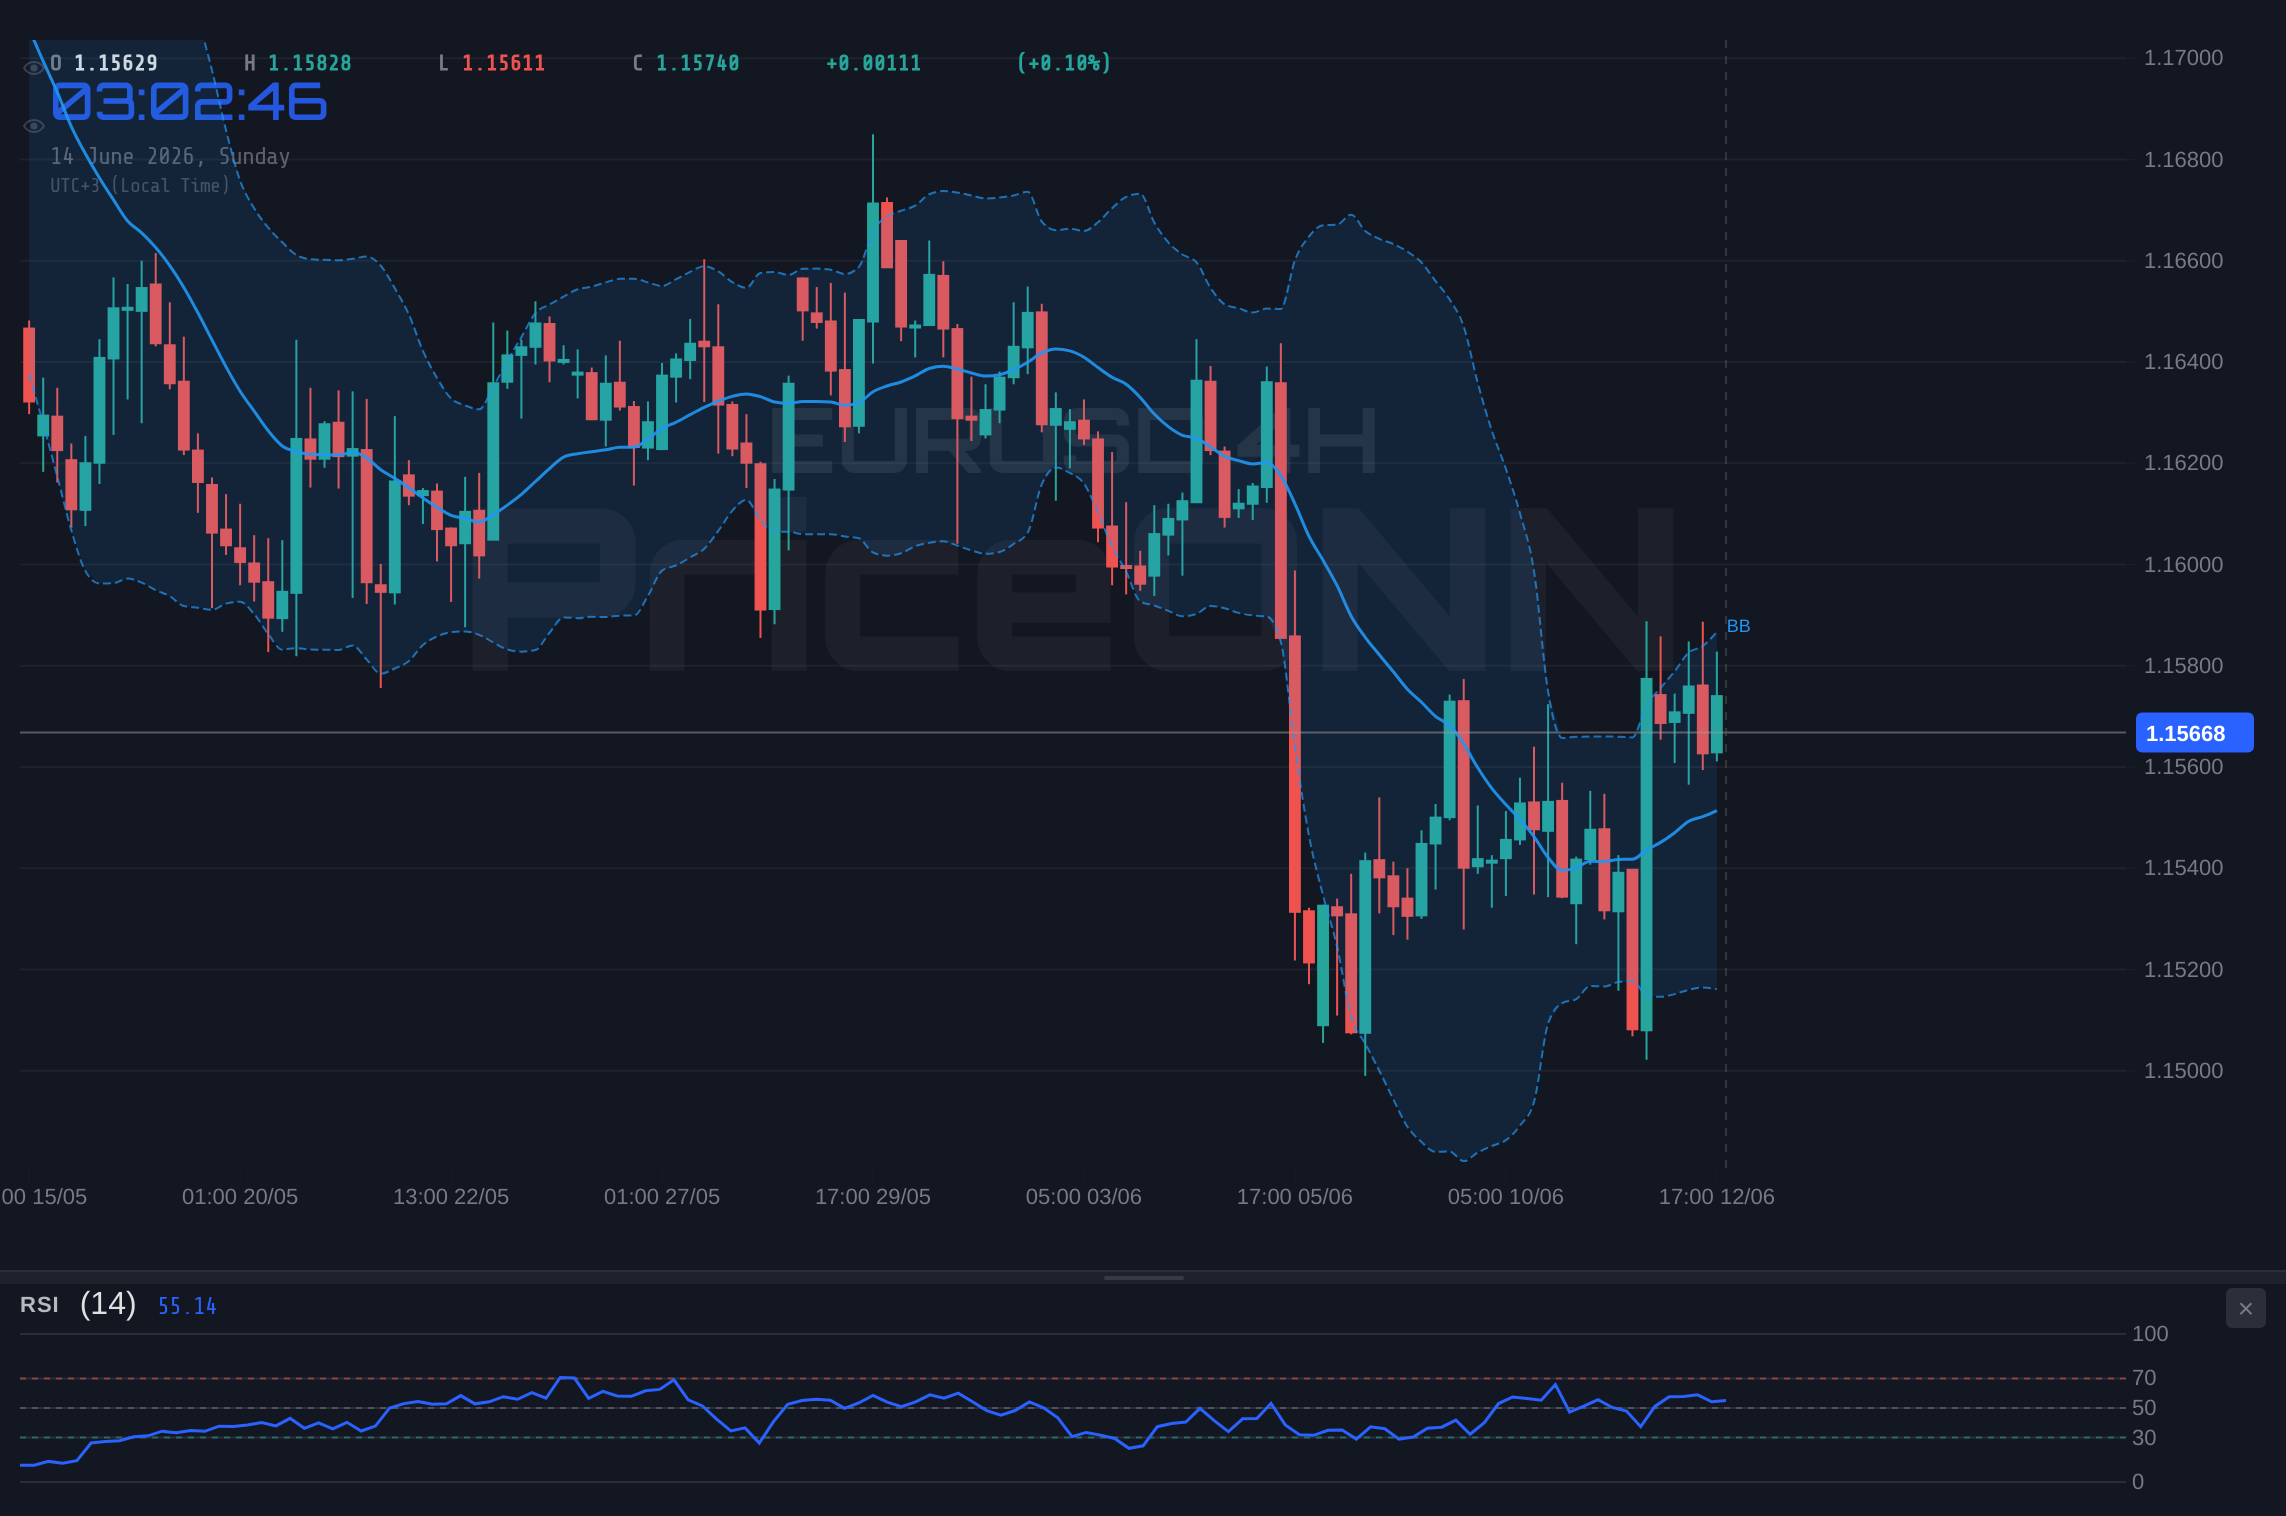
The $1.15669 level has become the focal point for EURUSD traders as the week drew to a close. This price point represents more than just a number; it's a battleground where the bulls and bears are currently locked in a tense standoff. Last week’s price action was characterized by a lack of sustained momentum in either direction, a common theme when key economic data points fail to provide a clear narrative or when central bank policy remains ambiguous. The Dollar Index (DXY), a crucial barometer for the greenback's strength, saw some fluctuations but ultimately failed to establish a decisive trend, mirroring the indecision seen in EURUSD. This environment of uncertainty often leads to choppy price action, where short-term gains are quickly eroded, and traders are left searching for the next catalyst. The daily chart for EURUSD clearly illustrates this struggle, with price oscillating around the 1-day middle Bollinger Band and showing little adherence to a strong trend. The ADX, reading a mere 19.51 on the daily timeframe, reinforces this notion of a weak trend, suggesting that any moves might be more noise than signal until a significant event or data release forces a breakout. This lack of clear trend makes it challenging for both short-term scalpers and longer-term swing traders, demanding a more cautious and level-dependent approach.
Looking at the intraday charts, the 1-hour timeframe presents a slightly more optimistic picture for the bulls, with a general signal leaning towards 'BUY'. However, this is quickly tempered by the 4-hour chart, which shows a 'BUY' signal but indicates a strong downtrend bias (88% strength), and the daily chart, which firmly sits in the 'SELL' camp with a 90% downtrend strength. This multi-timeframe divergence is precisely what creates this trading vacuum. The Stochastic Oscillator on the 1-hour chart is showing a bullish crossover (%K > %D), while on the daily, it’s also signaling a potential rise after being in oversold territory. Yet, the RSI on the daily is languishing at 44.03, indicating a bearish bias, while the 1-hour RSI is at 53, suggesting a neutral-to-slightly bullish stance. This technical cacophony is the primary reason for the current stalemate around $1.15669. Traders are essentially waiting for a clearer signal from either the macroeconomic front or a decisive breach of key technical levels to commit to a direction.
The Bull Case: Can a Weak Dollar Ignite a Euro Rally?
Despite the prevailing indecision, there are arguments to be made for a bullish scenario for EURUSD. The most significant tailwind for the Euro would be a sustained weakening of the US Dollar. The Dollar Index (DXY) itself is exhibiting mixed signals across timeframes. While the 1-day chart shows a strong uptrend (88% strength) with RSI at a healthy 64.37, the 1-hour and 4-hour charts present a more neutral to slightly weakening picture, with RSI readings around 51 and 53 respectively. This divergence within the DXY itself suggests potential for a dollar pullback. If the DXY were to break decisively below its 4-hour support at 99.70, it could open the door for a move towards 99.48 and potentially lower. Such a move would typically provide a boost to EURUSD. Furthermore, the 4-hour chart for EURUSD, despite its downtrend bias, is showing a 'BUY' signal with Stochastic in an upward trajectory and RSI at a neutral 54.23. The 1-hour chart is even more constructive, with a 'BUY' signal, a bullish Stochastic crossover, and RSI moving up from neutral territory. If the bulls can manage to push EURUSD above the immediate 1-hour resistance at $1.15773, the next target would be $1.15807, and a sustained break above $1.15836 could signal a short-term upside move towards the 4-hour resistance at $1.15811, and potentially challenge the daily resistance at $1.15605.
From a fundamental perspective, any signs of cooling inflation in the US, or conversely, sticky inflation in the Eurozone coupled with hawkish remarks from the European Central Bank (ECB), could also support a EURUSD rally. While recent news flow has been mixed, with some reports indicating sticky inflation and others suggesting a potential de-escalation in geopolitical tensions (which could reduce safe-haven demand for the dollar), the market is highly sensitive to any hints about future interest rate policy. If the Federal Reserve signals a pause or a pivot in its monetary policy sooner than anticipated, while the ECB maintains a hawkish stance, the interest rate differential could narrow, favoring the Euro. The recent surge in oil prices, while currently showing signs of a pullback, has historically been a driver of inflation expectations. Should oil prices remain elevated or rebound, it could complicate the Fed's inflation fight, potentially leading to a weaker dollar. The $1.15605 daily resistance level becomes a key hurdle. A decisive close above this level on the daily chart, supported by a weakening DXY, would be a strong signal for the bulls, potentially opening up a move towards the next daily resistance at $1.15865 and beyond.
However, the technical picture on the daily timeframe remains a significant headwind for the bulls. The downtrend is firmly entrenched, with RSI at 44.03, MACD in negative territory, and price consistently trading below the middle Bollinger Band. A daily close above $1.15605 is crucial, but even then, the pair would face stiff resistance around $1.15865. For a sustained rally, a break and hold above the $1.16000 psychological level, and subsequently the 4-hour resistance at $1.16104, would be necessary. This would require a significant shift in market sentiment and a clear catalyst, such as a dovish surprise from the Fed or a surprisingly strong economic outlook for the Eurozone.
The Bear Case: Dollar Strength and Euro Weakness Persist
On the flip side, a compelling case can be made for the bears to regain control of EURUSD. The primary driver for this scenario would be a resurgence in US Dollar strength, perhaps fueled by persistent inflation data or hawkish rhetoric from Federal Reserve officials. The daily DXY chart, with its strong uptrend and RSI above 60, indicates underlying strength that could reassert itself. If the DXY breaks above its daily resistance at $99.92 and consolidates above $100.04, it would likely exert significant downward pressure on EURUSD. The current daily technicals for EURUSD are predominantly bearish: RSI at 44.03 suggests room for further downside, MACD is showing negative momentum with the histogram below the signal line, and price is trading below the daily middle Bollinger Band, indicating a bearish bias. The immediate daily support at $1.15203 is a critical level to watch. A break below this would confirm the bearish sentiment and open the path towards the next support at $1.15061, and potentially challenge the lower boundary of the 4-hour support zone around $1.14801.
Fundamental factors could also bolster the bearish case. If upcoming economic data from the Eurozone, such as inflation or GDP figures, disappoints significantly, it could lead the ECB to adopt a more dovish stance or at least temper expectations for future rate hikes. Conversely, stronger-than-expected US economic data, particularly employment numbers or inflation reports, could reinforce the Fed's hawkish leanings, widening the interest rate differential and making the dollar more attractive. The recent geopolitical developments, while initially suggesting a de-escalation that weakened the dollar, could easily reverse. Any renewed tensions in the Middle East, for instance, would likely see a flight to safety, benefiting the US Dollar as a safe-haven asset. The $1.15669 level, which has acted as a pivot, could become a resistance point on any failed upside attempts. A daily close below $1.15203 would be a strong bearish signal, suggesting a move towards the lower end of the weekly range.
The 4-hour chart, while showing some conflicting signals like a Stochastic crossover, still has a strong downtrend bias (88% strength) and ADX at 32.46, indicating a solid trend in play. If the bears manage to push EURUSD below the $1.15203 support, the path to $1.15061 and $1.14801 becomes clearer. The 1-hour chart's bullish signals could simply represent temporary bounces within a larger downtrend, easily invalidated if the daily and 4-hour bearish momentum reasserts itself. The key for the bears is to hold the price below the $1.15605 daily resistance and break through the $1.15203 support decisively. A close below $1.15061 would significantly increase the probability of a further decline towards the $1.14801 level.
Navigating the Neutral Zone: What the Indicators Tell Us
The current technical landscape for EURUSD is a complex tapestry of conflicting signals, largely driven by the weak trend indicated by the ADX across multiple timeframes. On the 1-hour chart, the ADX is at 17.43, suggesting a lack of strong directional momentum. Similarly, the 4-hour ADX at 15.64 and the daily ADX at 19.51 all point to a market that is either consolidating or experiencing choppy, range-bound price action. This is precisely why the 'Neutral' signal on the 1-hour timeframe (4 Buy, 4 Sell) and the mixed signals across indicators are so prevalent. The RSI readings are also telling a story of indecision: 53 on the 1-hour, 54.23 on the 4-hour, and 44.03 on the daily. These are all within the neutral zone, neither screaming 'overbought' nor 'oversold', but rather indicating that the market is balanced or leaning slightly bearish on the daily. The MACD provides a mixed bag too. On the 1-hour, it shows negative momentum but a potential bullish crossover, while on the 4-hour, it's positive but on the daily, it's clearly negative. This lack of clear confirmation from these leading indicators means that traders should be wary of expecting large, sustained moves in either direction without a significant catalyst.
The Stochastic Oscillator offers a slightly more nuanced view. On the 1-hour, it shows a bullish crossover (%K > %D), suggesting potential for a short-term move up. The 4-hour Stochastic is also bullish, but it’s approaching overbought territory (K=79.29, D=69.55), which could signal a potential reversal or consolidation. The daily Stochastic shows a bullish signal (%K > %D) after being oversold, which is often a sign of a potential bottoming process, but it needs confirmation from other indicators and price action. Bollinger Bands also reflect this choppiness. On the 1-hour, price is below the lower band, suggesting potential oversold conditions or a strong downtrend. On the 4-hour and daily, price is below the middle band, indicating bearish pressure but not extreme conditions. The confluence of these indicators suggests a market that is awaiting direction. The ADX readings are perhaps the most telling; a sustained move requires a trend strength above 25. Until the ADX picks up, expect volatility to remain a key feature, with price likely to oscillate between established support and resistance levels.
The weak trend environment means that breakout strategies might be riskier, and range-trading strategies could be more appropriate, albeit with tight stops. The immediate $1.15203 support and $1.15605 resistance on the daily chart are likely to act as boundaries in the short to medium term. A break outside this range, confirmed by a rising ADX, would signal the start of a more sustainable move. Until then, focusing on risk management and waiting for clearer signals will be paramount. The tension between the 1-hour bullish signals and the daily bearish signals creates a 'watch zone' rather than a high-conviction trade setup. Traders should be prepared for whipsaws and false breakouts.
The Week Ahead: Key Events and Levels to Watch
As we look towards the coming trading week, several key economic events and technical levels will dictate the direction of EURUSD. The market’s current indecision means that upcoming data releases will carry significant weight. On the Eurozone front, investors will be closely monitoring any high-impact economic data. While specific high-impact events for the Euro were not detailed in the provided economic calendar for the immediate next few days, any releases related to inflation, GDP, or central bank commentary from the ECB will be crucial. Any sign of accelerating inflation in the Eurozone could prompt the ECB to maintain a hawkish tone, supporting the Euro. Conversely, weaker economic data could fuel speculation of a more dovish policy, weighing on the pair.
For the US Dollar, the economic calendar will be equally, if not more, important. While specific high-impact USD events for the upcoming week weren't explicitly listed beyond a general mention of central bank decisions and inflation data, any news regarding the Federal Reserve's monetary policy stance will be paramount. Traders will be dissecting any commentary for clues on future interest rate movements. Stronger-than-expected US inflation or employment data could bolster the dollar by reinforcing expectations of a tighter monetary policy, while softer data could have the opposite effect. The recent news flow regarding potential de-escalation in the Middle East has already put some pressure on the dollar, but any renewed geopolitical tensions could quickly reverse this trend and boost safe-haven demand for the USD.
Technically, the levels identified on the daily chart remain the most significant. The immediate support at $1.15203 is the first line of defense for the bulls. A decisive break below this level, especially with increasing ADX, would signal a bearish continuation towards $1.15061 and $1.14801. On the upside, the resistance at $1.15605 is the immediate hurdle. A sustained break above this level, coupled with a weakening DXY and positive catalysts, could open the door for a move towards $1.15865 and the psychological $1.16000 mark. The broader 4-hour resistance levels at $1.15811, $1.15996, and $1.16104 also come into play if the bulls gain significant traction. Given the current weak trend signals (ADX
Bull vs Bear Debate: The Verdict
The EURUSD pair is currently locked in a tight range, with the $1.15669 level acting as a pivotal point. The technical indicators offer a mixed bag of signals, reflecting the market's indecision. The daily chart presents a predominantly bearish outlook, with RSI below 50 and price trading below the middle Bollinger Band, supported by a strong downtrend signal (ADX 19.51). However, shorter timeframes, particularly the 1-hour chart, show some bullish momentum with positive Stochastic crossovers and RSI in neutral territory, albeit with a weak ADX reading of 17.43. This divergence suggests that while the longer-term trend is down, there's potential for short-term bounces.
The fundamental backdrop adds another layer of complexity. Any signs of sustained dollar weakness, potentially driven by a Fed that signals a pause in rate hikes or a de-escalation of geopolitical tensions, could favor the bulls. Conversely, a resurgence of dollar strength due to persistent US inflation or hawkish Fed commentary would likely push EURUSD lower. The upcoming economic data releases will be crucial in shaping these narratives.
Given the current technical setup, characterized by weak trend strength (ADX consistently below 25) and conflicting signals across different timeframes, the most likely scenario in the immediate short term is continued range-bound trading. The probability of a significant breakout without a strong catalyst appears low. However, the daily chart's bearish bias cannot be ignored. Therefore, the 'WATCH_ZONE' recommendation is appropriate. A daily close above the critical resistance at $1.15605, coupled with a strengthening DXY narrative reversal or a dovish Fed surprise, would be needed to signal a more sustainable bullish move. Conversely, a decisive break below the support at $1.15203, especially with an uptick in the ADX, would confirm the bearish outlook and open the door for further declines.
For now, patience is key. Traders should watch for a clear break of either the $1.15203 support or the $1.15605 resistance, ideally accompanied by an increase in trend strength (ADX rising above 25). Until then, managing risk diligently and avoiding premature entries in this choppy market is the most prudent approach. The battle at $1.15669 is far from over, and the coming week could provide the clarity needed for the next significant move.
Bearish Scenario: Testing Lower Support
65% ProbabilityBullish Scenario: A Cautious Rally
20% ProbabilityNeutral Scenario: Range-Bound Consolidation
15% ProbabilityFrequently Asked Questions: EURUSD Analysis
What happens if EURUSD breaks below the $1.15203 support level?
A decisive daily close below $1.15203 would confirm the bearish bias indicated by the daily chart's technicals. This could trigger a move towards the next support levels at $1.15061 and potentially $1.14801, especially if accompanied by an increase in trend strength (ADX rising).
Should I consider buying EURUSD if it holds $1.15203, given the current mixed signals?
Buying at $1.15203 would be a tactical play, with a high probability of success only if it holds firmly and shows signs of a bullish reversal, such as a daily close above $1.15605. Given the overall weak trend and mixed signals, entering on support requires tight risk management and confirmation from other indicators.
Is the RSI at 44.03 on the daily chart a strong sell signal for EURUSD?
An RSI of 44.03 on the daily chart indicates a bearish leaning but is not yet in oversold territory, suggesting room for further downside. While it supports the bearish case, it's not a standalone sell signal and should be considered alongside other technicals like MACD and price action.
How will upcoming US inflation data impact EURUSD this week?
Higher-than-expected US inflation would likely strengthen the dollar, pressuring EURUSD lower as it could reinforce hawkish Fed expectations. Conversely, softer inflation could weaken the dollar, offering a potential tailwind for EURUSD to challenge resistance levels.
Technical Outlook Summary
| Indicator | Value | Signal | Interpretation |
|---|---|---|---|
| RSI (14) | 44.03 | Bearish | Room for downside, not oversold. |
| MACD Histogram | -0.003 (approx) | Bearish | Negative momentum on daily. |
| Stochastic | K=29.85, D=20.01 | Bullish | Bullish crossover, potential bottoming. |
| ADX | 19.51 | Neutral | Weak trend, choppy market. |
| Bollinger Bands | Below Middle Band | Bearish | Indicates bearish pressure. |
Key Levels
The market currently presents a 'WATCH_ZONE' scenario for EURUSD. The lack of a strong trend, evidenced by low ADX readings across timeframes, suggests that significant directional moves are unlikely without a catalyst. While the daily chart holds a bearish bias, short-term charts offer some bullish signals, creating a tug-of-war. The key will be how EURUSD reacts to the $1.15203 support and $1.15605 resistance levels in the coming week. A decisive break, confirmed by an increasing ADX, will be necessary to signal a high-probability trade setup. Until then, patience and disciplined risk management are paramount. Remember, volatility creates opportunity – those prepared will be rewarded, and patient traders will find their setups.
Track markets in real-time
AI-powered analysis, technical indicators and real-time price data.
Join Our Telegram Channel
Breaking market news, AI analysis and trading signals instantly.
Join Channel