Having spent much of the past week hovering around the $1.3400 handle, the GBPUSD pair now faces a critical juncture as traders brace for the upcoming UK Producer Price Index (PPI) data. Last Friday's close saw the pair at $1.34024, a level that encapsulates the current indecision in the market. While some technical indicators hint at potential upside, the overarching trend on the daily chart and the lingering threat of geopolitical instability demand caution. This analysis delves into the technical landscape, the potential impact of the PPI data, and what lies ahead for Sterling.
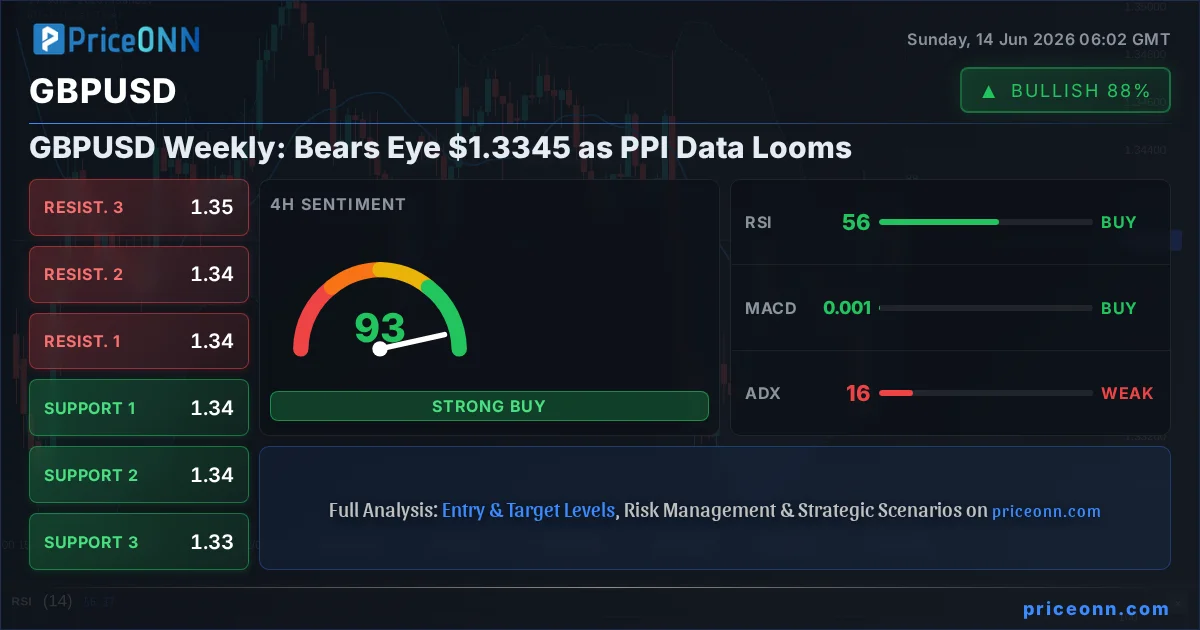
- GBPUSD is trading at $1.34024, with key support at $1.3345 and resistance at $1.3405.
- The daily chart shows a bearish trend (ADX 14.88), despite 1-hour and 4-hour signals suggesting potential upside.
- UK PPI data release is a significant event, with potential to trigger a move towards the $1.3345 support level if inflation proves sticky.
- DXY is at 99.78, showing a strong upward trend on the daily chart, which typically pressures GBPUSD.
The past week was a tale of two halves for Sterling. Early in the week, influenced by strong consumer spending data, GBPUSD saw attempts to recover, pushing towards the upper end of its recent trading range. However, as the week drew to a close, a more cautious sentiment prevailed. The market appears to be digesting the implications of a relatively mixed economic picture and the persistent strength in the US Dollar Index (DXY), which, despite a slight pullback on Friday to 99.78, maintains a strong daily upward trend. This tug-of-war between short-term bullish signals and longer-term bearish pressures is precisely why the $1.3400 level has become such a focal point.
From a technical standpoint, the GBPUSD's daily chart paints a somewhat bearish picture, despite the mixed signals across shorter timeframes. The Average Directional Index (ADX) at 14.88 on the daily chart indicates a weak trend, suggesting that the market is currently in a choppy, range-bound phase rather than a strong directional move. However, the overall trend is still classified as 'Düşüş' (Bearish) with 87% strength. This means that while short-term bounces are possible, the path of least resistance on a larger scale may still be downwards. The RSI(14) on the daily sits at 48.4, comfortably in neutral territory but leaning towards a decline, reflecting a lack of strong buying conviction. Similarly, the MACD is showing negative momentum, with the MACD line below its signal line, reinforcing the bearish sentiment. The Stochastic Oscillator, with K=45.65 and D=31.71, shows a bullish crossover, but it's still in the lower half of its range, suggesting any upside momentum might be limited.
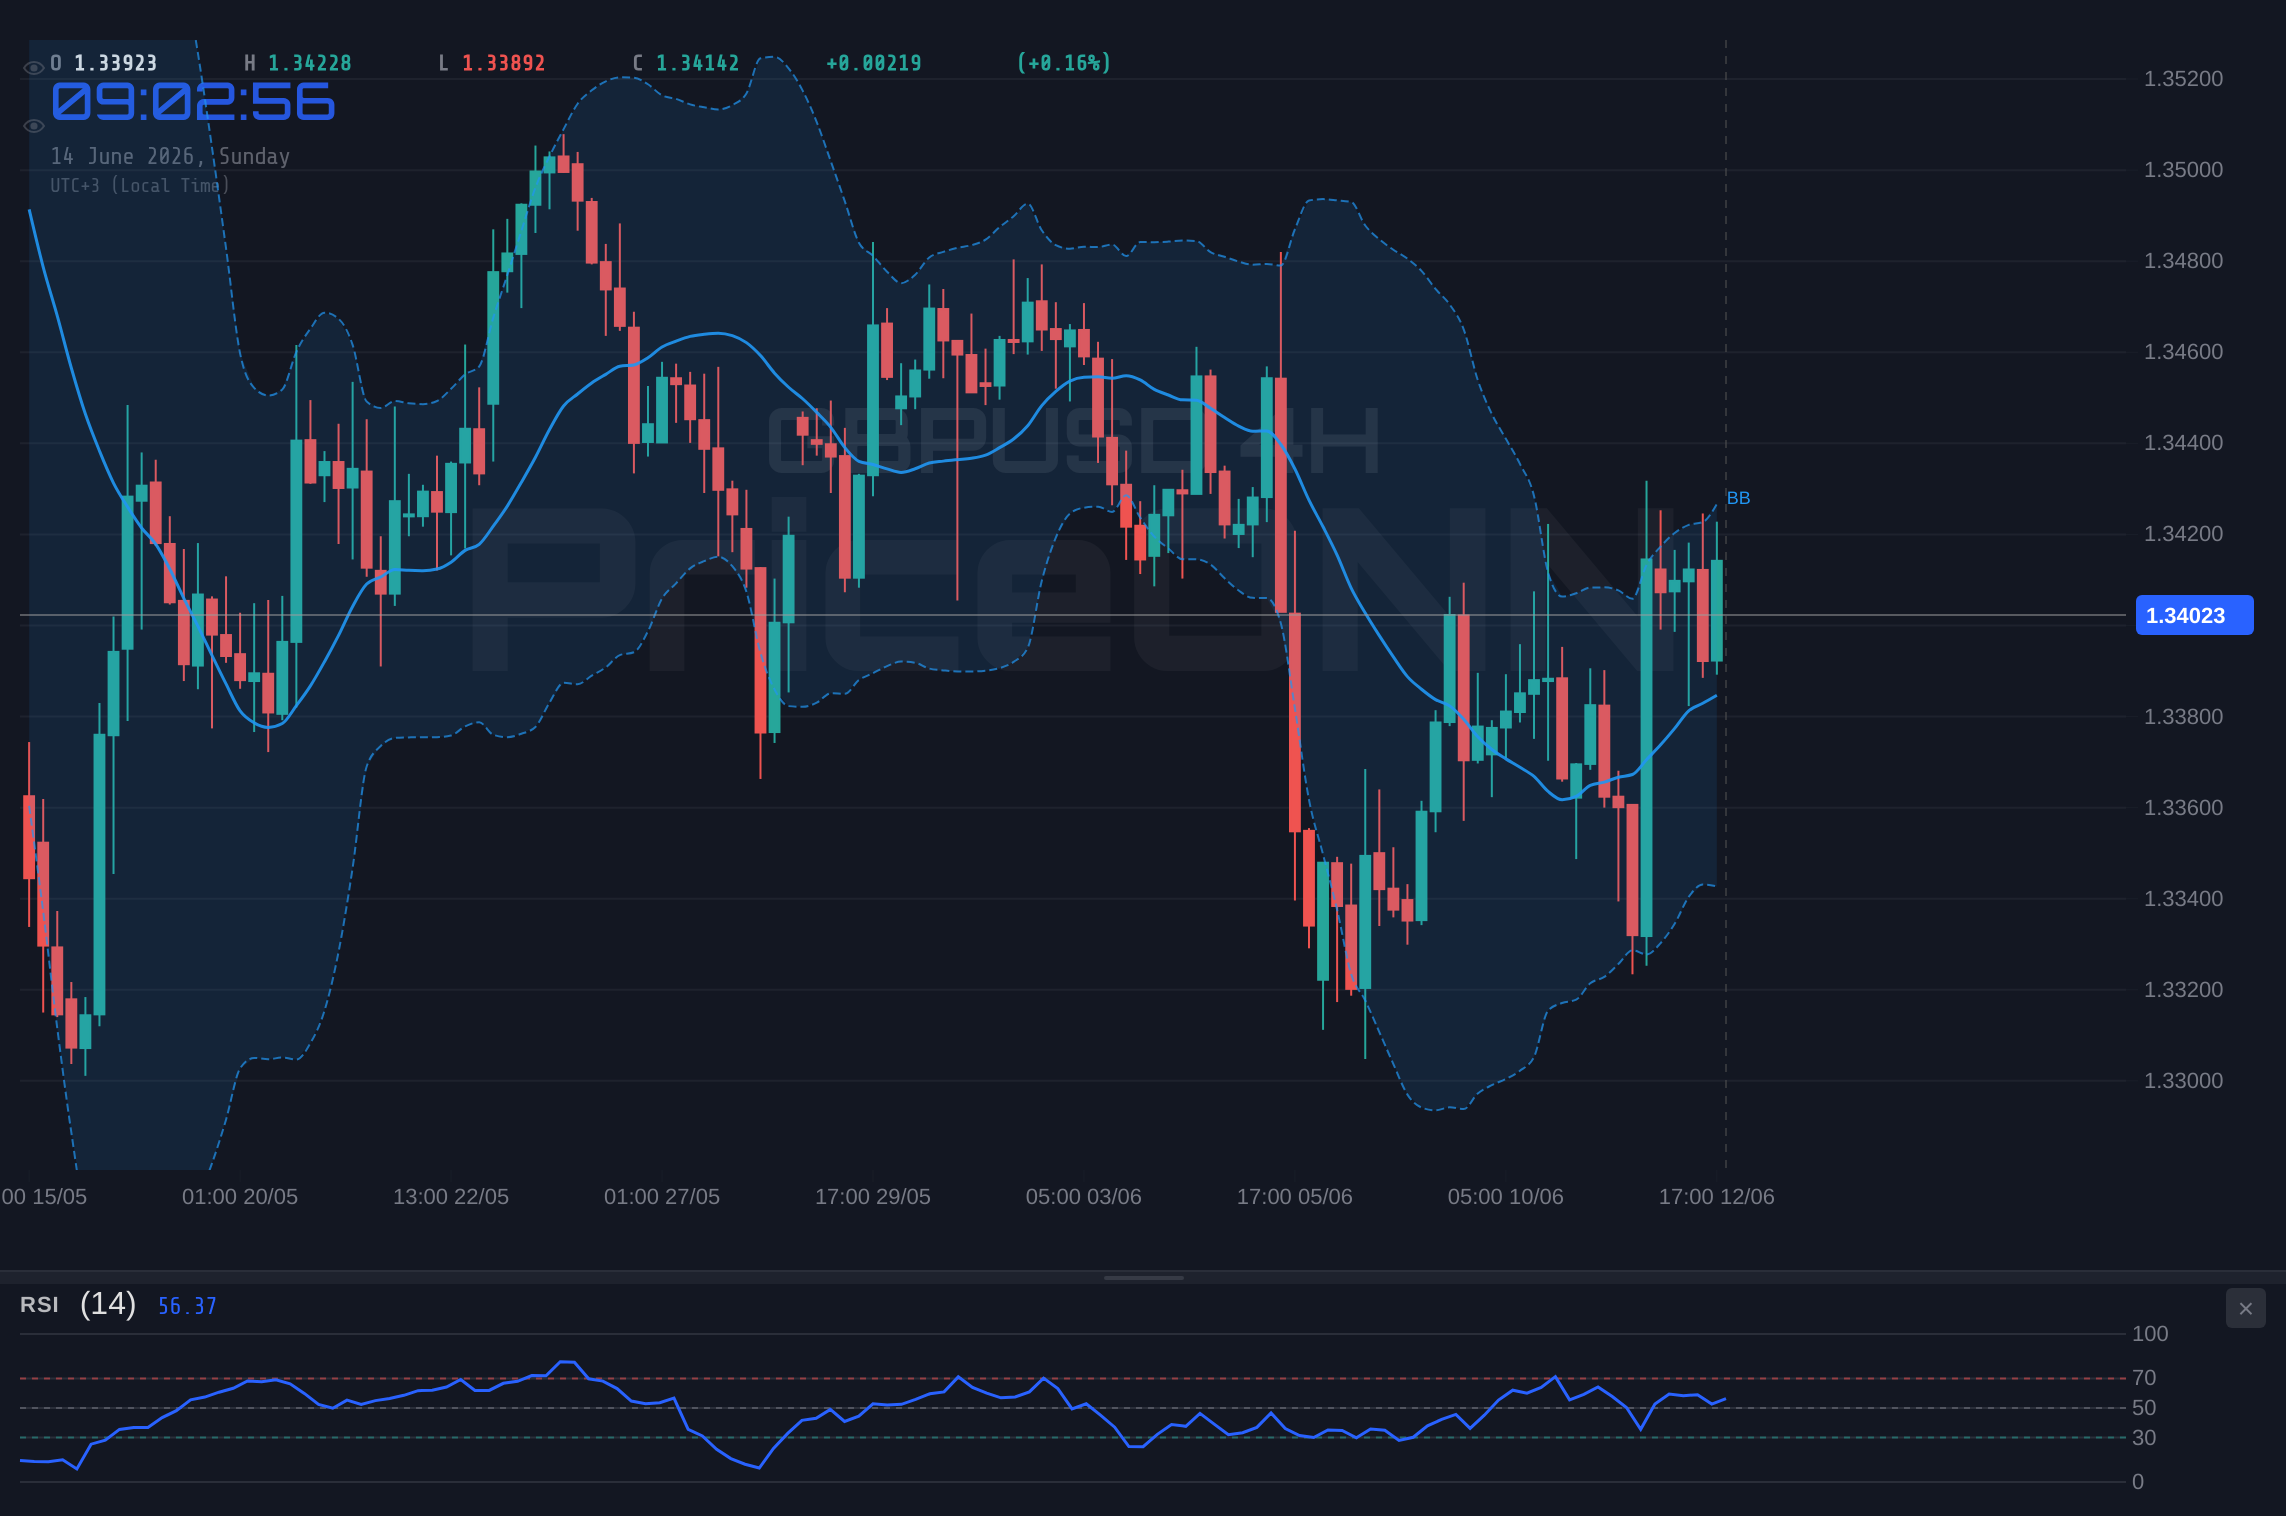
Zooming into the 4-hour timeframe, the picture becomes slightly more constructive, though still cautious. Here, the trend is also classified as 'Düşüş' (Bearish) with 83% strength, but the ADX at 16.44 still points to a weaker trend. The RSI(14) is at 56.28, indicating a more neutral stance with a slight upward bias. The MACD histogram is positive, suggesting some short-term buying pressure is present. The Stochastic Oscillator is in a more encouraging position, with K=76.41 and D=67.92, indicating a potential continuation of the upward move from oversold conditions. However, this is juxtaposed against the daily chart's bearish outlook, highlighting the need for confirmation before committing to a bullish stance. The current price of $1.34024 is hovering just above the 4-hour support level of $1.33789, making this a crucial area to watch.
The 1-hour chart offers a more immediate perspective, and here, the signals lean slightly more towards a potential short-term upside. The trend is classified as 'Nötr' (Neutral) with 50% strength, and the ADX at 10.91 signifies a very weak trend, indicating high choppiness. The RSI(14) is at 53.8, suggesting a neutral position with a slight upward tendency. The MACD histogram, however, is showing negative momentum. The Stochastic Oscillator, with K=70.9 and D=65.66, provides a bullish signal, with the %K line crossing above the %D line, suggesting potential for a bounce. The price is currently trading above the 1-hour support at $1.34008 and flirting with resistance at $1.34194. This intraday view suggests that any immediate move could be upwards, but the broader daily trend remains a significant headwind.
The upcoming UK PPI data is poised to be a major catalyst for GBPUSD. Producer Price Index figures are crucial as they can provide an early indication of inflationary pressures within the economy. If the PPI data comes in higher than expected, it could signal that consumer inflation might also remain elevated, potentially prompting the Bank of England to maintain a hawkish stance or even consider further tightening. This would likely boost Sterling, as higher interest rates generally make a currency more attractive to investors. Conversely, if the PPI figures are weaker than anticipated, it could suggest easing inflationary pressures, leading to speculation that the BoE might pivot towards a more dovish policy sooner rather than later. This would put downward pressure on GBPUSD, especially if the US Federal Reserve continues to signal a data-dependent approach with a bias towards maintaining higher rates for longer.
The market's reaction to the PPI data will also depend heavily on how it aligns with or diverges from other recent economic indicators. For instance, last week's consumer spending data offered a glimmer of hope, suggesting resilience in the UK economy. However, this was tempered by broader concerns about the economic outlook and the persistent strength of the US dollar. Traders will be scrutinizing the PPI release for any signs of persistent inflation that could force the Bank of England's hand, or conversely, signs of cooling that might open the door for rate cuts later in the year. The current price action around $1.3400 reflects this uncertainty. A decisive break above the 1-hour resistance at $1.34194, confirmed by strong volume and positive follow-through, could signal a short-term bullish move. However, a failure to hold above this level, or a sharp move downwards, could see the pair testing the more significant daily support levels, starting with $1.3345.
Considering the current technical setup and the upcoming economic data, the sentiment leans towards a cautious outlook for GBPUSD. The daily bearish trend, coupled with the strong upward trend in the DXY (currently at 99.78), suggests that any rallies might be met with selling pressure. The key level to watch remains $1.3345. A daily close below this support level would significantly increase the probability of a further decline, potentially targeting the next support at $1.33237. On the other hand, for the bulls to regain control, they would need to see a decisive break and hold above the resistance cluster around $1.3415-$1.34379, with the 4-hour chart showing sustained upside momentum and the daily trend shifting towards neutral or bullish. Until then, expect choppy trading as the market awaits clearer directional signals.
The interplay between global risk sentiment and currency markets cannot be overstated. While the past week saw some optimism regarding geopolitical de-escalation in the Middle East, which initially weighed on safe-haven assets like the US dollar, this sentiment appears to be waning. The continued strength of the DXY, driven by the Federal Reserve's hawkish undertones and the market's pricing of potential future rate hikes, provides a solid floor for the dollar. This persistent dollar strength acts as a significant headwind for pairs like GBPUSD. If the upcoming UK PPI data were to surprise to the downside, suggesting a cooling inflation environment, it could exacerbate the downward pressure on Sterling, especially if it leads to expectations of earlier BoE rate cuts compared to the Fed.
Looking at the broader commodity complex, oil prices have experienced a significant downturn, with Brent crude falling to $88.54 and WTI to $84.75. This decline, partly attributed to optimism surrounding de-escalation in the Middle East and concerns about global demand, could have a dual impact. Lower energy prices might ease inflationary pressures globally, which could be a positive for central banks aiming to control inflation without stifling growth. However, it also signals potential weakness in global economic activity. For GBPUSD, the direct impact is less pronounced, but the indirect effect through global risk sentiment and its influence on the DXY is noteworthy. A sustained drop in oil prices could contribute to a 'risk-off' environment, further bolstering the US dollar and potentially weighing on Sterling.
The technical indicators on the 1-day chart present a conflicting picture, demanding careful interpretation. While the Stochastic Oscillator is showing a bullish crossover (K=45.65, D=31.71), indicating a potential bounce from oversold territory, this is overshadowed by the bearish MACD momentum and the RSI(14) at 48.4, which suggests a lack of conviction. The weak ADX reading of 14.88 further complicates the outlook, pointing to a lack of a clear trend. This divergence highlights the importance of upcoming fundamental data. A strong PPI reading could invalidate the oversold Stochastic signal and push GBPUSD towards its next resistance level at $1.3405, while a weak reading could see the pair accelerate towards the $1.3345 support, aligning with the daily bearish trend.
The decision to classify GBPUSD as a 'WATCH_ZONE' reflects this current market condition. The ADX at 16.44 on the 4-hour chart clearly indicates choppy, ranging market conditions, making aggressive trading strategies risky. While the RSI and MACD histogram on the 4-hour chart show some alignment for potential upside, the Stochastic is in a tradeable zone, not yet extreme. This suggests that while a short-term bounce is possible, the overall trend on the daily chart remains a significant concern. A valid trading setup would likely require a clearer directional signal, such as a confirmed break above the $1.34379 resistance on the 4-hour chart, accompanied by increasing volume and a shift in daily indicators, or a decisive break below the $1.3345 support, confirming the bearish bias.
The current technical condition for GBPUSD necessitates patience. A daily close above the resistance level at $1.3405 would be the first sign of bulls regaining control, potentially opening the door for a test of higher levels around $1.34379. However, this scenario hinges on the upcoming PPI data surprising to the downside or a significant shift in global risk sentiment. Conversely, a daily close below the support at $1.3345 would signal a bearish continuation, with potential downside targets at $1.33237 and lower. Until one of these levels is decisively breached with conviction, the pair is likely to remain range-bound, offering limited opportunities for clear directional trades.
The outlook for GBPUSD remains highly data-dependent, with the upcoming UK PPI figures serving as the immediate focal point. While shorter-term technical indicators offer glimpses of potential upside, the prevailing daily trend and the robust US dollar present significant hurdles. Traders should remain vigilant, monitor the key levels of $1.3345 and $1.3405 closely, and await confirmation from economic data before committing to any significant positions. The market is currently in a delicate balance, and the PPI release has the potential to tip the scales decisively.
Bearish Scenario: Bears Target $1.3345
65% ProbabilityNeutral Scenario: Range-Bound Consolidation
25% ProbabilityBullish Scenario: Bulls Eye Resistance Break
10% ProbabilityFrequently Asked Questions: GBPUSD Analysis
What happens if GBPUSD breaks below the $1.3345 support level after the PPI data?
A break below $1.3345, especially on the daily chart, would confirm the bearish trend and likely trigger further selling pressure. The next key downside target would be $1.33237, with the potential for a move towards $1.3285 if momentum sustains.
Is the RSI at 48.4 a sell signal for GBPUSD right now?
An RSI of 48.4 on the daily chart is considered neutral territory, leaning slightly bearish. It's not a direct sell signal on its own but indicates a lack of strong buying momentum. A confirmed bearish move would require other indicators, like the MACD, to align with this sentiment.
How will the UK PPI data affect GBPUSD this week?
Higher-than-expected PPI could boost Sterling by reinforcing hawkish BoE expectations, potentially pushing GBPUSD towards $1.34379. Conversely, weaker data might signal easing inflation, leading to pair's decline towards $1.3345.
Should I consider trading GBPUSD if it breaks above $1.34379 resistance?
A decisive break and daily close above $1.34379, especially with increasing volume and supportive daily indicators, could signal a bullish reversal. However, given the current daily bearish trend, this scenario carries only a 10% probability and requires careful risk management.
Track markets in real-time
AI-powered analysis, technical indicators and real-time price data.
Join Our Telegram Channel
Breaking market news, AI analysis and trading signals instantly.
Join Channel