The Japanese Yen's battle against the greenback continues, with USDJPY currently hovering around the critical $160.19 mark. Last Friday's close saw the pair find a footing after a week of intense price action, leaving traders and analysts alike scrutinizing the charts for the next significant move. This pivotal level, a long-watched intervention zone, held firm, but the underlying technical signals and the looming economic calendar suggest that this equilibrium might be temporary. Understanding the interplay between Japanese Ministry of Finance (MoF) intervention threats, Bank of Japan (BoJ) policy expectations, and US Dollar strength driven by Federal Reserve sentiment is paramount as we step into another week of potential volatility.
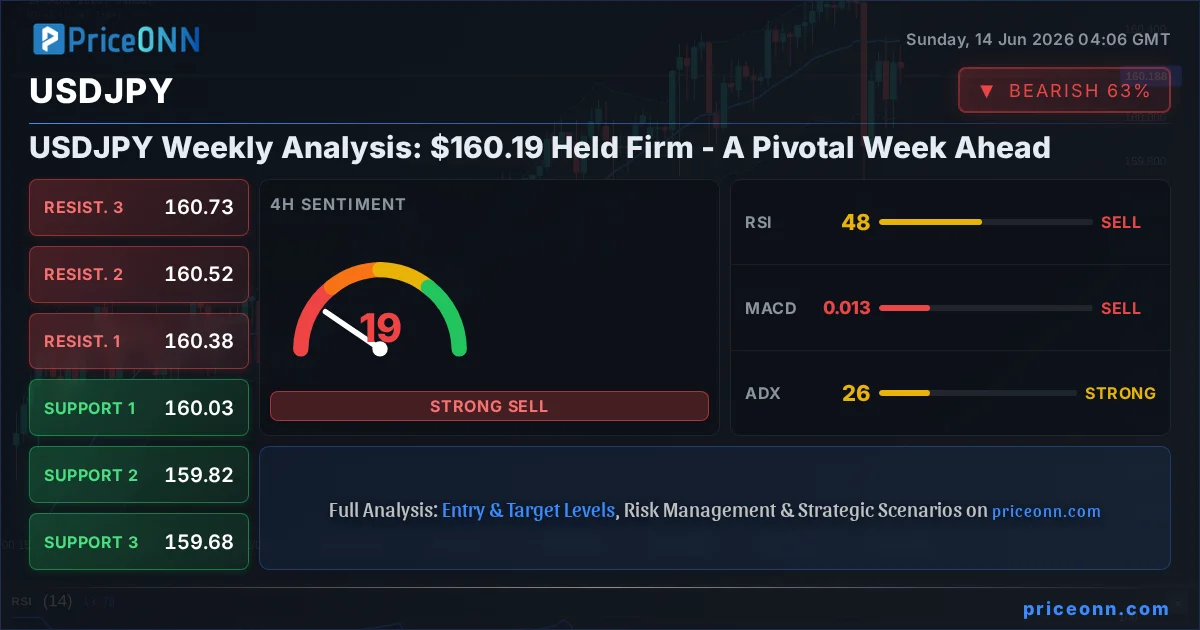
- RSI at 48 on the daily chart indicates a neutral stance, but with a slight bearish leaning, suggesting caution.
- The critical support level at $160.11, tested multiple times last week, remains the line in the sand for bulls.
- MACD histogram shows negative momentum on the daily chart, indicating underlying selling pressure that could intensify.
- The correlation with the DXY, currently at 99.78, is a key driver; any significant move in the dollar index will likely impact USDJPY.
The past week was a testament to the market's sensitivity around the $160.00 psychological barrier and the perceived intervention levels. We witnessed sharp intraday swings, a common characteristic when such key price points are being defended or tested. The daily chart for USDJPY paints a picture of consolidation after a period of significant upward momentum. While the overall trend on the daily timeframe is still technically considered bullish with a power of 97%, the recent price action suggests a pause, a market breathing room before the next directional impulse. The question on everyone's mind is whether the support at $160.11 will hold, paving the way for a retest of higher resistance levels, or if the bearish undertones will prevail, leading to a more significant pullback.
Looking at the broader context, the US Dollar Index (DXY) has been a dominant force, currently trading around 99.78. Its upward trajectory has been a significant factor in USDJPY's ascent. However, recent news suggesting potential de-escalation in the Middle East sent the DXY tumbling, a development that, if sustained, could offer some respite to the Japanese Yen. The market is also keenly awaiting any hints from the Federal Reserve regarding future monetary policy. Sticky inflation remains a concern, and while the Fed might be on hold for now, any hawkish undertones could reignite dollar strength. This dynamic is crucial for USDJPY, as the interest rate differential is a primary driver of its valuation.
The Yen's Underpinning: Intervention Fears and BoJ Policy
The Bank of Japan (BoJ) remains in a delicate balancing act. While inflation has shown signs of picking up, it's still below the BoJ's target, and the overall economic picture is mixed. The BoJ has been hesitant to aggressively tighten monetary policy, fearing it could stifle economic growth. This dovish stance, contrasted with the more hawkish approach of the Federal Reserve, has been a significant contributor to the Yen's weakness. However, the sharp depreciation of the Yen has also raised concerns about imported inflation and its impact on the Japanese economy. The threat of direct intervention by Japanese authorities, should the Yen weaken past certain thresholds, acts as a constant background support, preventing a complete freefall.
Last week, market participants were dissecting every piece of data and every official statement for clues about the BoJ's next move. While the central bank has signaled a potential shift away from negative interest rates, the timing and pace remain uncertain. This uncertainty itself can create volatility. If the BoJ were to signal a more aggressive tightening path, it could provide a much-needed boost to the Yen, potentially leading to a sharper correction in USDJPY. Conversely, any indication of continued accommodation would likely see the Yen remain under pressure, especially if the Fed maintains a hawkish bias. The historical data shows that such policy divergences are potent catalysts for currency pair movements.
The fear of intervention is perhaps the most immediate 'support' for the Yen. While the exact levels at which authorities might step in are never explicitly stated, market participants closely watch psychological barriers and historical highs. The $160.00 level has been a significant psychological magnet, and the price action around it suggests that both traders and authorities are keenly aware of its importance. Any sustained move above this level, especially with increasing momentum, could trigger verbal warnings or even direct market intervention, which typically involves selling dollars and buying Yen. This intervention risk acts as a ceiling, capping upside potential for USDJPY, even when fundamental drivers appear bullish.
Technical Landscape: A Multi-Timeframe Perspective
Delving into the technicals, the picture for USDJPY is nuanced, requiring a look across multiple timeframes. On the 1-hour chart, the trend is currently neutral with a power of 50%, reflecting the choppy, range-bound action seen intraday. The RSI(14) is at 47.43, hovering in the neutral zone but showing a slight downward tendency, aligning with the negative MACD histogram which suggests momentum is currently favoring sellers. Stochastic, with K=58.89 and D=68.27, also hints at a potential dip, as %K is below %D. The ADX at 18.88 confirms the lack of a strong directional trend in this very short-term view, indicating that intraday trading might be more about navigating short-term fluctuations than capturing a sustained move.
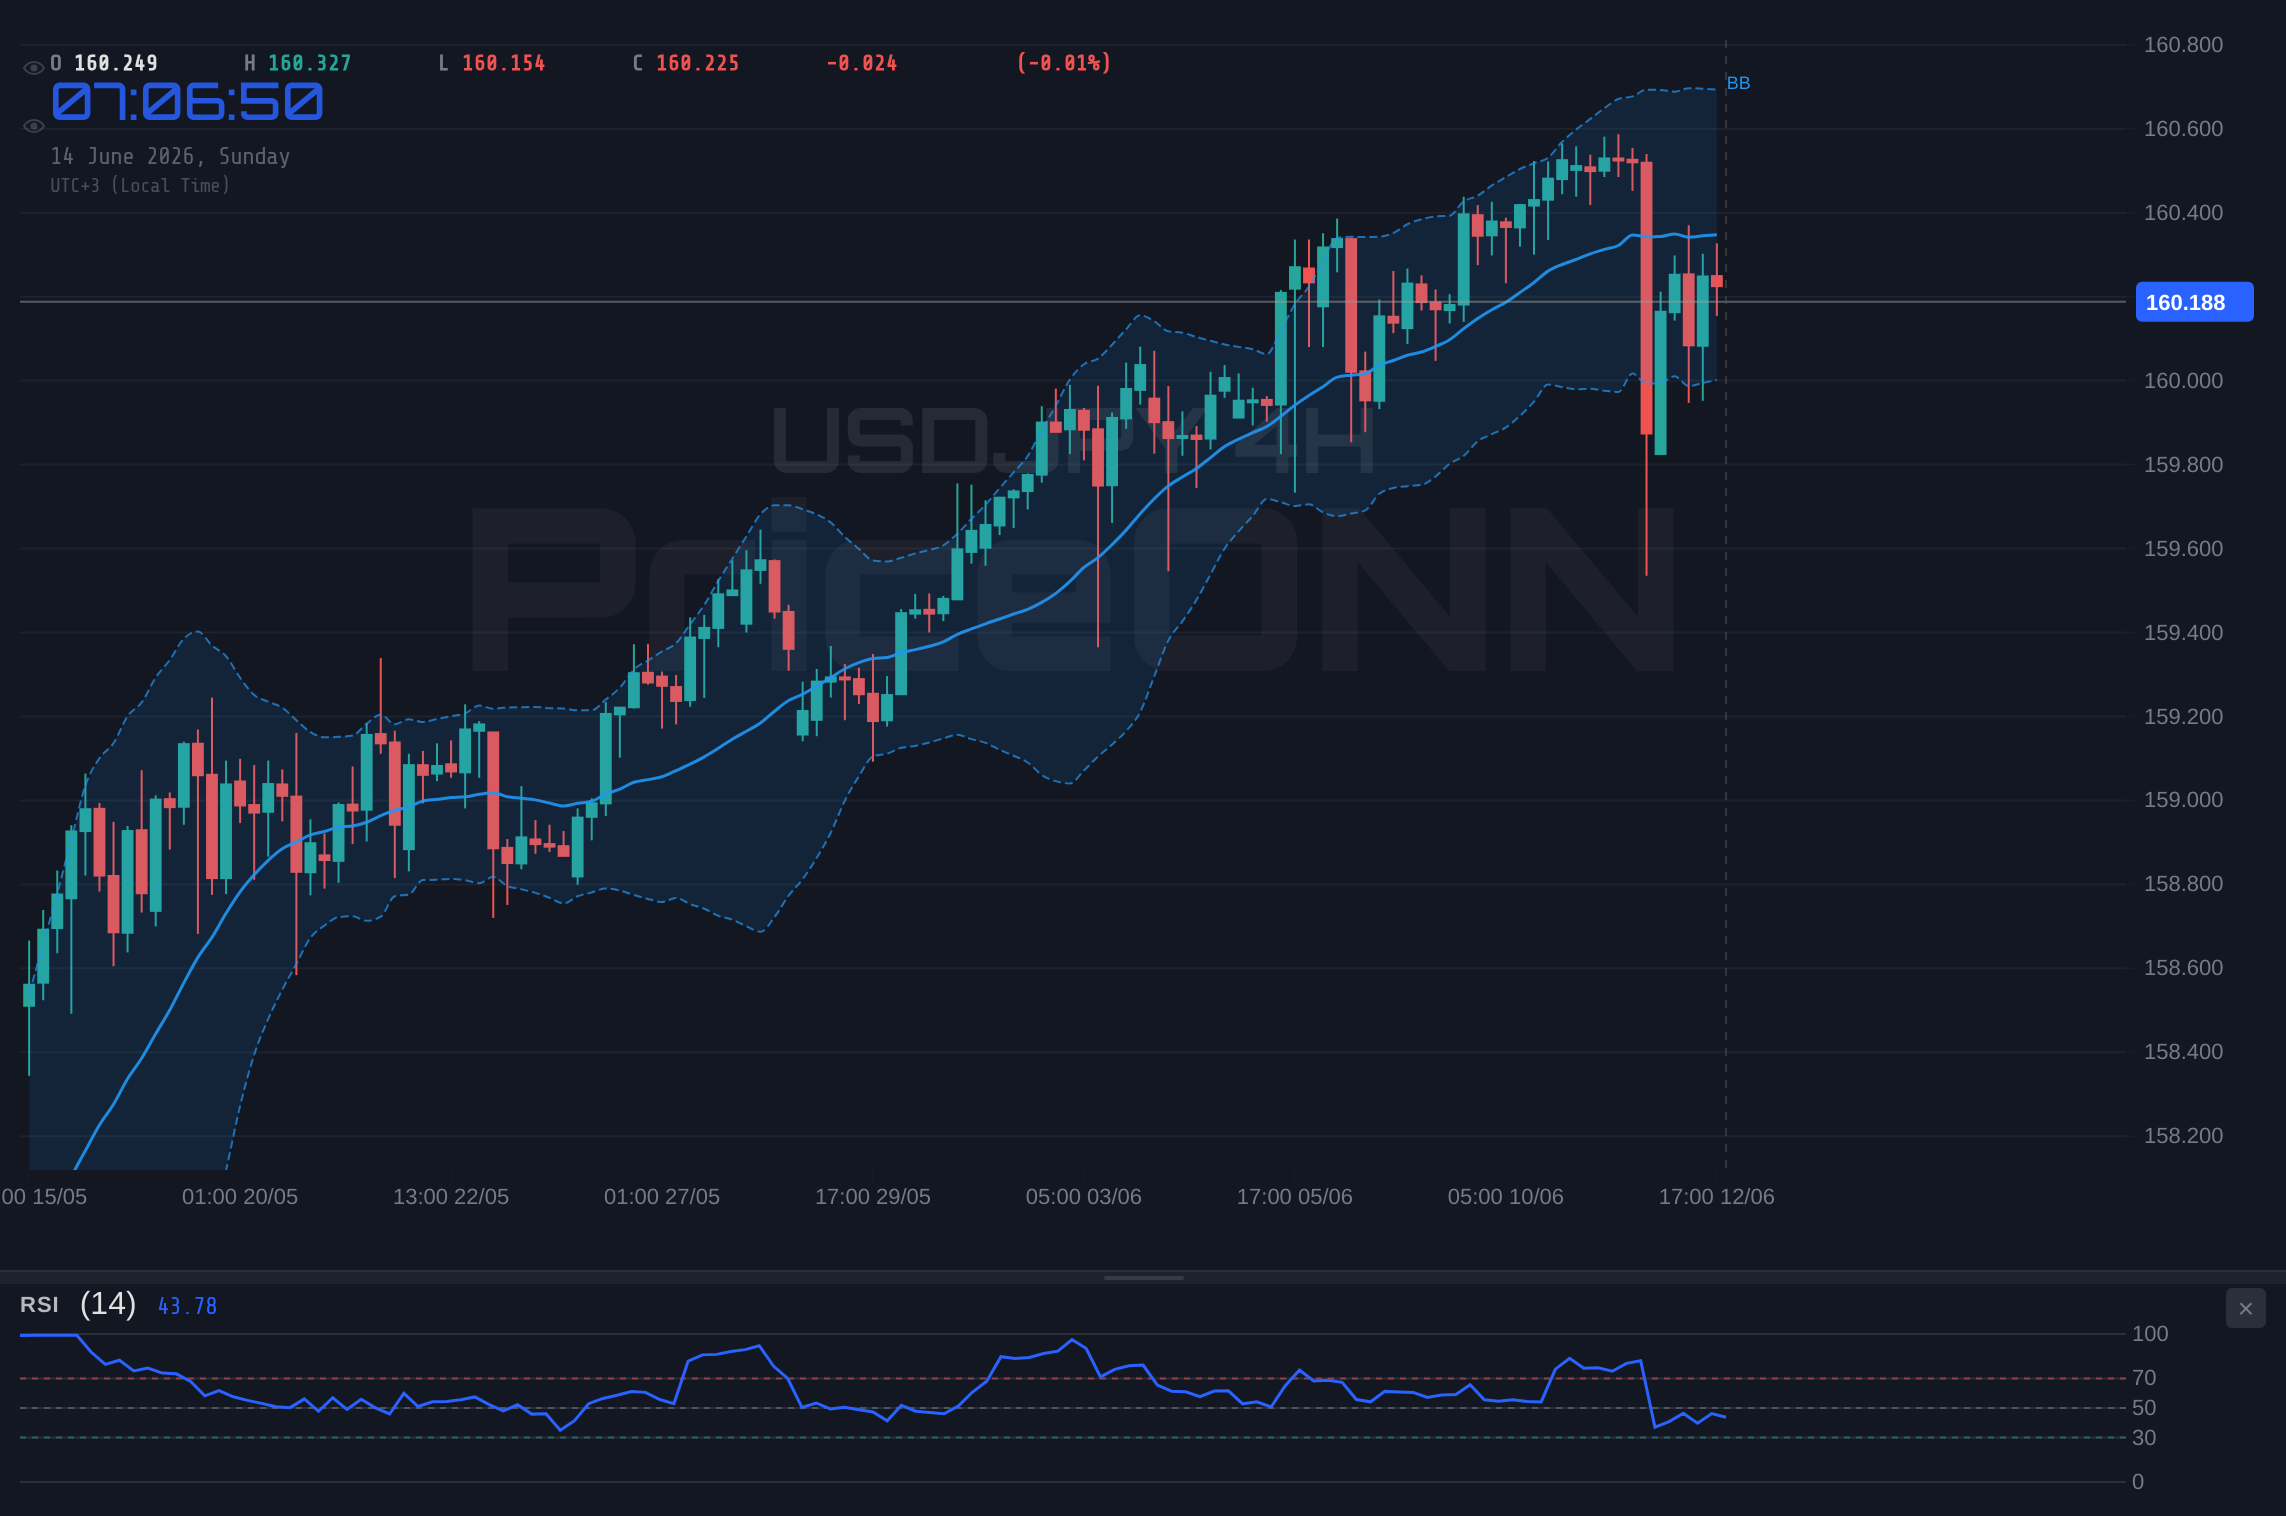
However, stepping back to the 4-hour timeframe reveals a different story. Here, the trend is classified as bullish with a power of 88%, despite the RSI sitting at 48, again in neutral territory but with an upward bias. The MACD is positive, and Stochastic shows a strong bullish signal (K=60.73, D=59.48). This divergence between the shorter-term neutral/bearish leanings and the medium-term bullish trend suggests that the current consolidation might be a pause before a potential resumption of the uptrend. The ADX at 25.98 indicates a strong trend, which, when combined with the bullish signals on the 4-hour chart, suggests that the underlying strength might still be present, waiting for the right catalyst to re-emerge.
The daily chart, however, provides the most significant context for the week ahead. The trend is definitively bullish, with a power of 97%, yet the RSI(14) is at 60.5, in the upper neutral zone, and Stochastic (K=86.86, D=90.86) is in overbought territory. The MACD histogram is positive but showing signs of slowing momentum. The ADX at 14.97 indicates a weak trend, which, when viewed alongside the strong daily bullish signal (Al: 6, Sat: 1, Nötr: 0), creates a scenario of potential upward bias but with caution. The confluence of these indicators suggests that while the long-term direction might still be up, the market is showing signs of fatigue at these elevated levels. The key support at $160.11 becomes even more critical in this context; a break below it could invalidate the bullish thesis on the daily chart, at least in the short to medium term.
Key Levels: The Battleground for USDJPY
The support and resistance levels provided are crucial for understanding potential price action. On the daily chart, the immediate support lies at $160.316, followed by $160.108 and then $159.983. These levels have been and will continue to be areas of intense focus. The price currently sits above these, but the proximity and the number of tests suggest their significance. A break below $160.108, for instance, would likely trigger further selling pressure, potentially targeting the next support cluster.
On the resistance side, we have immediate hurdles at $160.649, $160.774, and $160.982. These are the levels bulls need to break and hold to regain stronger control and signal a potential move towards higher psychological targets. The fact that the Stochastic is in overbought territory on the daily chart suggests that pushing through these resistance levels might be challenging without fresh impetus. The ADX reading of 14.97 also reinforces the idea that any breakout might lack strong follow-through initially, making the confirmation of a sustained move above resistance critical.
Navigating the Scenarios: What Could Happen Next?
Given the current technical setup and the surrounding market dynamics, we can outline three primary scenarios for USDJPY in the coming week. Each scenario hinges on specific price action triggers and the broader macroeconomic narrative. The interplay between the Fed's stance, BoJ's policy, and potential intervention threats will be the backdrop against which these technical scenarios unfold.
The Bear's Grip: Yen Strength Resurfaces
25% ProbabilityThe Waiting Game: Consolidation Continues
40% ProbabilityBullish Continuation: Breaking the Ceiling
35% ProbabilityThe most likely scenario, in my view, leans towards continued consolidation with a potential for a bullish continuation, given the strong daily trend despite the overbought signals. The probability is assigned at 35% for the bullish scenario, 40% for neutral consolidation, and 25% for a bearish breakdown. This is primarily due to the underlying bullish trend on the daily chart and the historical tendency for such pairs to consolidate before resuming a trend, especially when intervention levels are in play. However, any significant shift in Fed policy expectations or a clear signal of BoJ tightening could rapidly alter this outlook. The market is currently pricing in a 7.5% probability of a Fed rate hike in September, according to CME FedWatch Tool, which is low but could change with upcoming inflation data.
The tension between the Fed's hawkish undertones and the BoJ's accommodative stance, coupled with the ever-present threat of intervention, creates a complex trading environment. Traders must remain agile, respecting the key levels and waiting for clear confirmation before committing to a direction. The recent news regarding potential de-escalation in the Middle East could also play a role, potentially weakening the dollar temporarily and offering a window for Yen strength, which would support the bearish scenario.
The upcoming week is packed with high-impact economic events, including key inflation data releases in the US and policy updates from various central banks. These events have the potential to trigger significant volatility in USDJPY, leading to rapid shifts in market sentiment and potentially invalidating technical setups. Extreme caution is advised, especially around major news releases.
The 1-hour chart shows immediate resistance at $160.243 and support at $160.196. Intraday traders will be watching these levels closely for potential scalps or early indications of the day's direction. The 4-hour chart, with its bullish trend signal, suggests that dips towards the $160.033 support could be buying opportunities if they hold. However, the daily chart's overbought Stochastic and neutral RSI (60.5) temper the bullish enthusiasm. The overall picture is one of a market at a critical juncture, where a clear catalyst is needed to break the current stalemate. The strength of the ADX at 14.97 on the daily chart suggests that any breakout might initially lack conviction, emphasizing the need for confirmation.
The correlation with the US Dollar Index (DXY) is a constant factor. With the DXY currently at 99.78, any significant move - up or down - will likely be mirrored, to some extent, in USDJPY. If the DXY breaks decisively above 100.00, it could provide the impetus for USDJPY to challenge higher resistance levels. Conversely, a fall in the DXY below 99.50 could see USDJPY retrace towards the $159.983 support. This relationship highlights the importance of monitoring not just USDJPY itself, but also its key drivers.
What's Next? Key Triggers to Watch
As we head into the new trading week, several factors will be crucial in determining the direction of USDJPY. Firstly, any further developments regarding the Middle East situation and their impact on global risk sentiment and the DXY will be closely watched. Secondly, upcoming economic data, particularly US inflation figures, will heavily influence Fed rate hike expectations and, consequently, the strength of the dollar. Thirdly, any verbal cues or policy shifts from the Bank of Japan could provide a significant boost or drag to the Yen.
From a technical standpoint, the immediate focus remains on the price action around the $160.11 support and the $160.77 resistance. A clear break and hold above either of these levels will likely dictate the short-to-medium term trajectory. Traders should also pay attention to volume indicators; a surge in volume accompanying a breakout would add significant conviction to the move. The ADX reading suggests that the market is not yet in a strong trend, making range-bound trading or waiting for clear confirmation the prudent approach for many.
What happens if USDJPY breaks below the $160.11 support level this week?
If USDJPY breaks decisively below the $160.11 support, it would invalidate the current bullish daily trend structure and likely trigger a move towards the next support at $159.98. This scenario would be reinforced if the DXY also weakens significantly, suggesting a broader dollar sell-off.
Should I consider buying USDJPY around the current $160.19 levels given the daily bullish trend?
Buying at current levels requires caution due to the daily overbought Stochastic and weak ADX trend strength. A more prudent approach would be to wait for a confirmed break above the $160.77 resistance, or for price to pull back to a more defined support like $160.11 and show signs of holding, indicating better risk-reward.
Is the RSI at 60.5 on the daily chart a concern for the bullish outlook?
An RSI of 60.5 is in the upper neutral zone, indicating upward momentum but not yet extreme overbought conditions that typically signal an immediate reversal. While it suggests bulls are gaining ground, it also means the market is getting extended, making further gains harder without consolidation or a pullback.
How will upcoming US inflation data affect USDJPY trading this week?
Higher-than-expected US inflation would likely bolster Fed rate hike expectations, strengthening the dollar and pushing USDJPY higher, potentially above $160.77. Conversely, softer inflation could lead to Fed policy easing bets, weakening the dollar and USDJPY, and testing the $160.11 support.
| Indicator | Value | Signal | Interpretation |
|---|---|---|---|
| RSI (14) | 60.5 | Neutral | Upper neutral zone, rising momentum |
| MACD Histogram | Positive | Bullish Momentum | Slowing momentum, watch for divergence |
| Stochastic | K:86.86, D:90.86 | Overbought | Potential for pullback or consolidation |
| ADX | 14.97 | Weak Trend | Breakouts may lack conviction |
| Bollinger Bands | Middle Band Breakout | Bullish Bias | Price above middle band suggests upside potential |
Key Levels
Track markets in real-time
AI-powered analysis, technical indicators and real-time price data.
Join Our Telegram Channel
Breaking market news, AI analysis and trading signals instantly.
Join Channel