The intricate dance between geopolitical tensions and central bank policy has once again placed gold at a critical juncture. As markets digest the implications of a seemingly de-escalating situation in the Middle East, the safe-haven appeal of XAUUSD is being tested. This delicate balance, currently positioning gold at $4,216.64, is further complicated by persistent uncertainty surrounding future Federal Reserve monetary policy. The coming week promises to be pivotal as traders assess whether the recent price action represents a temporary pause or the beginning of a more sustained shift in market sentiment. Understanding the interplay between these macro forces is crucial for navigating the immediate future of the gold market.
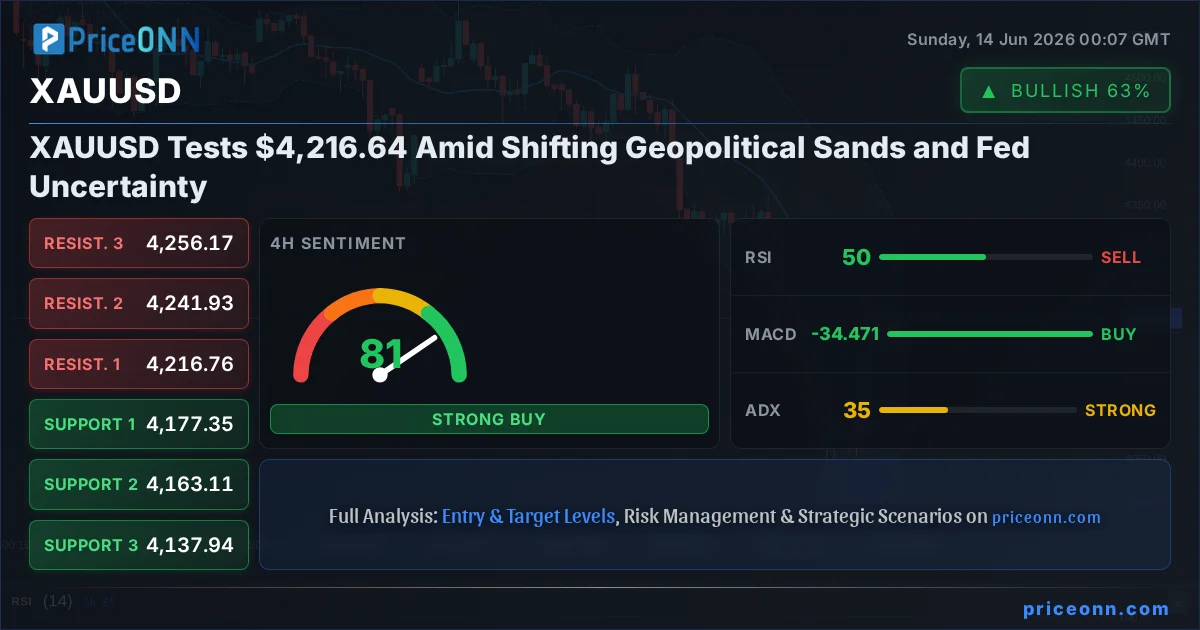
- With RSI at 59.29 on the 1H chart, gold shows a neutral but upward-leaning momentum, suggesting bulls are testing the waters.
- Critical support for XAUUSD is holding around $4,207.86, a level that has seen significant buying interest emerge this week.
- The MACD histogram on the 1H chart indicates negative momentum, but the daily chart shows a strong downtrend signal (ADX: 34.06), presenting a conflict that requires careful observation.
- The correlation with a strengthening US Dollar Index (DXY), currently at 99.78, poses a headwind, as a stronger dollar typically pressures gold prices.
Last week was a whirlwind for gold traders, marked by significant volatility that saw the precious metal grapple with conflicting signals. The initial narrative was dominated by escalating geopolitical tensions in the Middle East, which traditionally fuels demand for safe-haven assets like gold. This narrative pushed XAUUSD towards the upper bounds of its recent trading range, even briefly touching levels near $4,219.76. However, as the week progressed, a surprising shift occurred. Reports suggesting progress towards a de-escalation in the Middle East, particularly concerning US-Iran relations, began to surface. This sparked a rapid unwinding of some of the safe-haven premium that had been built into gold prices. The subsequent decline, while not a full-blown sell-off, brought gold back from its weekly highs, highlighting the market's sensitivity to geopolitical headlines. Traders found themselves recalibrating positions as the immediate threat perception diminished, leading to a more cautious approach.
The impact of these geopolitical developments cannot be overstated. News outlets like Reuters reported oil prices plunging as hopes for a US-Iran peace deal grew, a direct consequence of reduced fears of supply disruptions. This, in turn, had a ripple effect on gold. While gold is not directly tied to oil supply in the same way, the underlying driver for both is often perceived geopolitical risk. As this perceived risk receded, the upward pressure on gold eased. This narrative shift underscores the importance of staying agile in the current market environment. What appears to be a strong bullish driver one day can quickly evaporate with new information. The market's reaction was swift, with gold prices pulling back from their peaks as the immediate fear premium was priced out. This illustrates how swiftly sentiment can pivot, leaving traders to reassess their positions based on evolving global dynamics.
Adding another layer of complexity to the gold market's outlook is the persistent uncertainty surrounding Federal Reserve policy. While recent economic data has been mixed, the underlying concern about inflation remains. The Fed's stance on future interest rate hikes or pauses continues to be a dominant factor influencing risk assets and, by extension, gold. The minutes from recent Fed meetings, though not explicitly detailed in the provided data, are often interpreted for clues about the central bank's forward guidance. Any hint of a more hawkish stance – suggesting a readiness to raise rates further or keep them elevated for longer – typically acts as a headwind for gold, as it increases the opportunity cost of holding a non-yielding asset. Conversely, signals of a more dovish approach or a definitive pause could provide support for gold prices by reducing the attractiveness of interest-bearing assets.
Technically, the picture for XAUUSD is currently mixed, reflecting the broader market uncertainties. On the 1-hour chart, gold is trading above its mid-Bollinger Band, with an RSI of 59.29, suggesting a slight upward bias but still within neutral territory. The Stochastic oscillator is also signaling a potential continuation of this upward trend, with %K above %D. However, the MACD is showing negative momentum, trading below its signal line, which introduces a note of caution. The ADX at 18.91 indicates a weak trend, implying that any upward move might lack conviction and could be prone to reversal. This 1-hour picture paints a scenario of cautious optimism, where the immediate sentiment leans slightly bullish, but without strong trend confirmation.
Navigating the Technical Landscape: A Multi-Timeframe View
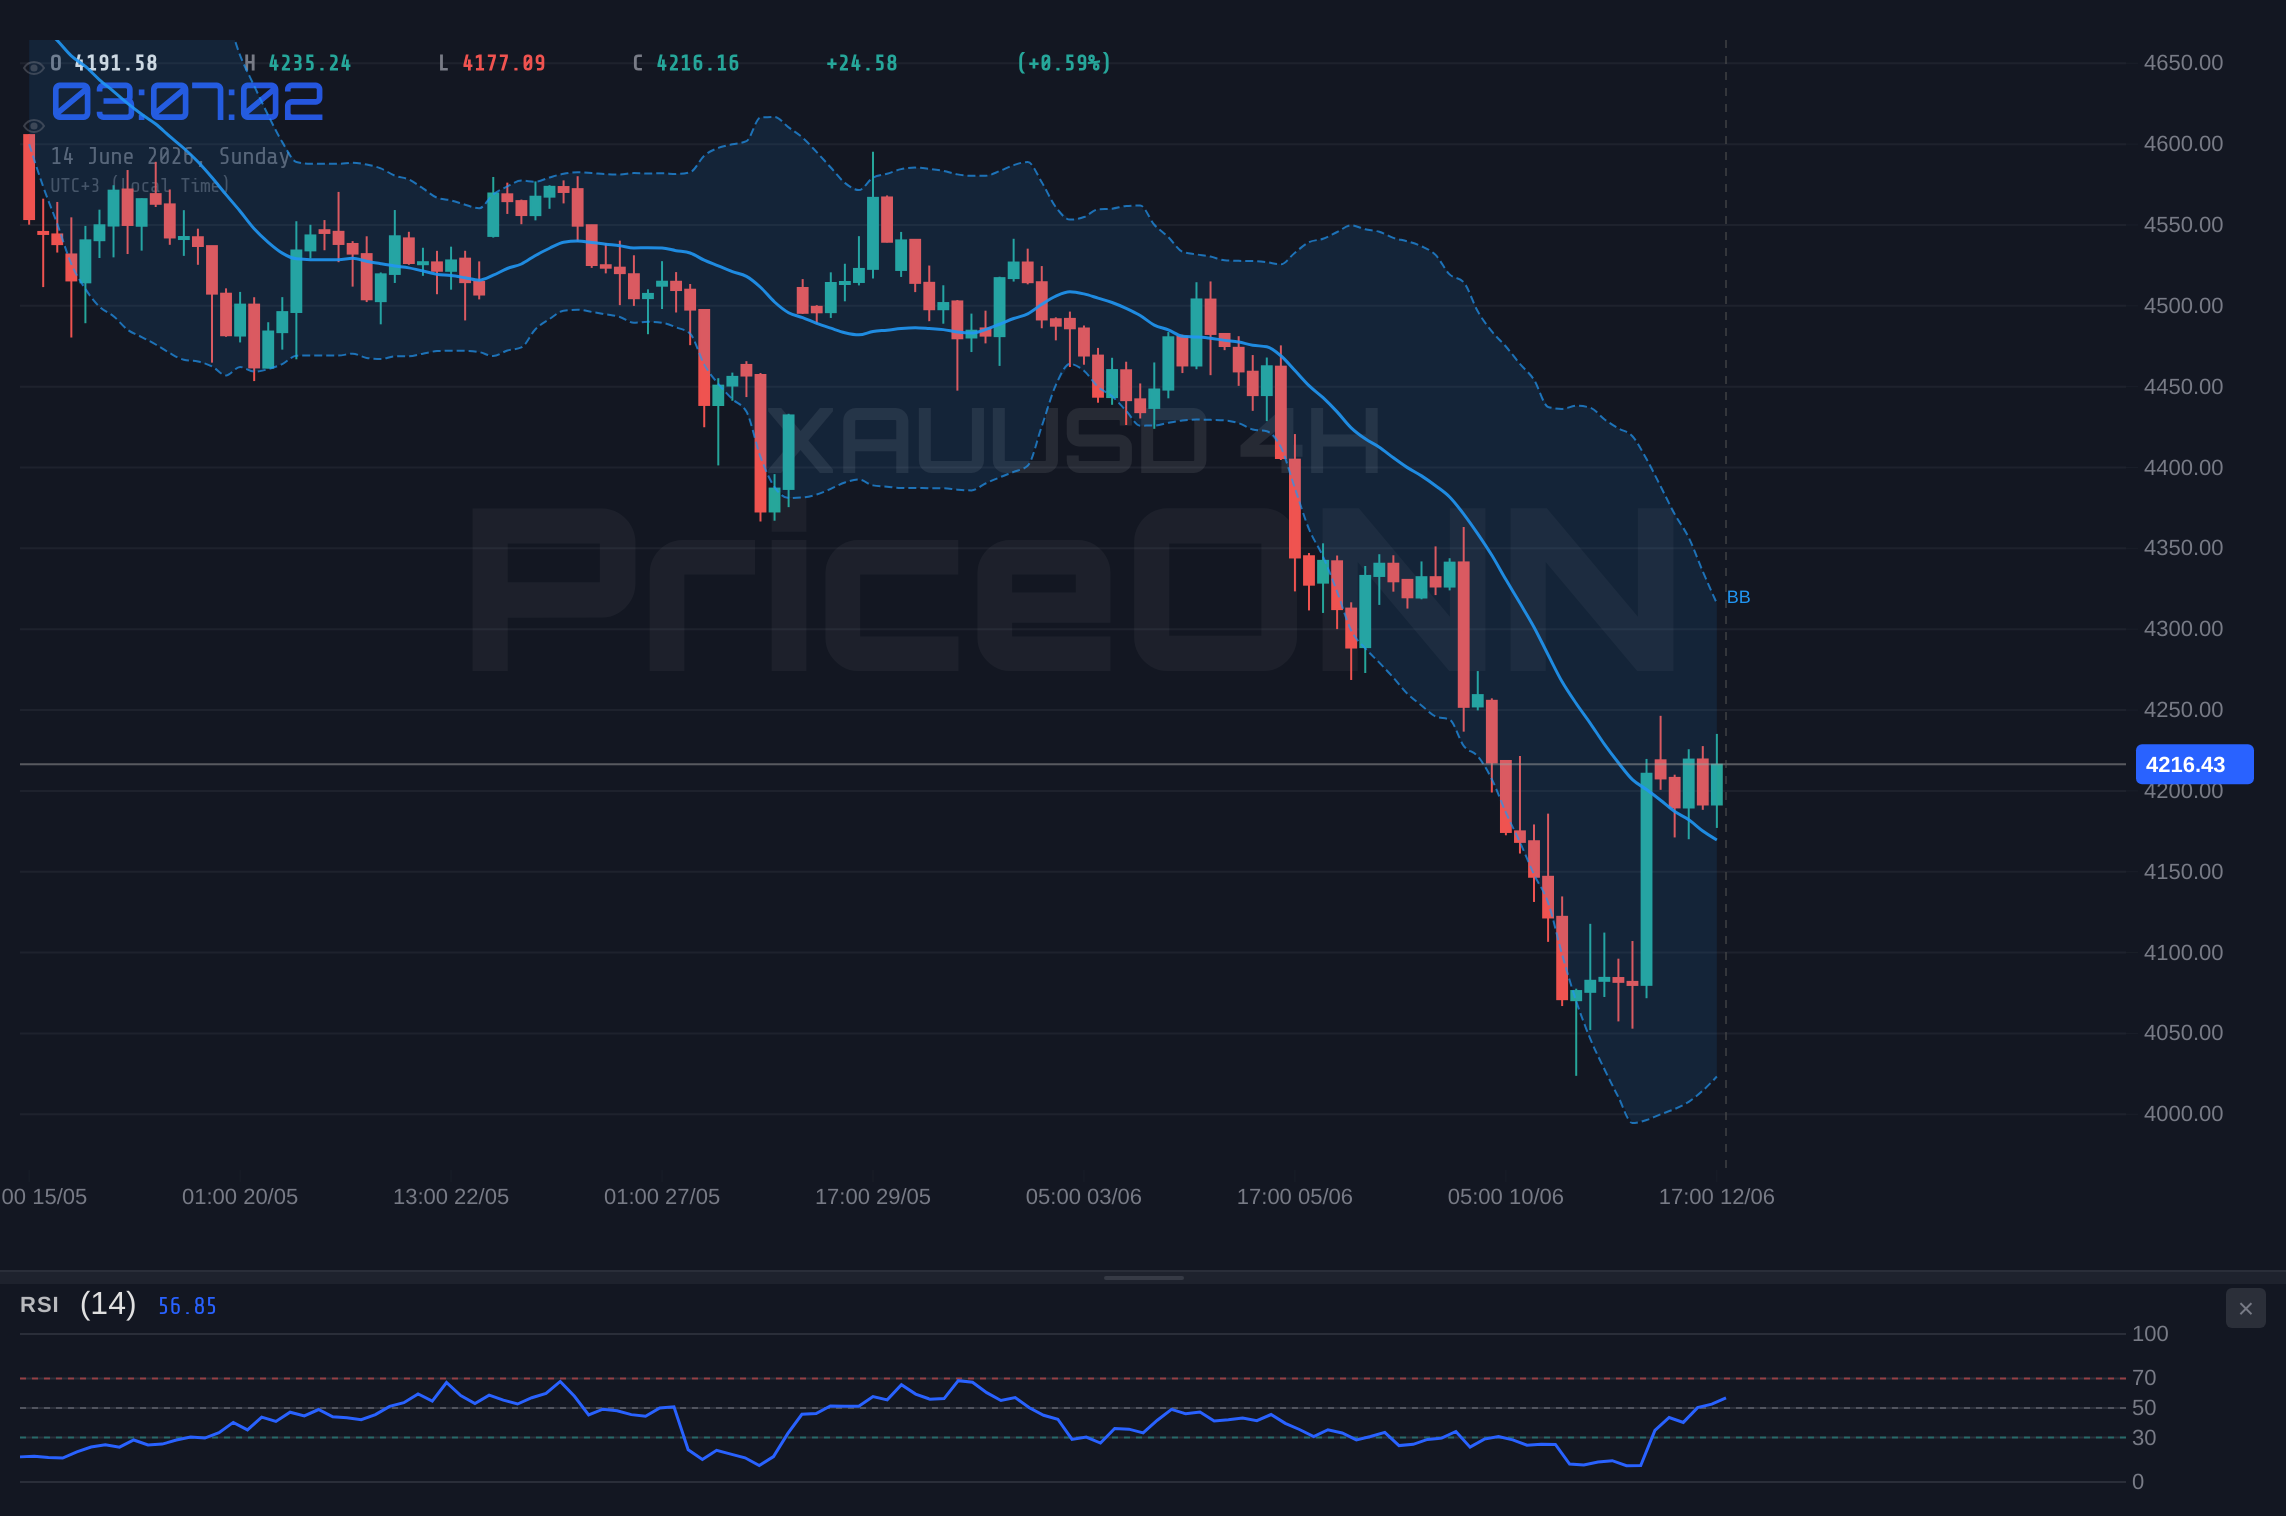
When we extend the analysis to the 4-hour timeframe, the picture becomes more nuanced. Here, the trend is also classified as neutral, but the ADX reading of 34.61 suggests a stronger trend, albeit one that has recently been moving downwards. The RSI at 49.83 is hovering near the midpoint, indicating a lack of strong directional conviction. However, the MACD is positive and above its signal line, hinting at potential underlying strength. The Stochastic oscillator is in overbought territory (K=81.41, D=74.19), which, on this timeframe, often precedes a consolidation or a slight pullback rather than a sustained rally. The Bollinger Bands are also above the middle band, aligning with a generally supportive environment, but the Stochastic's overbought reading warrants attention. This timeframe suggests that while there might be short-term upward pressure, the broader trend on this interval is not yet firmly established as bullish, creating a divergence with the 1-hour sentiment.
The daily chart presents a starkly different perspective, leaning heavily towards a bearish outlook. The trend is firmly classified as 'Düşüş' (Downtrend) with 100% strength. The ADX at 34.06 confirms a strong downtrend, indicating that sellers have been in control for a significant period. The RSI at 35.97 is in the lower half of the neutral zone, displaying a downward tendency, which aligns with the prevailing bearish sentiment. The MACD is negative and below its signal line, reinforcing the bearish momentum. Furthermore, the price is trading below the middle Bollinger Band, a classic sign of bearish pressure. The Stochastic oscillator is also deeply oversold (K=14.69, D=21.38), suggesting that while a short-term bounce might be possible, the overall trend remains firmly downwards. This daily perspective is crucial, as it represents the longer-term conviction in the market's direction, and any bullish moves observed on shorter timeframes must contend with this dominant bearish trend.
The divergence across these timeframes is exactly what makes the current XAUUSD price action so compelling. We see short-term bullish signals on the 1-hour chart, a mixed but slightly more cautious picture on the 4-hour, and a strong bearish trend on the daily. This conflict suggests a market that is in transition or consolidation. The price of $4,216.64 is currently sitting within a critical zone. The immediate support levels to watch are $4,207.86 and $4,200.36 on the 1-hour chart. A break below these levels would likely accelerate selling pressure, especially considering the bearish signals on the daily timeframe. Conversely, for any sustained bullish narrative to emerge, XAUUSD would need to decisively break through resistance levels, starting with $4,229.01 and subsequently challenging higher levels like $4,242.66. The ADX readings across the timeframes - weak on the 1H, strong downtrend on the 4H, and strong downtrend on the 1D - highlight the lack of sustained directional momentum, despite the intraday price action.
Correlations with other markets also play a significant role in shaping the outlook. The US Dollar Index (DXY) is currently trading around 99.78. Historically, a strengthening DXY tends to put downward pressure on gold, as it makes dollar-denominated assets more expensive for holders of other currencies. While the DXY's daily trend is upwards, its ADX of 25.61 suggests a strong trend, but the intraday movement at 99.78 is relatively contained. Any significant move higher in the DXY could exacerbate selling pressure on gold, especially if it coincides with the bearish signals on the daily XAUUSD chart. Conversely, a weakening DXY could provide some much-needed support for gold, potentially helping it to overcome the prevailing downtrend. The interplay between these two assets is a key indicator to monitor.
Furthermore, the broader equity markets, represented by the SP500 and Nasdaq, offer context for risk appetite. The SP500 is showing a strong upward trend on the 1-hour and 4-hour charts, trading at 6572.87, but faces an RSI of 70.95 on the 1H, signaling potential overbought conditions and a risk of pullback. The daily chart shows a downtrend, which is a significant divergence. The Nasdaq, at 29642.68, also shows mixed signals across timeframes, with strong intraday uptrends but longer-term bearish indicators. A risk-off environment, typically characterized by falling equity markets, would usually boost safe-haven assets like gold. However, the current equity strength, albeit with some daily bearish divergence, suggests that risk appetite might be holding, which could temper safe-haven demand for gold. This complex correlation warrants close attention.
The Impact of Energy Markets on Gold's Trajectory
Energy markets, particularly Brent crude oil trading at $88.54, provide another critical lens through which to view gold's prospects, especially concerning inflation. Last week saw significant drops in oil prices, with Brent down 8.63%. This decline was attributed to optimism surrounding potential de-escalation in the Middle East, reducing fears of supply disruptions. A sustained drop in oil prices can have a deflationary impact on the broader economy, potentially reducing inflation expectations. Since gold is often seen as an inflation hedge, a decrease in inflation expectations can reduce its attractiveness. The current bearish signals on both the 1-hour and 4-hour charts for Brent crude, with ADX readings indicating strong downtrends, suggest that the downward pressure on oil may continue in the short term. If oil prices fall further, it could add another layer of bearish pressure on gold, especially if the geopolitical risk premium continues to dissipate.
The economic calendar, even with a weekend date, provides crucial context for the week ahead. While specific high-impact events for today (June 14th) are not detailed with actual outcomes, the upcoming week is packed with significant data releases. The absence of specific outcomes for the listed EUR and USD events (e.g., 'Actual: - | Forecast: -') means that their impact is yet to be fully realized or that they have already occurred without significant market deviation. However, the mention of upcoming central bank decisions, particularly concerning interest rates and inflation, remains paramount. Traders will be scrutinizing any hints from the Fed about its future monetary policy path. Elevated inflation figures or hawkish commentary could strengthen the dollar and pressure gold, while signs of cooling inflation or a dovish pivot could offer relief to the precious metal. The market's reaction to these upcoming economic data points will be a key driver for XAUUSD.
Looking ahead, the path for gold remains uncertain, caught between the receding geopolitical risk premium and the persistent specter of inflation and Fed policy. The $4,216.64 level represents a critical battleground. Bears are looking to push the price below the immediate support at $4,207.86 and potentially towards the $4,186.71 mark. A decisive break below these levels, especially on the daily chart which shows a strong downtrend, would confirm the bearish thesis and could lead to further downside. On the other hand, bulls need to reclaim and hold above the $4,229.01 resistance. A sustained move above this level, coupled with positive confirmation from shorter-term technical indicators and perhaps a shift in DXY or oil prices, could signal a short-term recovery. However, given the strong daily downtrend (ADX 34.06) and the current RSI of 35.97, any bullish moves might be met with significant selling pressure as the market digests the longer-term bearish outlook.
Bearish Scenario: The Consolidation Continues
60% ProbabilityNeutral Scenario: Range-Bound Volatility
30% ProbabilityBullish Scenario: A Reversal Attempt
10% ProbabilityFrequently Asked Questions: XAUUSD Analysis
What happens if XAUUSD breaks below the $4,207.86 support level?
A break below the $4,207.86 support level on the 1-hour chart would likely signal further downside, potentially targeting the $4,186.71 level. This would align with the prevailing bearish trend observed on the daily timeframe, especially if confirmed by rising ADX values.
Should traders buy XAUUSD at current levels around $4,216.64 given the mixed technical signals?
Buying at current levels carries significant risk due to the conflicting signals across timeframes and the strong daily downtrend. A more prudent approach would be to wait for confirmation, such as a sustained break above $4,229.01 resistance, or to look for potential shorting opportunities on a clear break below immediate support.
Is the RSI at 59.29 on the 1H chart a buy signal for XAUUSD right now?
An RSI of 59.29 on the 1-hour chart indicates neutral momentum with a slight upward leaning, but it is not a standalone buy signal. It suggests that buyers have some control, but the overall trend on longer timeframes needs to be considered for a confirmed trade. The ADX at 18.91 on this timeframe also suggests a lack of strong trend conviction.
How might the upcoming economic data releases affect XAUUSD this week, given the current $4,216.64 price?
Upcoming economic data, particularly any indicators related to inflation or Fed policy, will be crucial. Stronger-than-expected inflation figures or hawkish Fed commentary could pressure gold lower from $4,216.64, while dovish signals or weaker data might provide support, potentially aiding a move towards resistance levels.
Technical Outlook Summary
| Indicator | Value | Signal | Interpretation |
|---|---|---|---|
| RSI (14) | 59.29 | Neutral | Slight upward bias, but not overbought |
| MACD Histogram | -15.20 | Bearish | Negative momentum, below signal line |
| Stochastic | K:69.83, D:60.39 | Bullish | %K > %D, upward signal |
| ADX | 18.91 | Weak | Trend strength is low, potential for range-bound trading |
| Bollinger | Upper Band | Watch | Price is above middle band, indicating some upward pressure |
Key Levels
Support Levels
Resistance Levels
Track markets in real-time
AI-powered analysis, technical indicators and real-time price data.
Join Our Telegram Channel
Breaking market news, AI analysis and trading signals instantly.
Join Channel