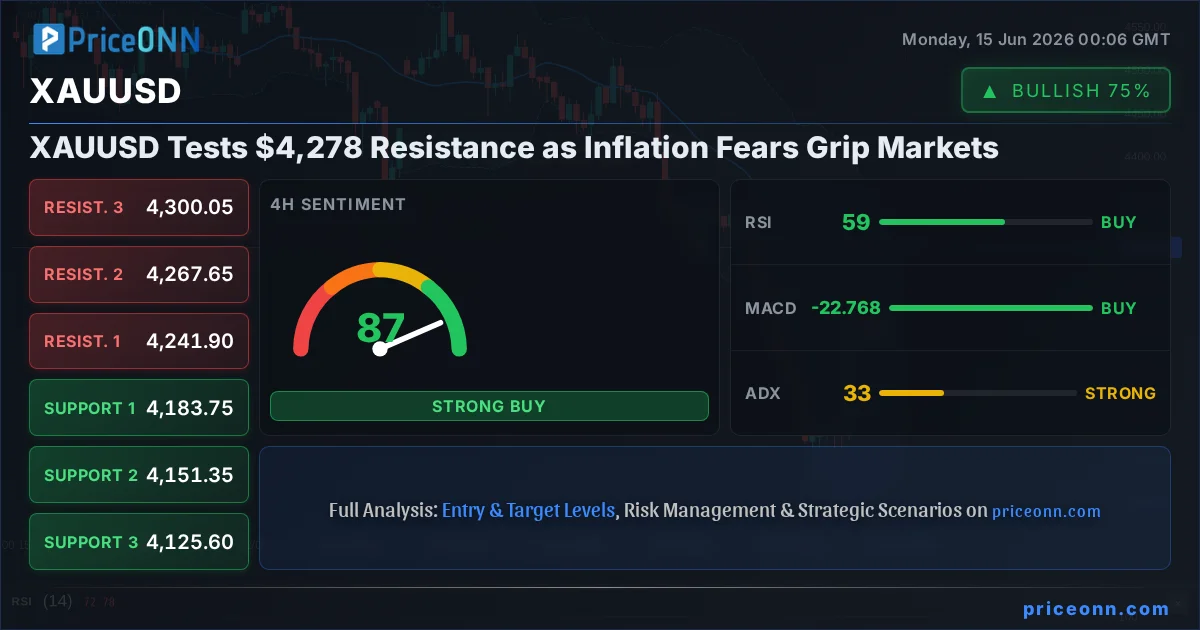
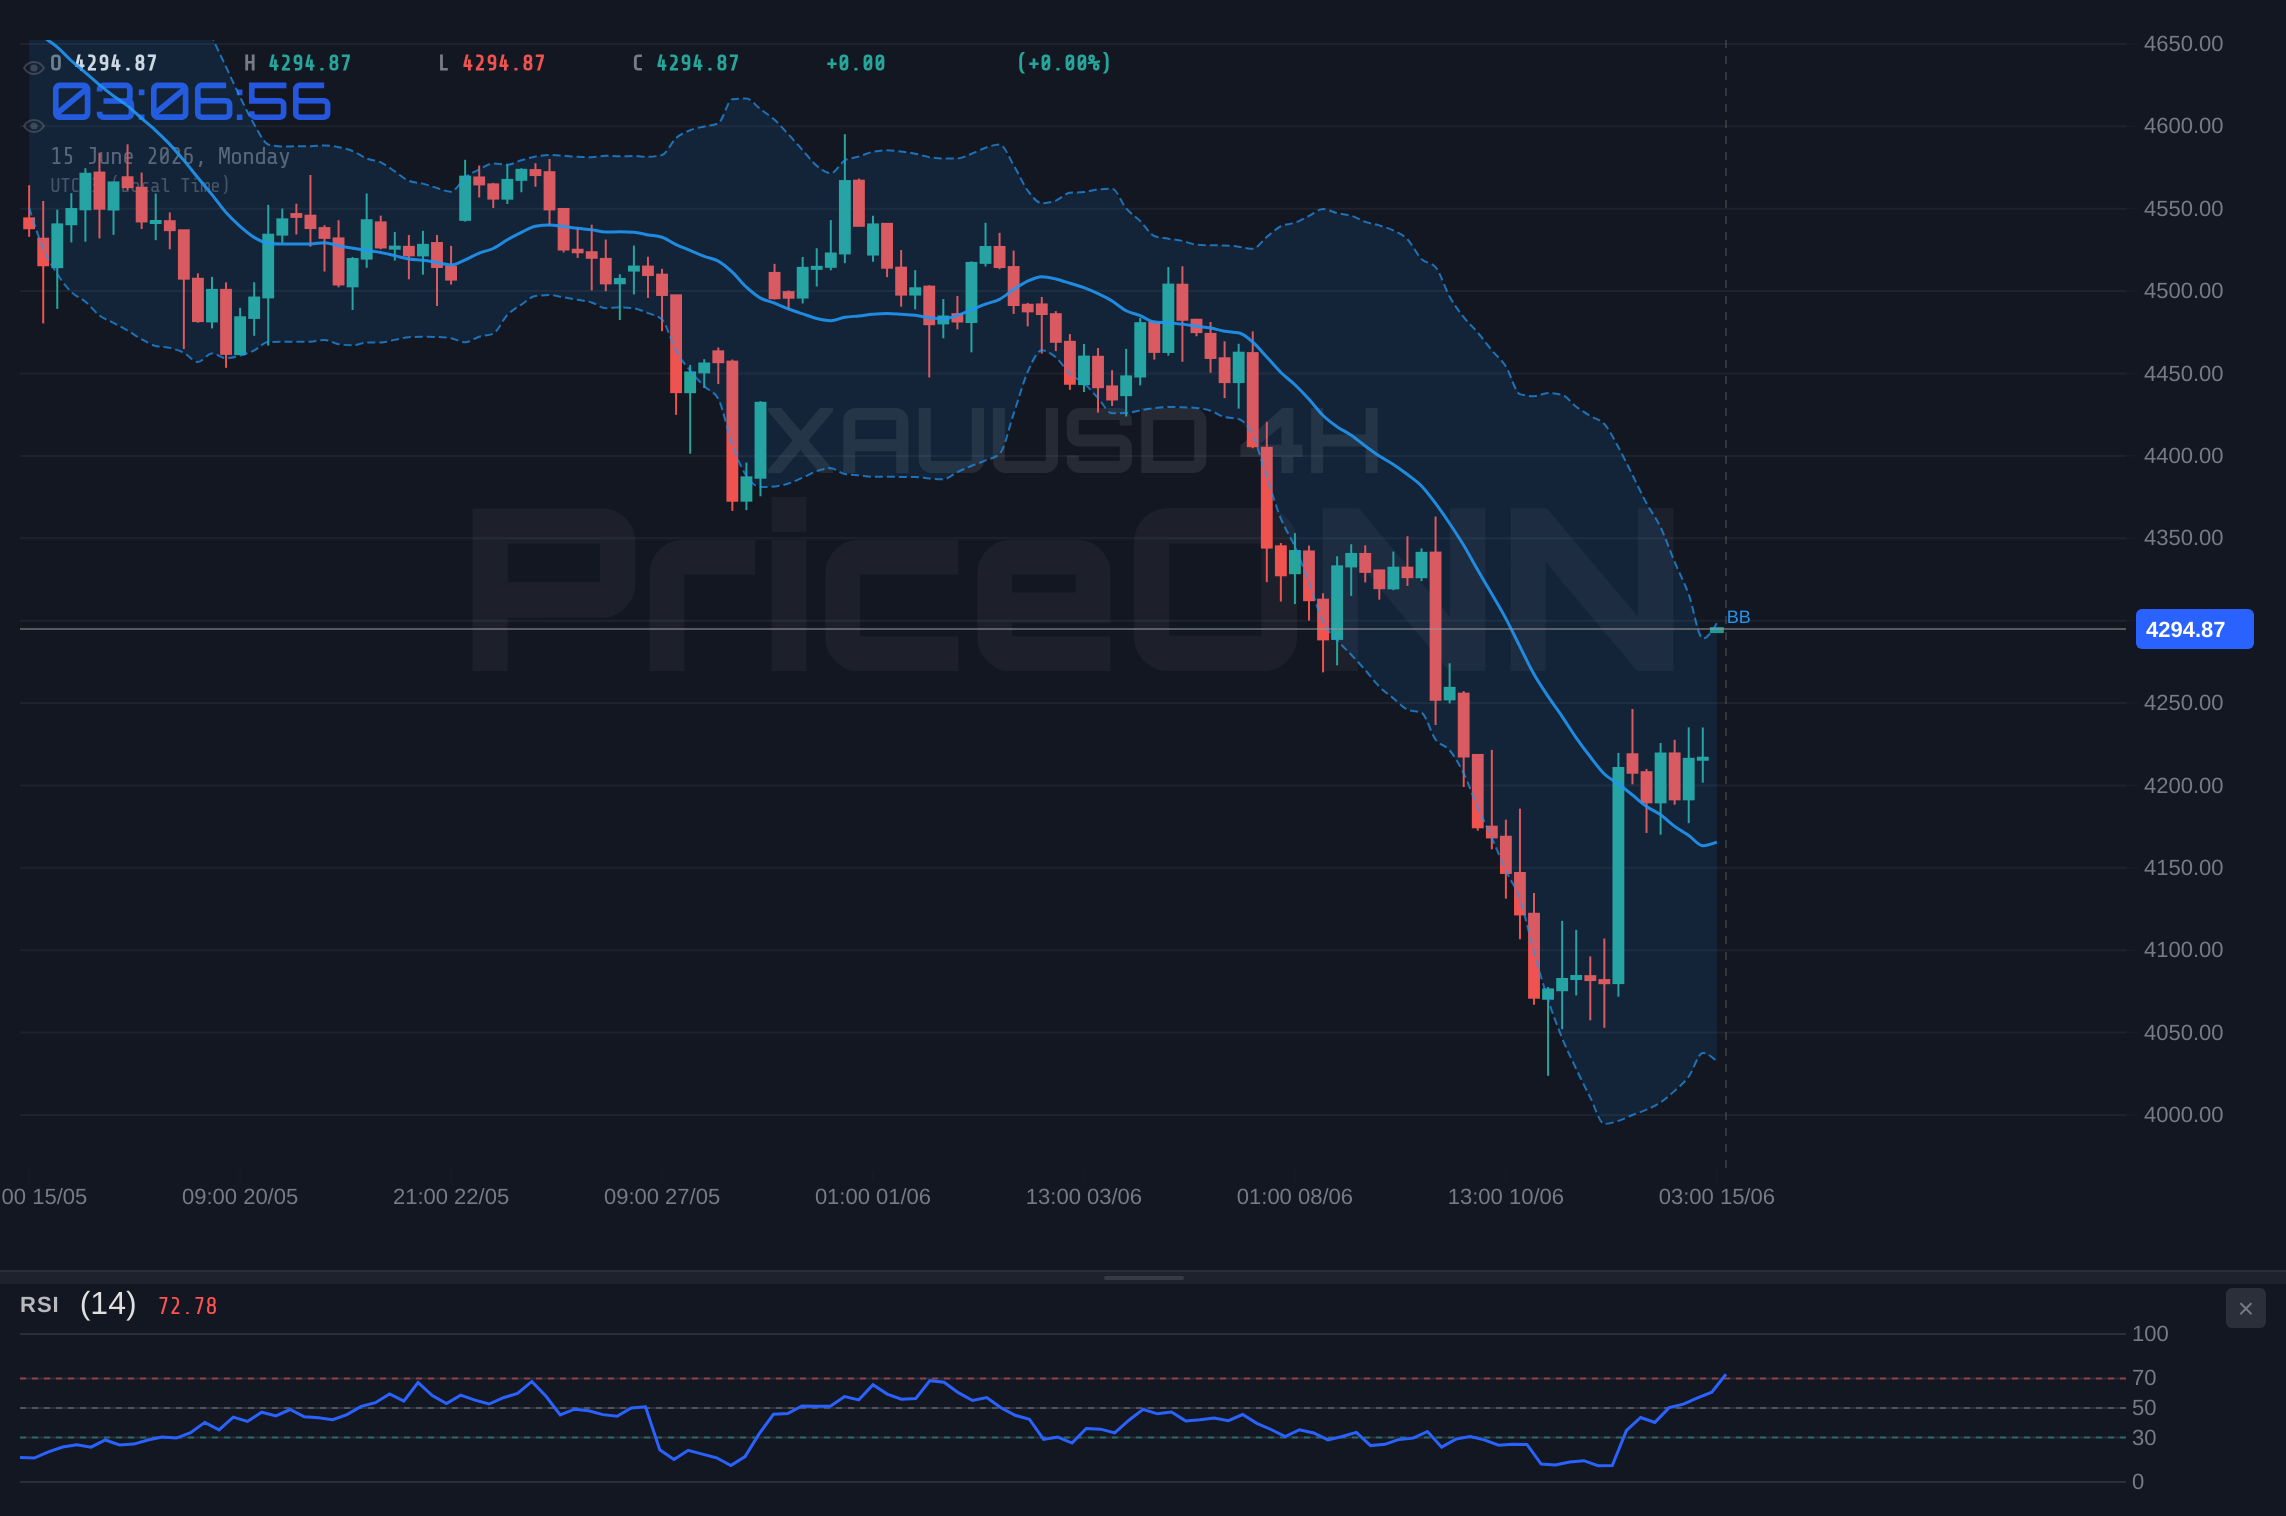
The relentless climb in gold prices has brought XAUUSD to a critical juncture, currently hovering around $4,295.62. This ascent, fueled by persistent inflation concerns and a strengthening dollar, has XAUUSD probing significant resistance levels, notably near the $4,278 mark. The question on every trader's mind is whether this upward momentum can be sustained or if these higher levels will trigger a sharp correction. Understanding the interplay between macroeconomic drivers, technical indicators, and geopolitical undercurrents is crucial for navigating this volatile market landscape. This XAUUSD today analysis reveals a market at a crossroads, demanding careful observation of key triggers and levels.
- RSI at 73.9 signals overbought pressure on the 1-hour chart, suggesting a potential for profit-taking.
- Critical resistance sits at $4,307.89, a level that must be breached for the bullish trend to continue.
- The ADX at 22.45 indicates a medium-strength uptrend on the 1H, but the 1D trend remains bearish (ADX 34.94), creating a conflict.
- DXY at 99.51 is showing strength, typically exerting downward pressure on gold prices.
The Bull's Roadmap: Navigating Towards Higher Ground
For gold bulls, the path forward hinges on decisively breaking through the immediate resistance zone. The $4,307.89 level stands as the first significant hurdle. A sustained break above this price, ideally accompanied by strong volume and a bullish confirmation from indicators like the RSI moving out of overbought territory on shorter timeframes, could pave the way for further gains. On the 1-hour chart, the trend is undeniably bullish with an ADX of 76% strength, and the MACD remains above its signal line, indicating positive momentum. If these conditions hold, the next logical target would be the $4,330.03 resistance, followed by $4,351.25. This scenario relies heavily on continued inflation fears and a potential shift in risk sentiment that favors safe-haven assets over the dollar. The XAUUSD price forecast in this bullish case sees the precious metal extending its rally, especially if upcoming economic data continues to point towards persistent price pressures, forcing central banks to maintain a cautious stance on interest rate cuts.
However, the multi-timeframe analysis presents a mixed picture that bulls must acknowledge. While the 1-hour and 4-hour charts show bullish signals, the daily timeframe paints a different story. The 1D trend is firmly in the bearish camp (100% strength), with RSI at 41.31 and MACD below its signal line. This divergence suggests that the recent upward move might be a correction within a larger downtrend, rather than the start of a new bull cycle. For the bullish thesis to truly gain traction, we would need to see a clear shift in the daily indicators, with RSI moving back above 50 and MACD crossing into positive territory. The current XAUUSD trend analysis highlights this intra-week strength against longer-term bearish pressures, making a decisive break above resistance even more critical for sustained upside.
The correlation with the US Dollar Index (DXY) also plays a pivotal role. Currently, the DXY is trading around 99.51 and shows a rising trend on shorter timeframes, which typically exerts downward pressure on gold. For gold to break higher, either the DXY needs to falter significantly, or the inflation narrative must become so dominant that it overrides the dollar's strength. The XAUUSD support and resistance levels are therefore crucial battlegrounds. Support at $4,264.53 must hold to maintain the immediate bullish structure, while breaking resistance at $4,307.89 is the key to unlocking further upside potential in this scenario. The XAUUSD key levels are whispering caution to the bulls, demanding confirmation before committing to a sustained move higher.
The conflicting signals between shorter-term bullish trends and the longer-term daily bearish outlook present a significant risk. Bulls must be wary of a potential 'bull trap' if key resistance levels fail to break decisively, especially with the DXY showing resilience.
Where Bears Take Control: The Downside Risks
From a bearish perspective, the current price action around $4,295.62 presents an attractive opportunity for profit-taking and a potential re-entry for short positions. The most immediate bearish trigger would be a failure to decisively break the $4,307.89 resistance, followed by a close below the $4,264.53 support level. This would signal a potential reversal, especially if confirmed by a shift in momentum indicators. On the daily chart, the trend is strongly bearish, with RSI below 50 and MACD in negative territory. A break below the $4,243.31 support could accelerate selling pressure, targeting the next key level at $4,183.75 on the 4-hour chart. Bears are watching for any signs of weakness, particularly if inflation expectations begin to cool or if central banks signal a more hawkish stance than currently priced in.
The XAUUSD RSI signal at 73.9 on the 1-hour chart is a classic sign of an overbought condition, suggesting that the recent rally may be overextended. Coupled with the Stochastic K line at 80.27 and D line at 69.76, which also indicates an overbought market, bears have technical ammunition. If price fails to push higher and instead starts to roll over, these indicators could quickly turn bearish, confirming a short-term top. The ADX reading on the daily chart at 34.94 confirms a strong existing trend, which, in this case, is a downtrend. This suggests that any upward retracements might be short-lived, and the path of least resistance could still be lower. The XAUUSD market sentiment, while currently leaning bullish on shorter timeframes due to the price action, has underlying bearish tones when viewed from the daily perspective.
Furthermore, any positive developments on the geopolitical front, such as de-escalation of tensions in the Middle East or improved US-China relations, could reduce the safe-haven demand for gold, further supporting a bearish outlook. The recent news regarding energy markets, while showing price drops, indicates underlying inflation pressures from rising energy bills globally. However, if official inflation data begins to show a significant cooling, it would remove a key pillar supporting gold's rise. The XAUUSD support and resistance levels are critical here: a failure to hold $4,264.53 opens the door to $4,183.75, while a sustained move back below the daily middle Bollinger band would be a strong bearish signal. Bears are looking for a clear break of these lower levels to initiate new positions targeting significant downside.
For short-sellers, the current overbought conditions on shorter timeframes, coupled with the strong daily downtrend, present a high-probability setup if key support levels break. Waiting for confirmation below $4,264.53 could offer a favorable risk-reward ratio.
The Waiting Game: Caught in the Range
A neutral scenario for XAUUSD would involve price action becoming range-bound, likely between the $4,264.53 support and the $4,307.89 resistance. This typically occurs when conflicting market forces create indecision. On one hand, persistent inflation fears and geopolitical risks provide a floor for gold, acting as a safe-haven bid. On the other hand, a strong dollar and the potential for central banks to maintain higher-for-longer interest rates act as a ceiling, capping upside potential. This tug-of-war could lead to consolidation, especially if key economic data releases are mixed or inconclusive.
Technical indicators often reflect this indecision. On the daily chart, the ADX is at 34.94, indicating a strong trend, but the conflicting signals from RSI (41.31) and MACD (negative momentum) suggest the trend's direction is in question. If price remains trapped between the defined support and resistance, we might see indicators like RSI oscillate around the 50 level, and MACD histograms flatten out. Bollinger Bands might start to narrow, a sign of decreasing volatility and potential consolidation before the next significant move. In this scenario, traders would look for extreme readings in oscillators like Stochastic (currently showing overbought on 1H/4H) to fade, and dips towards support to buy, anticipating a range continuation. The XAUUSD market sentiment would likely become more cautious, with traders waiting for a clear breakout catalyst.
The XAUUSD trading signals would become less reliable during a range-bound period. Breakouts from such ranges can be sharp and decisive, making it crucial for traders to wait for confirmation rather than trying to anticipate the direction. The key would be to watch the volume accompanying any moves towards the boundaries of the range. A significant increase in volume on a break of support or resistance would signal a higher probability of a sustained move in that direction. Without such confirmation, the market might continue to churn, offering limited opportunities for trend-following strategies and favoring range-trading tactics within the defined XAUUSD key levels.
During consolidation, focus on shorter-term opportunities within the range, but always have a plan for when the breakout inevitably occurs. Monitor volume and price action at the $4,264.53 and $4,307.89 levels closely.
Weighing the Probabilities: The Most Likely Path
Considering the current technical landscape and fundamental drivers, the most probable scenario for XAUUSD in the short to medium term appears to be a bearish continuation with a potential for consolidation first. The daily timeframe's dominant bearish trend (100% strength), supported by RSI at 41.31 and negative MACD momentum, carries significant weight. While shorter timeframes show bullishness, this often represents a corrective bounce within a larger downtrend. The XAUUSD price forecast leans towards a retest of lower levels unless a major shift in inflation data or central bank policy occurs. The DXY's strength at 99.51 further supports this view, as it typically correlates inversely with gold.
Therefore, the most likely scenario anticipates a failure to sustain the move above the $4,307.89 resistance. Price may consolidate briefly around the current $4,295.62 levels, potentially testing support at $4,264.53. A decisive break below this level would then open the path towards the $4,183.75 area. This scenario carries an estimated probability of 60-65%. The bullish scenario, while possible if inflation data surprises significantly to the upside or geopolitical risks escalate dramatically, currently faces strong headwinds from the daily chart and dollar strength, assigning it a lower probability of 25-30%. The neutral, range-bound scenario is possible but less likely given the strong daily trend, estimated at 10-15% probability.
The key to confirming this bearish bias lies in watching how XAUUSD reacts to the $4,307.89 and $4,264.53 levels. A failure to hold the latter would be a strong signal for bears. Conversely, a sustained break above the former, coupled with a change in daily indicators, would invalidate this bearish outlook. The current XAUUSD market sentiment is still somewhat mixed, reflecting the conflict between short-term gains and long-term trends, but the weight of evidence leans towards a bearish resolution in the coming weeks.
The most probable path suggests caution for bulls. Traders should look for signs of weakness near resistance and confirmation on a break of support. The XAUUSD trading signals are currently mixed, emphasizing the need for patience and risk management.
What I'm Watching This Week: Key Triggers
As we move through the trading week, several key factors will dictate the direction of XAUUSD. Firstly, the upcoming economic data releases, particularly those related to inflation and employment in major economies like the US and Eurozone, will be paramount. Any indication that inflation is proving more stubborn than expected could fuel further safe-haven demand for gold, potentially invalidating the bearish outlook. Conversely, signs of cooling inflation could accelerate selling pressure.
Secondly, the DXY's performance remains critical. We need to observe whether the dollar can maintain its upward momentum or if it falters, especially if the Federal Reserve signals a shift in its monetary policy stance. The correlation between DXY and XAUUSD is a key element to monitor. A strengthening dollar typically spells trouble for gold, and vice versa. The XAUUSD key levels at $4,307.89 and $4,264.53 will be pivotal in determining the immediate direction. A clear break of either level, especially on significant volume, will be a strong signal for the market.
Finally, geopolitical developments continue to be a wildcard. Any escalation of tensions in existing hotspots or the emergence of new geopolitical risks could trigger a flight to safety, providing a significant boost to gold prices irrespective of other technical or fundamental factors. Traders should remain vigilant for news headlines that could impact global risk appetite. The interplay of these factors – economic data, central bank signals, dollar strength, and geopolitical events – will ultimately determine whether gold continues its ascent or succumbs to the prevailing daily downtrend.
Bearish Scenario: Testing the Depths
65% ProbabilityBullish Scenario: Breaking the Chains
25% ProbabilityNeutral Scenario: The Waiting Game
10% ProbabilityFrequently Asked Questions: XAUUSD Analysis
What happens if XAUUSD breaks above the $4,307.89 resistance level?
A sustained break above $4,307.89, especially if confirmed by daily chart indicators turning bullish, would invalidate the bearish outlook and could target $4,330.03 and potentially $4,474.97. This scenario, however, currently carries a lower probability of 25-30%.
Should I consider buying XAUUSD at current levels around $4,295.62 given the RSI at 73.9?
Buying at current levels with RSI at 73.9 presents a high risk of entering near a short-term peak. While a bullish scenario is possible, the daily downtrend and DXY strength suggest caution. It would be prudent to wait for a pullback to support near $4,264.53 or confirmation of a decisive break above resistance.
Is the RSI at 73.9 a strong sell signal for XAUUSD right now?
An RSI of 73.9 on the 1-hour chart indicates overbought conditions, signaling potential profit-taking or a short-term reversal. However, it is not an automatic sell signal, especially when considered against longer-term trends or strong fundamental drivers like inflation fears. Confirmation from price action and other indicators is crucial.
How will the upcoming economic data releases affect XAUUSD this week?
Key inflation and employment data releases will be critical. Stronger-than-expected inflation figures could bolster XAUUSD by increasing safe-haven demand and reinforcing rate-hike expectations, potentially invalidating the bearish outlook. Conversely, softer data could accelerate selling pressure, aligning with the daily downtrend.
Technical Outlook Summary
| Indicator | Value | Signal | Interpretation |
|---|---|---|---|
| RSI (14) | 73.9 | Neutral | Overbought on 1H, but neutral on 4H/1D. Watch for pullback. |
| MACD | Positive | Bullish | Positive momentum on 1H/4H, but bearish on 1D. |
| Stochastic | K=80.27 | Neutral | Overbought on 1H/4H, suggesting potential reversal. |
| ADX | 22.45 | Bullish | Medium strength uptrend on 1H, strong on 4H, but strong downtrend on 1D. Conflicting. |
| Bollinger Bands | Upper Band | Watch | Price above upper band on 1H/4H signals potential overextension. |
Key Levels
Track markets in real-time
AI-powered analysis, technical indicators and real-time price data.
Join Our Telegram Channel
Breaking market news, AI analysis and trading signals instantly.
Join Channel