The complex interplay of global supply dynamics, geopolitical undertones, and shifting market sentiment has brought WTI Crude Oil to a critical juncture around the $77.10 mark. As traders eye the upcoming resistance at $77.44, the prevailing technical indicators paint a picture of a strong prevailing downtrend, particularly on the shorter timeframes. However, the persistent strength of the dollar and lingering inflation concerns add layers of complexity, demanding a nuanced approach to decipher the immediate future of this vital energy commodity. Understanding the confluence of these factors is paramount for any market participant looking to navigate the choppy waters of the oil market.
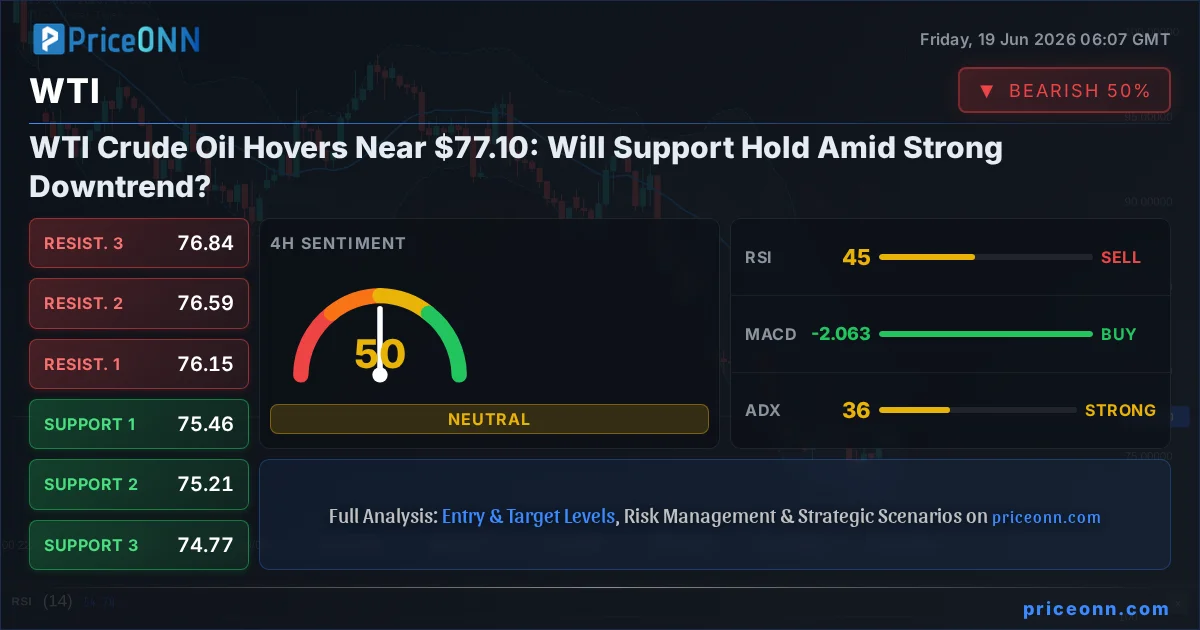
- WTI Crude Oil is currently trading at $77.10, facing immediate resistance at $77.44.
- The 1-hour chart shows a strong downtrend with RSI at 63.01, suggesting potential for further upward momentum before exhaustion.
- Key support levels are identified at $75.89 and $75.51, with a crucial breakdown point at $75.19.
- The DXY is at 101.05, exerting upward pressure on oil prices through its inverse correlation.
The current price action for WTI Crude Oil, hovering precariously around $77.10, demands immediate attention. The 1-hour chart reveals a strong downtrend, with the Relative Strength Index (RSI) at 63.01. While this might seem high, it's important to note that in a strong trend, RSI can remain elevated or depressed for extended periods without signaling an immediate reversal. The momentum indicators on this timeframe, such as the MACD, show positive momentum with the signal line above, hinting at a potential short-term bounce. However, the overarching trend strength, as indicated by the ADX at 17.48, suggests a weak trend at this specific moment, implying that the current move might be a retracement within a larger, yet undefined, trend. This ambiguity is precisely why traders must exercise caution and await clearer signals.
Delving deeper into the technical landscape, the 4-hour chart presents a more cautionary outlook. Here, the trend is classified as a strong downtrend with 93% power. The RSI sits at 43.23, indicating a neutral stance but with a slight leaning towards bearish sentiment, suggesting that the upward momentum seen on the 1-hour chart might be temporary. The MACD, while showing positive momentum on the 1-hour, flips to positive momentum with the signal line above on the 4-hour, further complicating the picture. The Stochastic Oscillator, with %K at 58.99 and %D at 27.01, signals a potential upward move, but the ADX at 36.2 indicates a strong trend is in play. This confluence of indicators, particularly the strong ADX, suggests that any current upward movement might be a counter-trend rally within a larger bearish structure. The signals here are mixed, leaning towards caution, a sentiment reinforced by the daily chart's outlook.
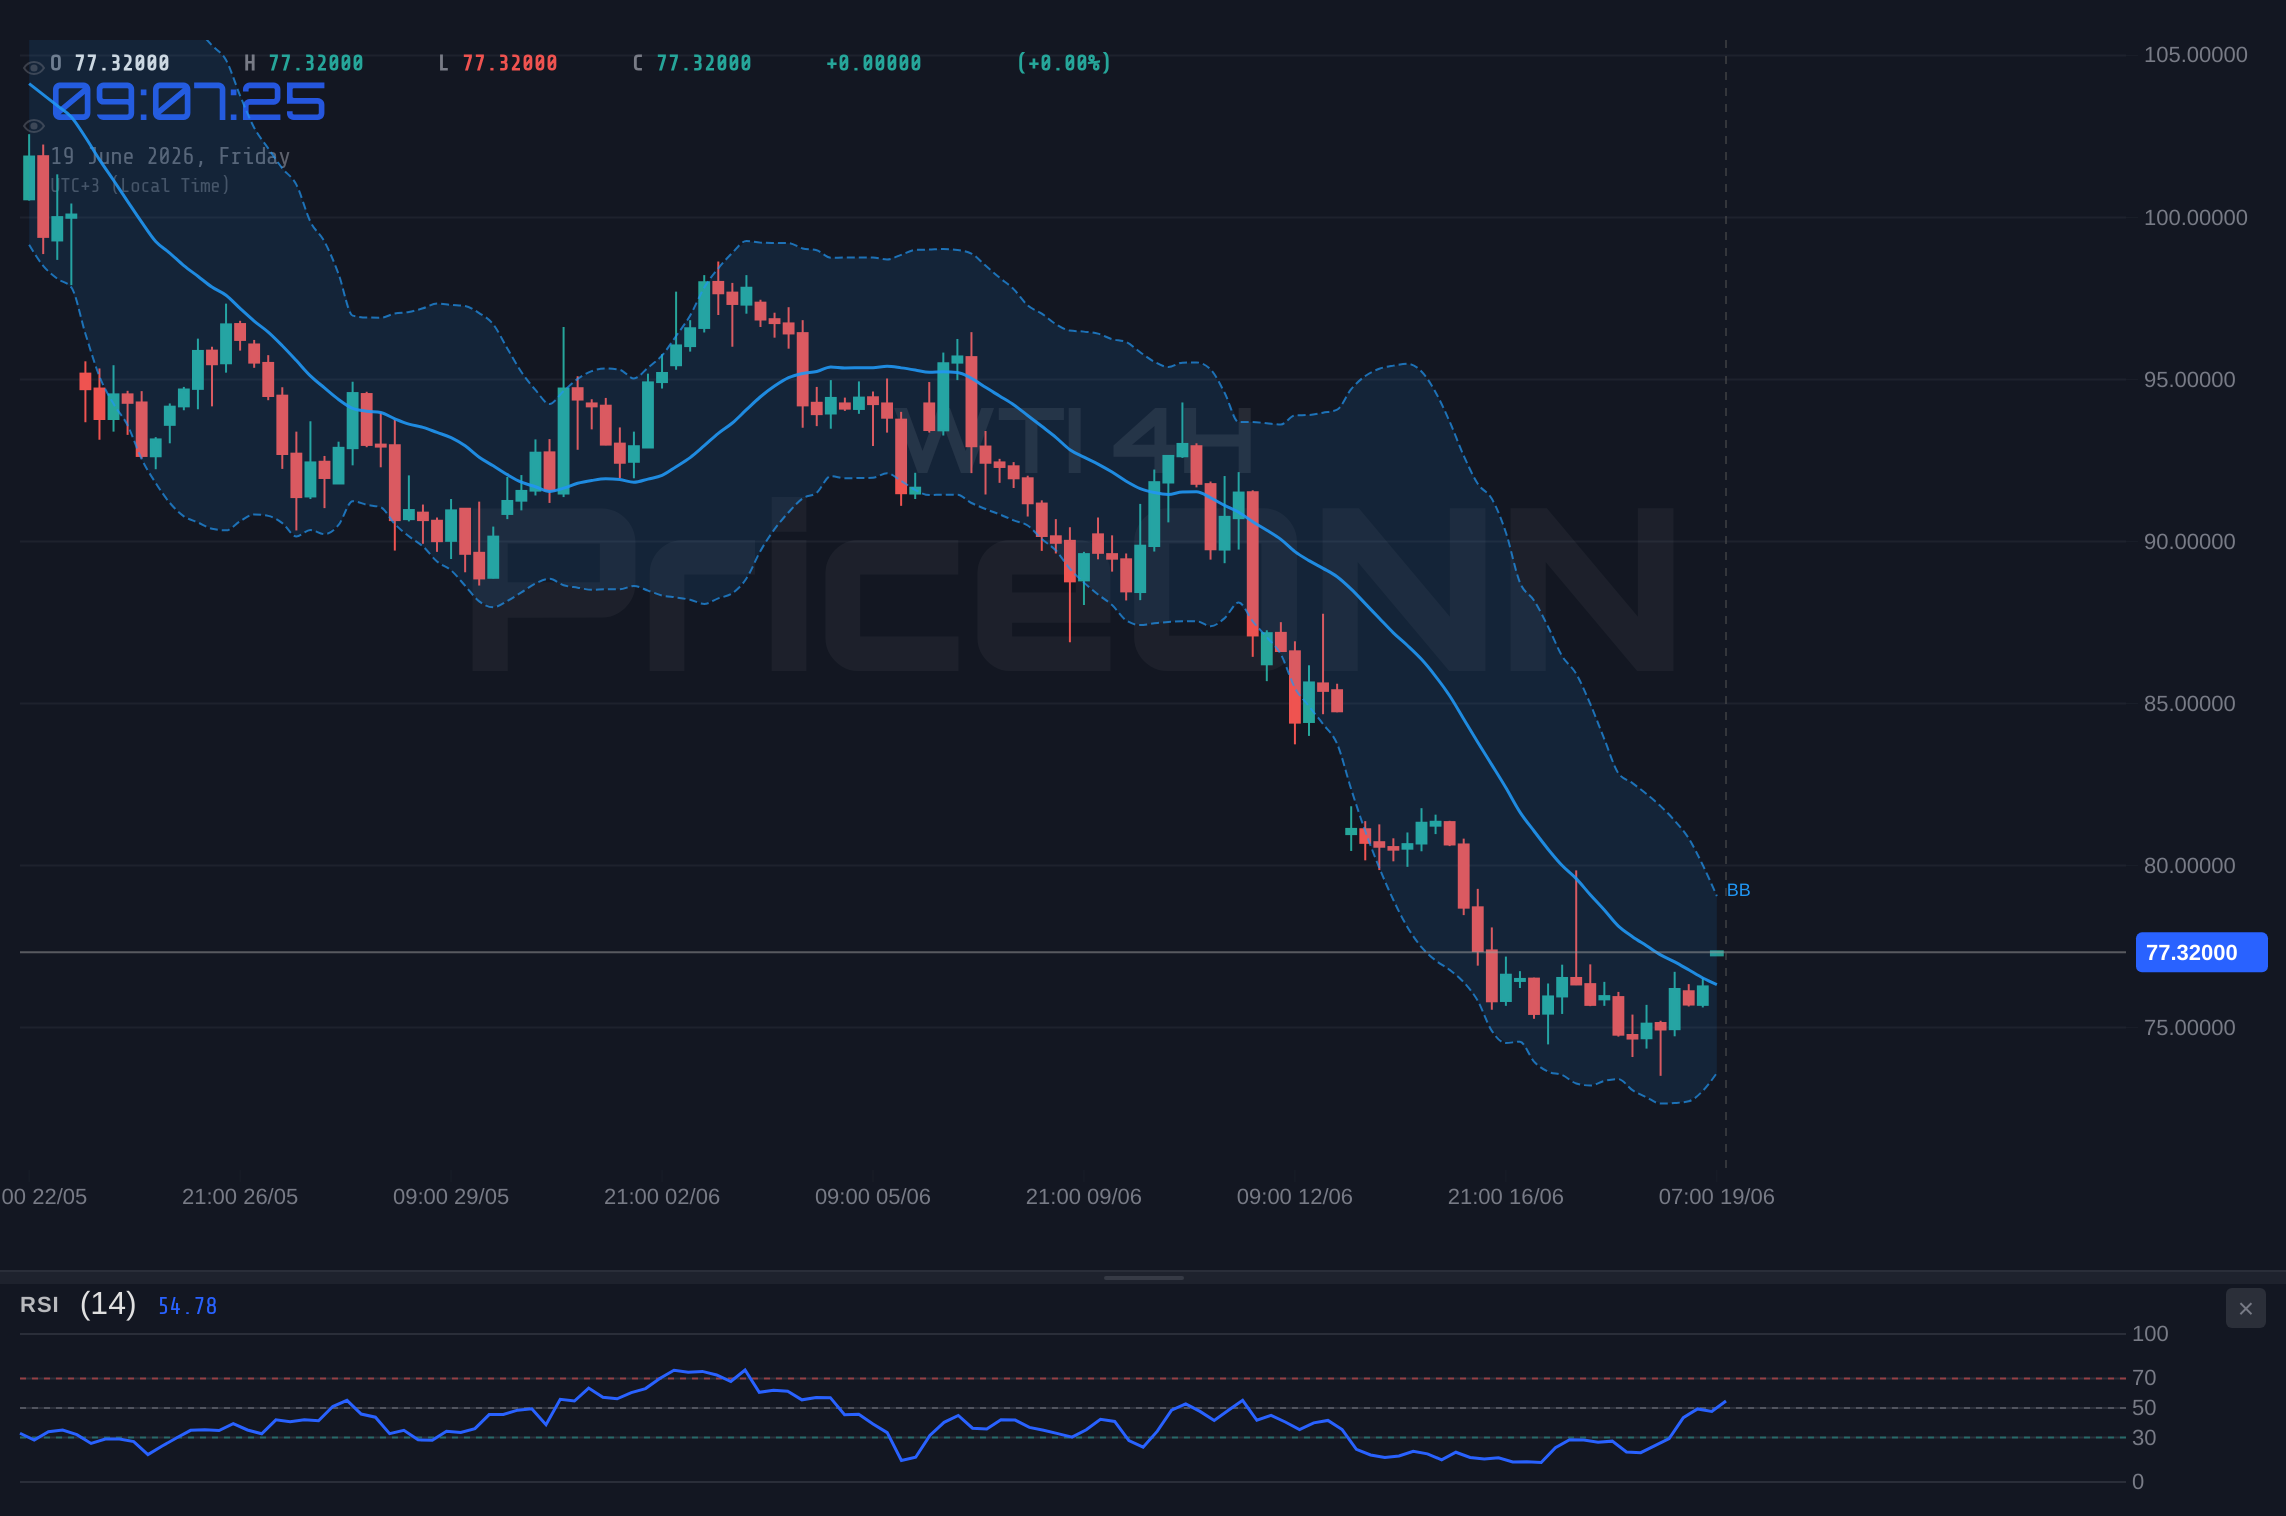
On the daily timeframe, WTI Crude Oil exhibits a pronounced downtrend with 97% power. The current price of $77.10 finds itself well below the middle Bollinger Band, which is currently situated around $76.15. This placement reinforces the bearish bias, suggesting that the path of least resistance is downwards. The RSI is at 32.13, firmly in the neutral zone but biased towards oversold conditions, potentially signaling an upcoming bounce, although the strong trend might prevent this. The MACD is negative, with the histogram below the signal line, confirming bearish momentum. The Stochastic Oscillator is deeply in oversold territory, with %K at 11.49 and %D at 9.76, indicating that a short-term reversal could be on the cards. However, the ADX at 23.15, while indicating a strong trend, is not as elevated as on shorter timeframes, suggesting that the trend's conviction might be wavering slightly on a daily basis. This daily picture is crucial; it suggests that any short-term gains are likely to be met with selling pressure as the larger downtrend reasserts itself.
The correlation with the US Dollar Index (DXY) cannot be overstated in this environment. With the DXY currently trading at 101.05 and showing a strong upward trend on all timeframes, it exerts considerable downward pressure on commodities priced in dollars, including WTI Crude Oil. The DXY's current strength, particularly its robust 1H trend and elevated RSI nearing 70.83, suggests that the dollar is likely to remain firm in the short term. This strength directly translates into headwinds for oil prices. If the DXY continues its ascent, it will make it more expensive for holders of other currencies to purchase dollar-denominated crude, potentially dampening demand and capping any bullish aspirations for WTI. This relationship is a fundamental pillar in understanding the current price action.
Furthermore, the broader market sentiment, as reflected by the S&P 500 and Nasdaq indices, adds another layer to the WTI narrative. The S&P 500 is showing a mixed picture, with a strong 1H trend but a neutral 4H and a bearish 1D trend. Its current price of 6572.87, up 0.74% on the day, suggests some resilience in risk assets, but the underlying bearishness on the daily chart cannot be ignored. The Nasdaq, similarly, shows a strong daily uptrend but a neutral 4H and 1H, indicating potential choppiness. This mixed risk appetite suggests that while there might be some appetite for riskier assets, the overall economic outlook could be weighing on sentiment. In such an environment, commodities like oil, which are sensitive to global growth expectations, might find it difficult to sustain rallies if broader market fears resurface.
Navigating the Resistance at $77.44
The immediate price ceiling for WTI is situated at the resistance level of $77.44. This is not merely an arbitrary number; it represents a price point where selling pressure has historically intensified, either halting upward momentum or triggering a reversal. On the 1-hour chart, this level is clearly defined, and its proximity to the current $77.10 price creates an immediate zone of interest for short-term traders. A decisive break and hold above $77.44 would be a significant bullish signal, potentially opening the door for further upside towards the next resistance at $79.70. However, given the prevailing downtrend on the 4-hour and daily charts, a rejection from this level is more probable. Such a rejection would likely confirm the bearish bias and could lead to a retest of the immediate support levels.
Support Levels Under Scrutiny
On the downside, traders are closely watching the support structure beginning at $75.89. This level, along with $75.51 and critically $75.19, forms a support zone that could potentially halt any further decline. The fact that the daily ADX remains strong, even if slightly wavering, suggests that a significant move lower is still possible if these support levels fail. A break below $75.19, in particular, would signal a continuation of the bearish trend, potentially accelerating the decline towards lower targets. The interplay between these support levels and the current price action will be crucial in determining the short-term direction of WTI. Market participants will be looking for signs of accumulation or capitulation around these price points.
The strength of the current downtrend, as evidenced by the ADX values across different timeframes (1H: 17.48, 4H: 36.2, 1D: 23.15), presents a complex trading environment. While the 1H ADX suggests a weak trend, the 4H and 1D values indicate a more established downward movement. This discrepancy implies that the market is in a transitional phase or experiencing significant intraday volatility within a broader trend. Traders must be aware that a low ADX value on a shorter timeframe does not negate the strength indicated on longer timeframes. Conversely, a strong ADX on longer timeframes suggests that any counter-trend moves are likely to be short-lived and met with significant resistance or support, respectively.
The divergence between the 1-hour and longer-term technical signals is a key area of focus. On the 1-hour chart, indicators like the MACD and Stochastic suggest a potential bounce, supported by the RSI's position. However, the dominant bearish trends on the 4-hour and daily charts, coupled with the strong DXY, create a strong counter-narrative. This divergence highlights the importance of multi-timeframe analysis. A trader focused solely on the 1-hour chart might be tempted to initiate long positions, only to be caught in a reversal as the larger trend reasserts itself. Conversely, waiting for confirmation from longer timeframes might mean missing out on short-term gains. The prudent approach involves recognizing this divergence and trading with confirmation, perhaps waiting for a clear break of the $77.44 resistance or a decisive failure at support.
The Role of Inflation and Geopolitics
While technical indicators provide a roadmap of price action, the underlying fundamentals of supply and demand, heavily influenced by inflation expectations and geopolitical events, cannot be ignored. Recent news highlights the ongoing debate about AI's impact on electricity demand, a factor that indirectly influences the energy complex. While not directly tied to crude oil, it speaks to broader energy consumption trends. More directly relevant are the geopolitical shifts mentioned, which have historically driven gold prices higher. Though WTI's correlation with gold is not always direct, elevated geopolitical tensions often coincide with increased oil price volatility as supply disruptions become a tangible risk. The recent news about the first new oil sands project in Alberta starting production since 2014 is a supply-side development that could, in the longer term, exert downward pressure on prices, but its immediate impact is likely overshadowed by broader market sentiment and geopolitical risks.
India's sticky fuel prices, despite falling global crude, is another indicator of complex market dynamics, possibly related to domestic taxation or refining capacity issues. While this specific data point might not directly influence WTI's intraday movements, it underscores that the global energy market is not a monolithic entity. Regional factors, refining margins, and inventory levels all play a crucial role. For WTI traders, staying abreast of these macro-level developments is as important as monitoring the charts. Unexpected geopolitical escalations or significant shifts in OPEC+ policy can rapidly alter the supply-demand balance, leading to sharp price movements that technical analysis alone might not fully anticipate.
Trade Scenarios and Probabilities
Bearish Scenario: Trend Continuation
65% ProbabilityNeutral Scenario: Range-Bound Consolidation
25% ProbabilityBullish Scenario: Short-Term Reversal
10% ProbabilityThe DXY's strength at 101.05 and the presence of strong downtrends on longer timeframes introduce significant risk to any bullish positions. Traders should exercise extreme caution and ensure robust risk management practices are in place, especially if considering trades against the prevailing trend. The potential for sharp reversals remains high.
Frequently Asked Questions: WTI Analysis
What happens if WTI breaks below the $75.89 support level?
A break below $75.89 would likely trigger further downside momentum, invalidating the neutral or bullish scenarios. This would confirm the strong daily downtrend, potentially leading to a retest of the $75.51 and $75.19 support levels. It signals that the bearish sentiment is overpowering any short-term buying interest.
Should I buy WTI at current levels near $77.10 given the mixed signals?
Buying at current levels carries significant risk due to the strong downtrend indicated on the 4-hour and daily charts, despite some short-term bullish divergence. A more prudent approach would be to wait for confirmation, such as a decisive break above $77.44 resistance or a clear bullish reversal pattern forming near support levels.
Is the RSI at 63.01 on the 1H chart a buy signal for WTI Crude Oil?
An RSI of 63.01 on the 1-hour chart suggests upward momentum but is not an immediate buy signal in isolation, especially given the stronger bearish trends on longer timeframes. In a strong downtrend, RSI can remain elevated for extended periods. Confirmation from price action, like breaking resistance, is needed before considering a long position.
How will the strong DXY at 101.05 affect WTI Crude Oil's price action this week?
The strong DXY at 101.05 typically exerts downward pressure on dollar-denominated commodities like WTI. This strengthens the bearish case by making oil more expensive for holders of other currencies. Unless the DXY falters significantly, its current strength will likely act as a cap on any substantial rallies in WTI Crude Oil prices.
| Indicator | Value | Signal | Interpretation |
|---|---|---|---|
| RSI (14) | 63.01 | Neutral | Uptrend momentum on 1H, but caution needed against longer trends |
| MACD | Positive Momentum (1H) | Bullish | Short-term momentum appears positive |
| Stochastic | K=71.96, D=71.84 | Bullish | Potential upward move indicated |
| ADX | 17.48 | Weak Trend | Suggests current short-term move lacks strong directional conviction |
Track markets in real-time
AI-powered analysis, technical indicators and real-time price data.
Join Our Telegram Channel
Breaking market news, AI analysis and trading signals instantly.
Join Channel