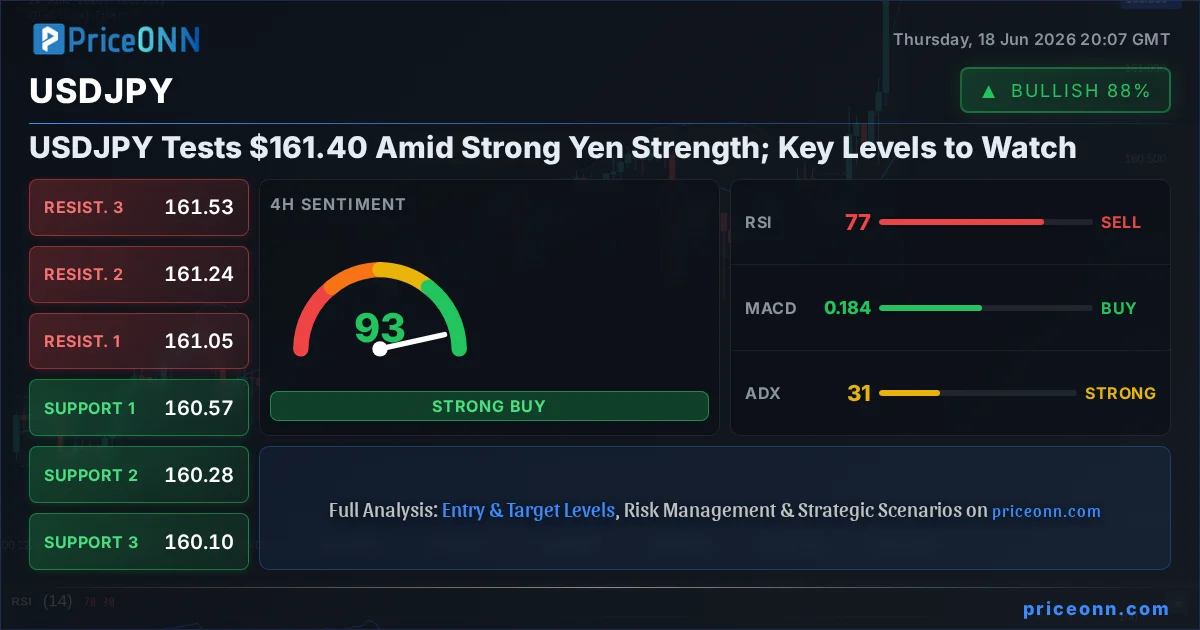
The USDJPY pair is currently navigating a critical juncture, trading precisely at $161.40. This level represents a significant point of interest as the pair finds itself amidst a robust uptrend, bolstered by a strengthening Dollar Index (DXY) now hovering around 100.88. However, the technical indicators are flashing mixed signals, suggesting a potential for consolidation or even a short-term pullback before the next significant move. Traders are closely watching whether the upward momentum can overcome the looming overbought conditions indicated by several oscillators, especially on the shorter timeframes. The interplay between the Bank of Japan's (BoJ) ultra-loose monetary policy and the Federal Reserve's (Fed) hawkish stance continues to be a dominant theme, creating volatility and opportunities for astute market participants.
- RSI at 68.45 on the 1H chart signals overbought pressure, suggesting a potential pause or pullback.
- Key support for USDJPY sits at $161.20, a level that has acted as a floor during intraday fluctuations.
- MACD histogram shows positive momentum on the 1H and 4H charts, but divergence on the daily timeframe warrants caution.
- The strong correlation with the DXY, currently at 100.88, suggests dollar strength is a primary driver for USDJPY's upward bias.
Navigating the Bullish Momentum: Technical Indicators in Focus
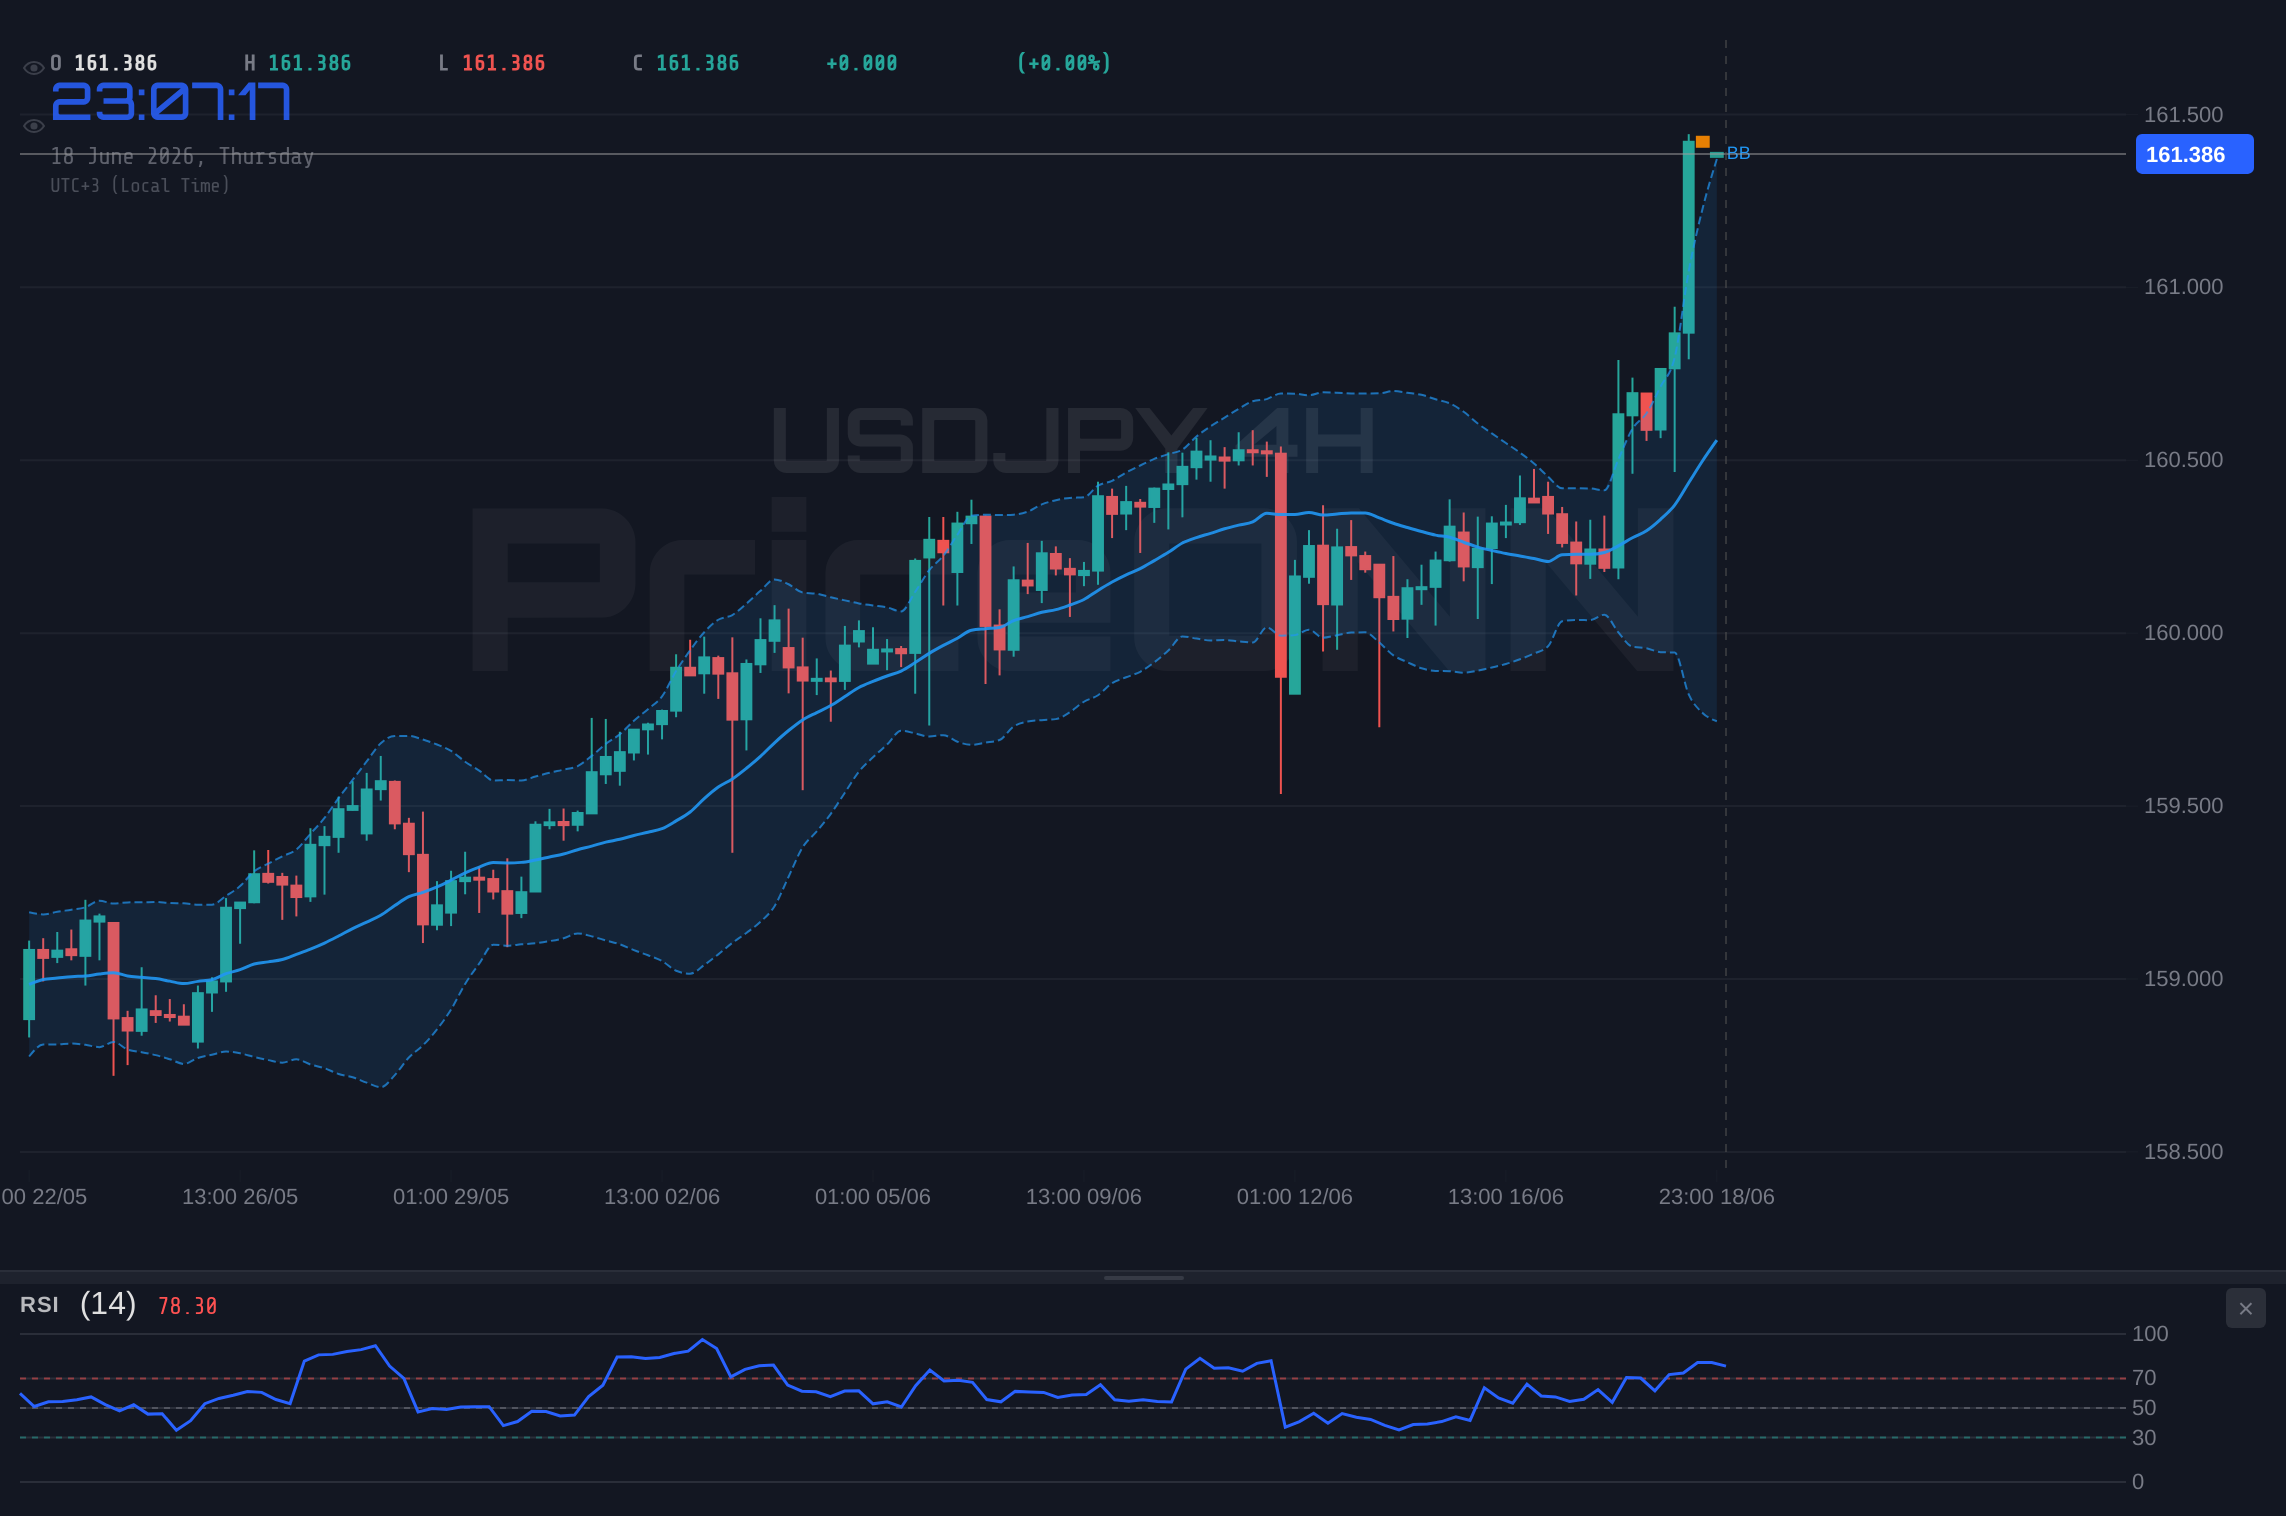
The USDJPY's ascent has been undeniable, particularly on the hourly and 4-hour charts, where a clear bullish trend is in play with an impressive strength score of 97% and 95% respectively. This upward trajectory is supported by a positive MACD momentum on both these timeframes, indicating that buyers are in control of the short-to-medium term narrative. The price action has consistently stayed above the middle Bollinger Band on the 1H chart, a classic sign of a healthy uptrend. Furthermore, the ADX indicator, reading 33.77 on the 1H and 30.59 on the 4H, confirms the presence of strong trending conditions, suggesting that the current move has significant conviction behind it. This technical picture paints a picture of a market pushing higher, with buyers showing a clear preference for the long side.
However, looking closer at the oscillators, a different story begins to unfold. On the 1-hour chart, the Relative Strength Index (RSI) stands at 68.45, teetering on the edge of the overbought territory. While not yet a definitive sell signal, it suggests that the pace of the recent rally might be unsustainable in the very short term. The Stochastic Oscillator further reinforces this caution, showing %K at 86.14 and %D at 91.6 on the 1H chart, indicating that the pair is in the extreme overbought zone and ripe for a potential reversal or consolidation. This divergence between the strong trend indicators (MACD, ADX) and the overbought oscillators (RSI, Stochastic) is precisely where traders need to exercise the most diligence. It signals a potential battle between the bulls who are driving the trend and the bears looking to capitalize on stretched conditions.
The daily chart, while still showing a dominant bullish trend (97% strength), presents a more nuanced view. The RSI here is at 69.92, again nearing the overbought threshold, and the Stochastic Oscillator is also in the upper echelons, with %K at 83.3 and %D at 75.43. The ADX on the daily timeframe, however, is notably lower at 13.54, indicating a weaker trend strength over the longer term, suggesting that the current strong move might be more of a short-term surge rather than a sustained long-term trend shift. This is a crucial point for traders to consider; the daily picture suggests that while the immediate pressure is upwards, the underlying trend strength over weeks and months is not as robust, implying that any significant pullback could gain traction.
Correlation Analysis: DXY's Dominance and Equity Market Ripples
The strength of the USDJPY pair is inextricably linked to the performance of the US Dollar Index (DXY). With the DXY currently trading at 100.88, showing a significant daily gain of 0.45%, its upward momentum is a key driver behind the yen's weakness against the dollar. A rising DXY typically exerts downward pressure on gold and other major currency pairs, and USDJPY is no exception. The strength in the dollar is often interpreted as a sign of global risk aversion or expectations of tighter monetary policy from the Federal Reserve, both of which can support USDJPY. The fact that the DXY is showing strong uptrend signals across multiple timeframes, with its own RSI in the overbought zone (71.35 on 1H, 75.27 on 4H, 71.43 on 1D), suggests that dollar strength might persist, providing a supportive backdrop for USDJPY.
The equity markets, particularly the S&P 500 and Nasdaq 100, offer a contrasting perspective. While the S&P 500 is showing a mixed picture with a strong hourly uptrend but a bearish daily trend, the Nasdaq 100 exhibits a more consistent bullish bias across timeframes. This divergence within the equity markets could signal underlying uncertainty. Typically, a strong risk-on sentiment, indicated by rising equity indices, would align with a weaker yen, thus supporting USDJPY. However, the current environment is complex. The recent news about the AI spending boom and depreciation time bombs, alongside mixed UK jobs data, adds layers of complexity. While the Nasdaq's strength is positive, the S&P 500's daily bearish trend suggests that broader market sentiment might not be uniformly bullish, which could indirectly temper USDJPY's upside potential if risk-off sentiment were to intensify.
The correlation between USDJPY and oil prices also warrants attention, though it's less direct. Brent crude is trading at $79.75, showing a recent upward move, while WTI is at $76.55. Historically, rising oil prices can signal inflationary pressures, which might prompt central banks like the Fed to adopt a more hawkish stance, thereby strengthening the dollar and supporting USDJPY. However, the current oil market dynamics are complex, with supply-side factors and demand concerns playing a significant role. While oil's upward push could be a tailwind for USDJPY via inflation expectations, the broader commodity markets are not exhibiting a clear, unified bullish signal that would strongly support this narrative. Therefore, the primary driver for USDJPY remains the dollar's own strength, amplified by Fed policy expectations.
Key Levels and Potential Trading Scenarios
From a technical standpoint, the immediate price action around $161.40 is crucial. On the hourly chart, the first resistance level is identified at $161.766, followed by $161.862 and $162.047. A sustained break above these levels would indicate continued bullish momentum. Conversely, the immediate support is found at $161.485, then $161.300, and further down at $161.204. These support levels are vital for the bulls to defend if they wish to maintain control. The daily chart shows more significant support at $160.231 and resistance at $160.912, suggesting that the current hourly resistance might be a short-term hurdle rather than a major long-term barrier.
The narrative of strong uptrend signals on shorter timeframes clashing with overbought conditions and weaker daily trend strength creates a complex trading environment. This is precisely where scenario planning becomes indispensable. The market appears to be at a crossroads, with the potential for either a continuation of the bullish trend, a period of consolidation as oscillators reset, or a more significant pullback if key support levels fail.
Bearish Scenario: Yen Strength Resumes
65% ProbabilityNeutral Scenario: Consolidation Around $161.40
25% ProbabilityBullish Scenario: Trend Continuation
10% ProbabilityThe Path Forward: What Traders Should Watch
For traders operating on shorter timeframes, the immediate focus will be on the $161.40 level itself. A failure to hold this price could signal the start of a correction, especially if the hourly RSI continues to push higher while price struggles. The key levels of $161.20 and $161.485 will be critical intraday support and resistance points. A decisive break below $161.20 would likely trigger stop-loss orders and open the door for a move towards the daily support at $160.912. On the other hand, if the bulls manage to push USDJPY above the hourly resistance at $161.77, it would suggest that the overbought conditions are being ignored in favor of the strong trend, potentially paving the way for a test of higher levels.
The longer-term picture remains somewhat clouded by the weaker ADX on the daily chart and the approaching overbought thresholds on the RSI. This suggests that while immediate upside might be possible, the sustainability of such moves could be questionable without further fundamental catalysts or a reset in oscillator readings. The market is currently pricing in a specific set of Fed expectations, and any deviation from these, whether through inflation data or Fed commentary, could significantly impact the DXY and, consequently, USDJPY. Traders should remain vigilant for any news that could shift these expectations.
Given the strong trend signals on the 1H and 4H charts, coupled with the DXY's upward trajectory, a short-term continuation of the bullish move is plausible. However, the overbought readings on the RSI and Stochastic oscillators, particularly on the 1H and 4H, present a significant risk of a pullback. The 65% probability assigned to the bearish scenario reflects this caution, emphasizing that a failure to hold current levels could lead to a swift retracement. The neutral scenario, representing consolidation around the current price, accounts for the conflicting signals, suggesting that the market might take a breather before committing to a new direction. The low probability for the bullish scenario underscores the risk associated with chasing a trend that is showing signs of exhaustion.
Ultimately, the USDJPY pair is at a critical juncture where short-term overbought conditions are battling against a strong prevailing trend, heavily influenced by dollar strength. The $161.40 level acts as a pivot point. A failure to hold this level could initiate a corrective move, while a decisive break of near-term resistance might extend the rally, albeit with increasing risk. Prudent risk management, focusing on the clearly defined support and resistance levels, will be paramount for navigating this complex market environment. The market is giving us a clear battleground; the question is which side will ultimately prevail.
Frequently Asked Questions: USDJPY Analysis
What happens if USDJPY breaks below the $161.20 support level?
If USDJPY closes decisively below the $161.20 support, it would likely trigger stop-loss orders, potentially accelerating a move towards the next significant support at $160.912. This scenario is assigned a 65% probability due to current overbought conditions on shorter timeframes.
Should I buy USDJPY at current levels of $161.40 given the RSI is at 68.45?
Buying at current levels of $161.40 with an RSI of 68.45 carries risk, as it's nearing overbought territory. The bullish scenario has only a 10% probability. A more prudent approach might be to wait for a pullback towards support levels like $161.20 or confirmation of a breakout above $161.77.
Is the RSI at 68.45 a sell signal for USDJPY right now?
An RSI of 68.45 is not a definitive sell signal on its own, but it does indicate that the pair is approaching overbought conditions, especially on the 1-hour chart. This suggests that the upward momentum may be weakening, increasing the potential for a consolidation or a minor pullback rather than an immediate reversal.
How will the DXY's strength at 100.88 affect USDJPY this week?
The DXY's strength at 100.88 provides a supportive backdrop for USDJPY, as the pair typically exhibits a positive correlation with the dollar index. If the DXY continues its upward trend, it could fuel further gains in USDJPY, although potential overbought conditions on both instruments warrant cautious optimism.
| Indicator | Value | Signal | Interpretation |
|---|---|---|---|
| RSI (14) | 69.92 | Neutral | Approaching overbought territory on daily chart |
| MACD Histogram | +0.769 | Bullish | Positive momentum, above signal line |
| Stochastic | K:83.3, D:75.43 | Bullish | In overbought zone, but %K > %D |
| ADX | 13.54 | Neutral | Weak trend strength on daily chart |
| Bollinger | Upper Band | Watch | Price holding above middle band on daily |
Track markets in real-time
AI-powered analysis, technical indicators and real-time price data.
Join Our Telegram Channel
Breaking market news, AI analysis and trading signals instantly.
Join Channel