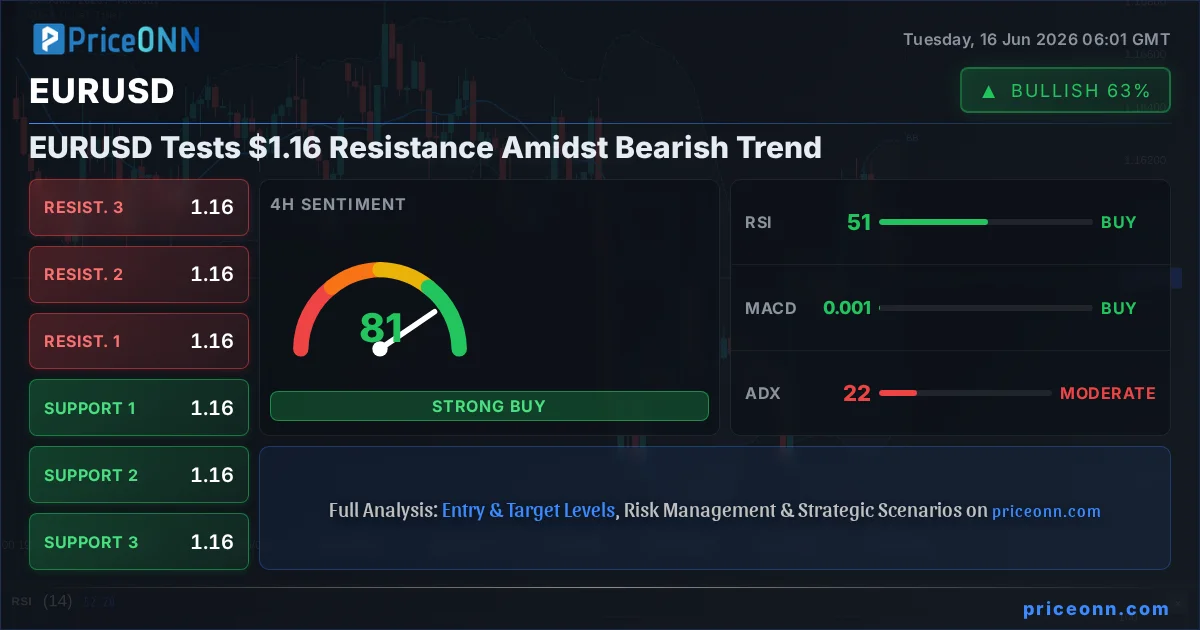
EURUSD is currently trading at $1.16, a critical juncture where the pair is testing resistance levels that have previously capped upside momentum. The prevailing bearish trend, particularly evident on the daily chart, suggests that any upside moves may be short-lived unless significant buying pressure emerges. This analysis delves into the intricate technical landscape, examining indicator readings, key price levels, and potential scenarios to decipher the immediate future for the Euro/Dollar pair. With a weak trend indicated by the ADX on the 1-hour chart but a stronger trend on the 4-hour and daily timeframes, the market is at a crossroads, demanding a close look at the confluence of signals.
- RSI at 36.19 on the 1H chart indicates bearish momentum, while the 4H RSI at 50.61 suggests neutrality.
- Key support for EURUSD is identified at $1.15733, with resistance found at $1.15848 on the 1H timeframe.
- The ADX at 16.7 on the 1H chart points to a weak trend, contrasting with stronger trend signals on higher timeframes.
- Market sentiment is cautious, with the DXY strengthening to 99.84, potentially pressuring EURUSD.
The EURUSD pair finds itself at a pivotal moment, hovering around the $1.16 mark. This level is not just a psychological barrier but also a significant resistance point on the 1-hour chart, as indicated by the data. The immediate 1-hour technicals paint a picture of caution, with an RSI reading of 36.19 signaling a bearish inclination, and the MACD histogram firmly in negative territory, suggesting that sellers are currently in command. The Stochastic oscillator also provides a bearish signal, with %K below %D. However, the ADX at 16.7 indicates a weak overall trend on this timeframe, hinting at potential consolidation or a lack of conviction from either bulls or bears.
Digging deeper into the 4-hour timeframe, a more neutral stance emerges, though with underlying bullish undertones. The RSI at 50.61 sits squarely in the neutral zone, indicating a balance between buying and selling pressure. The MACD, in contrast to the 1-hour chart, shows positive momentum, with the histogram above the signal line. This divergence between the shorter and medium-term timeframes is crucial; it suggests that while the immediate pressure might be bearish, the broader sentiment over a few hours is less committed. The Stochastic oscillator, however, presents a bearish signal here too, with %K falling below %D, and the ADX at 21.55 indicates a moderate upward trend, adding to the complexity of the current picture.
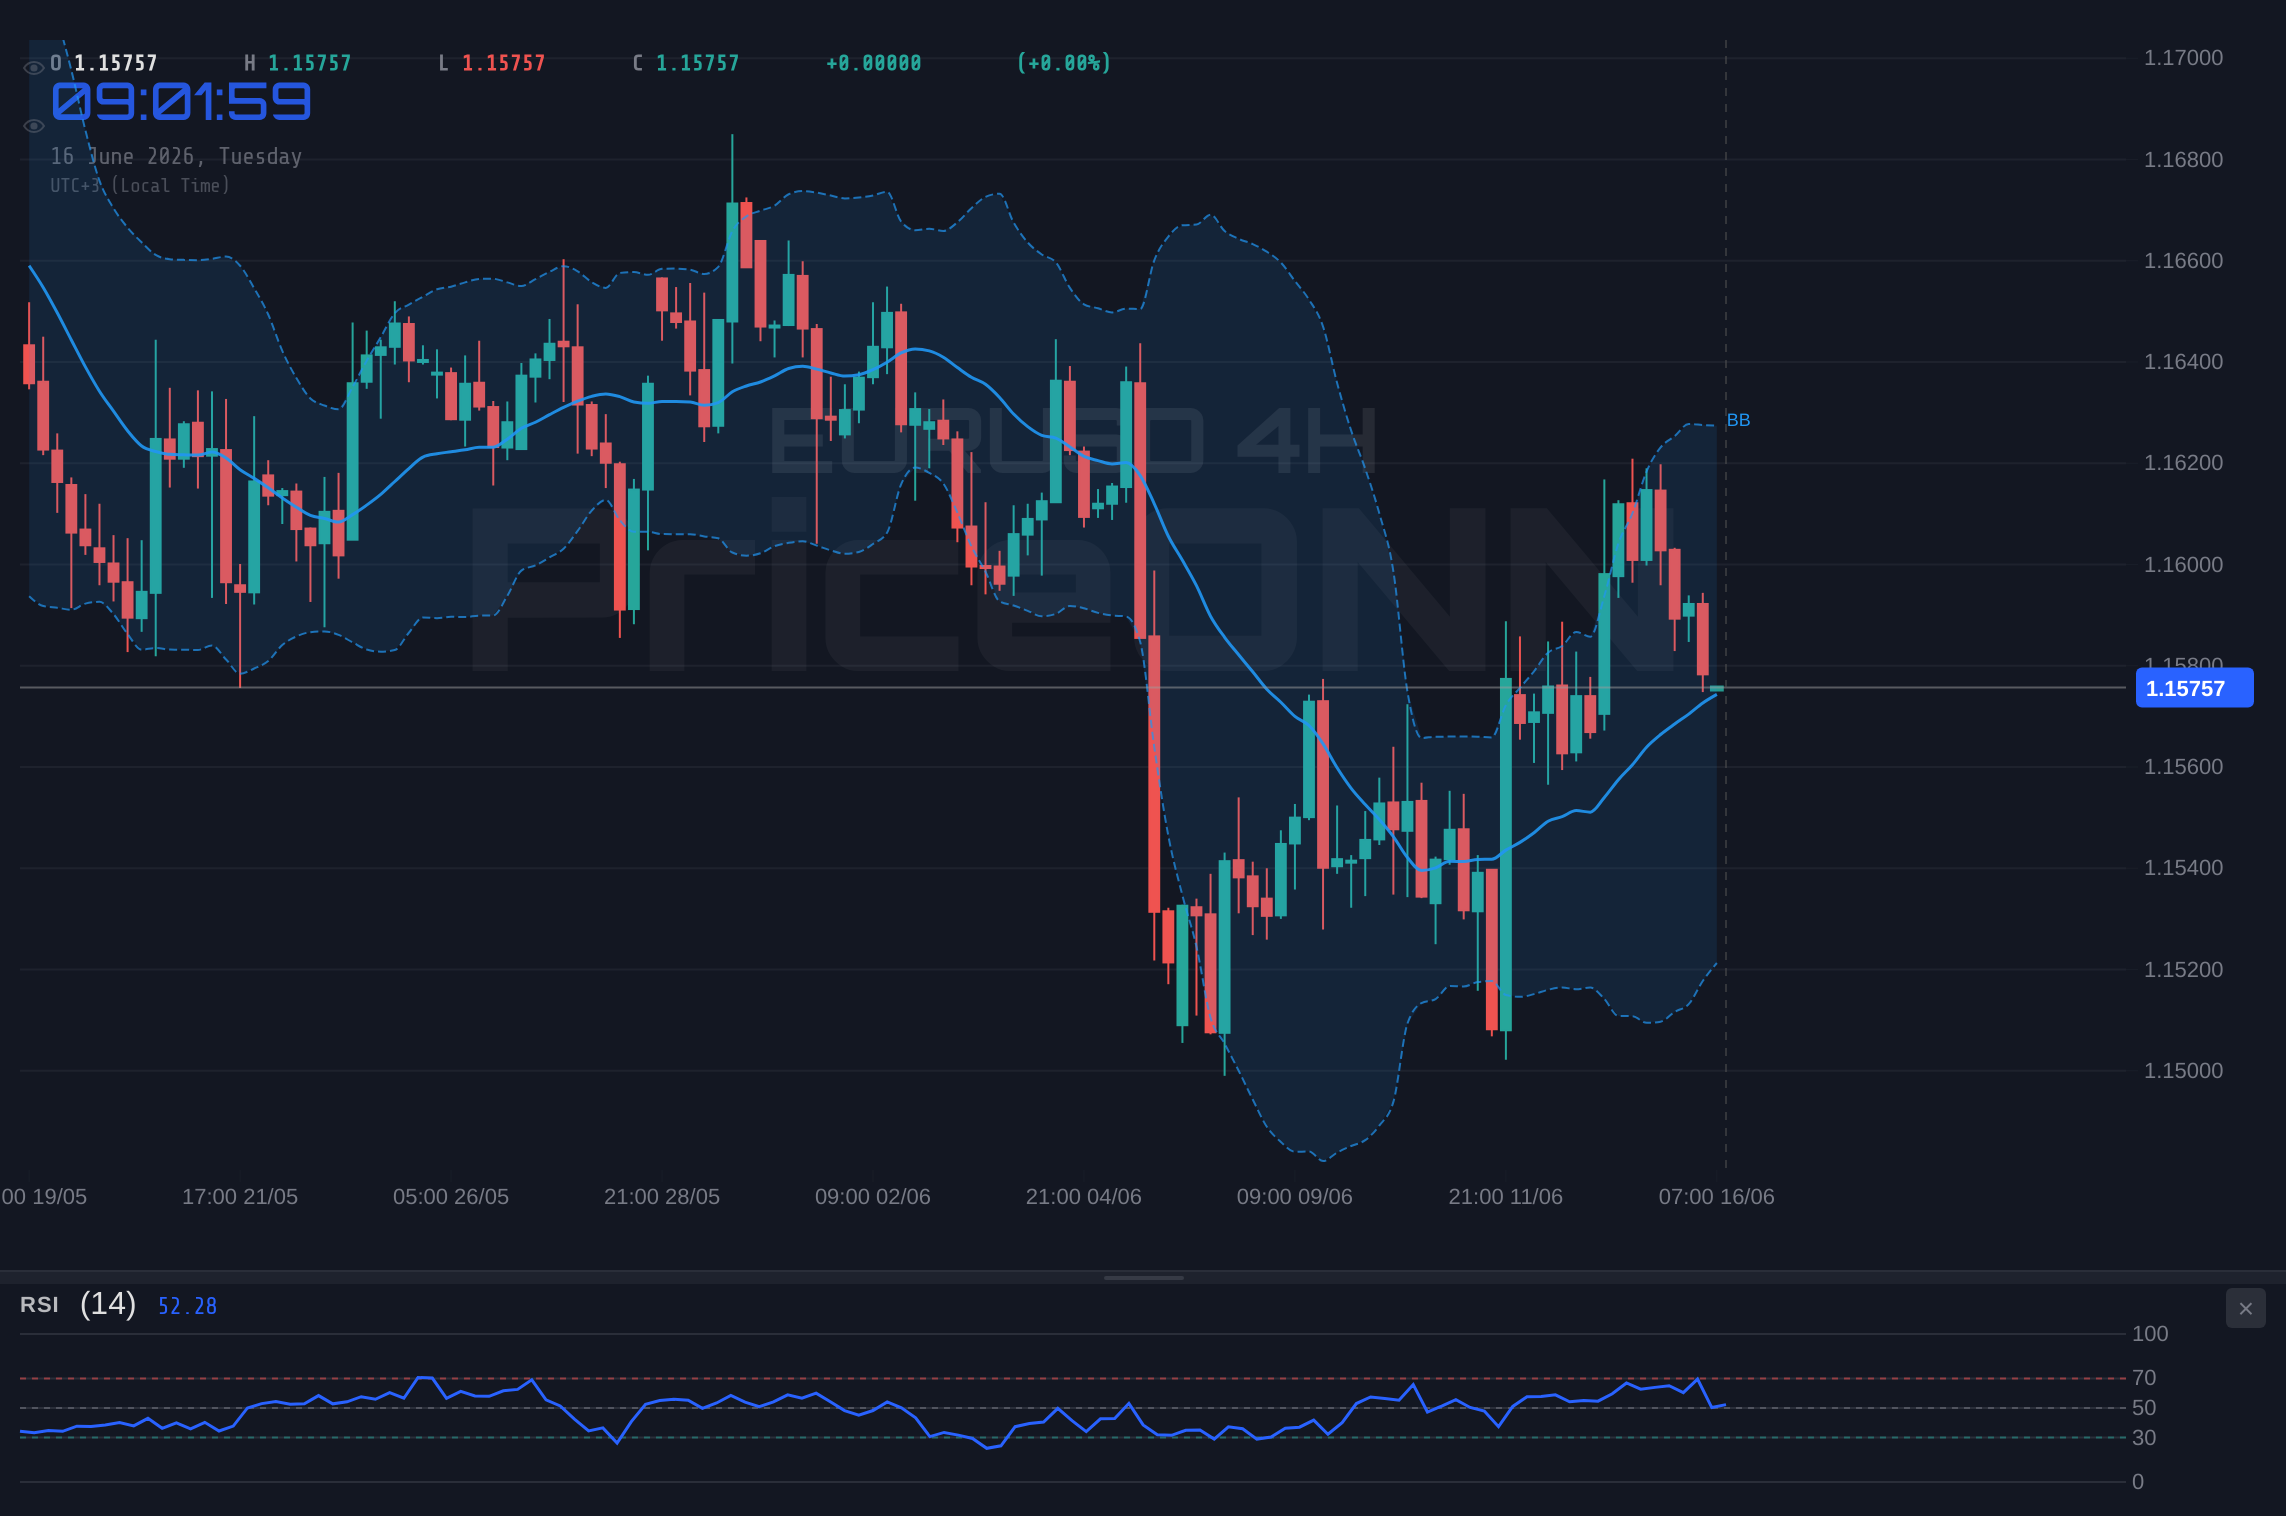
On the daily chart, the bearish trend for EURUSD remains the dominant narrative. The RSI at 46.38, while in the neutral zone, leans towards a bearish bias, and the MACD continues to show negative momentum below its signal line. The Bollinger Bands are also situated below the middle band, reinforcing the bearish sentiment. Despite these signals, the Stochastic oscillator offers a glimmer of hope for the bulls, showing a rising %K above %D, suggesting a potential for an upward move. The ADX on the daily chart stands at 20.37, confirming a moderate downward trend. This conflicting array of signals across different timeframes underscores the current indecision and the importance of watching key price action developments.
The strength of the US Dollar, as reflected by the DXY index currently at 99.84, plays a crucial role in the EURUSD equation. A rising DXY typically exerts downward pressure on currency pairs like EURUSD. The DXY's own technicals show a mixed picture: while the 1-hour and 4-hour charts suggest bullish momentum and an overbought condition on the Stochastic, the daily chart presents a more neutral outlook with positive MACD momentum. This indicates that the dollar's upward push might be facing headwinds, which could offer some respite to the Euro, but the overall trend favors a stronger dollar, adding another layer of complexity for EURUSD traders.
Considering the technical indicators, the picture for EURUSD is far from clear-cut. On the 1-hour chart, the prevailing signals lean bearish, with RSI at 36.19 and MACD in negative territory. However, the weak ADX (16.7) suggests this bearish momentum might lack conviction. The 4-hour chart offers a more neutral to slightly bullish perspective, with RSI at 50.61 and positive MACD momentum, though a bearish Stochastic signal and a moderate ADX of 21.55 temper this optimism. The daily chart firmly reasserts the bearish trend, with RSI at 46.38 and negative MACD, but a bullish Stochastic signal adds a conflicting element. This interplay of indicators across timeframes highlights the need for traders to exercise caution and await clearer directional cues.
From a price action perspective, the levels provided are paramount. On the 1-hour chart, immediate support is found at $4318.24, followed by $4314.16 and $4307.29. Resistance looms at $4329.19, $4336.06, and $4340.14. For EURUSD, the critical support levels to watch are $1.15733, $1.15683, and $1.15618. On the resistance side, the pair faces hurdles at $1.15848, $1.15913, and $1.15963. A decisive break above these resistance levels, particularly $1.15963, would be needed to challenge the broader bearish sentiment. Conversely, a fall below the $1.15618 support could accelerate selling pressure.
The prevailing market sentiment, influenced by broader macroeconomic factors and geopolitical developments, also plays a significant role. Recent news indicates a potential risk-on environment triggered by a surprise US-Iran interim agreement, which could theoretically weaken safe-haven currencies like the dollar and support pairs like EURUSD. However, the DXY's current strength at 99.84 suggests this risk-on sentiment may not be fully translating into weakness for the dollar. Furthermore, Eurozone trade balances slipping into deficit in April, as reported, could add underlying pressure to the Euro, creating a complex fundamental backdrop for EURUSD.
The interplay between the US Dollar Index (DXY) and EURUSD is a constant theme. With the DXY currently at 99.84, showing strength on shorter timeframes but facing resistance on the daily, its influence on EURUSD is nuanced. A DXY that breaks above its daily resistance could signal further dollar strength, putting significant pressure on EURUSD and potentially pushing it towards lower support levels. Conversely, if the DXY falters at its resistance, it could provide a reprieve for EURUSD, allowing it to test higher resistance levels, although the dominant daily bearish trend would still be a significant factor.
For traders, the current setup presents a classic dilemma: a bearish daily trend versus mixed signals on shorter timeframes and conflicting indicator readings. The confluence of a strong dollar, a bearish daily trend for EURUSD, and the key resistance levels around $1.1585-$1.1605 demands a cautious approach. While a bounce from oversold conditions on the 1-hour Stochastic is possible, the overall trend bias remains bearish. Confirmation of any upside move would require a clear break above daily resistance, supported by improving risk appetite and a weakening DXY. Until then, downside risks appear to be more pronounced.
Bearish Scenario: Trend Continuation
65% ProbabilityNeutral Scenario: Consolidation Around $1.16
25% ProbabilityBullish Scenario: Short-Term Reversal
10% ProbabilityFrequently Asked Questions: EURUSD Analysis
What happens if EURUSD breaks below the $1.15618 support level?
A break below $1.15618 on the 1H chart would likely accelerate selling pressure, potentially targeting the next daily support at $1.15527. This scenario is part of the bearish outlook with a 65% probability.
Should I consider buying EURUSD at current levels of $1.16 given the bearish trend?
Buying at $1.16 is a high-risk move given the prevailing bearish trend and resistance at $1.15848-$1.15963. A bullish scenario requires a clear break above these levels with strong conviction, carrying only a 10% probability currently.
Is the RSI at 36.19 on the 1H chart a sell signal for EURUSD?
An RSI of 36.19 on the 1-hour chart does indicate bearish momentum, aligning with the short-term bearish outlook. However, the weak ADX of 16.7 suggests this momentum may lack conviction, making it a signal to watch rather than act upon in isolation.
How will the strengthening DXY at 99.84 affect EURUSD this week?
A stronger DXY at 99.84 typically pressures EURUSD. If the DXY breaks its daily resistance, it could exacerbate the bearish trend for EURUSD, pushing it towards lower support levels. Conversely, DXY weakness would offer some relief.
Track markets in real-time
AI-powered analysis, technical indicators and real-time price data.
Join Our Telegram Channel
Breaking market news, AI analysis and trading signals instantly.
Join Channel