AUD/USD is currently hovering around the critical $0.70705 mark, a level that's proving to be a significant hurdle for bullish momentum. As traders digest the latest market data and anticipate crucial inflation reports, the Australian dollar finds itself at a crossroads against its US counterpart. This analysis delves into the intricate technical landscape, exploring the probabilities of various market scenarios and what to watch for in the coming days.
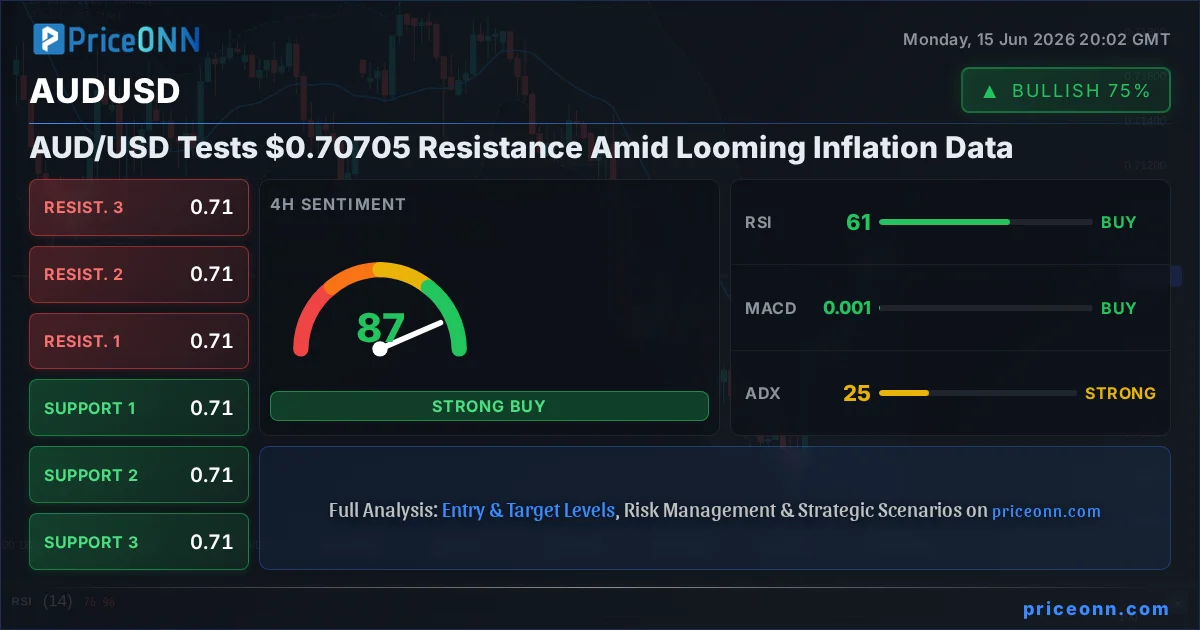
- AUD/USD faces resistance at the $0.70705 level, with the 4H chart showing a potential shift from consolidation.
- The RSI at 61.07 on the daily chart indicates bullish momentum, but caution is advised as it's not yet in overbought territory.
- Key support for AUD/USD lies at $0.70644, while resistance is capped around $0.70766.
- Upcoming inflation data releases are critical catalysts that could drive significant volatility for AUD/USD.
The Australian dollar has shown resilience, but the $0.70705 price point is currently acting as a formidable ceiling. On the 1-hour chart, the picture is decidedly mixed, with a neutral signal from the 4-4-4 (Buy-Sell-Neutral) indicator breakdown. This suggests a lack of conviction from short-term traders, a sentiment echoed by the RSI sitting squarely in neutral territory at 51.71. However, the ADX at 28.25 points to a strong underlying trend, indicating that any move, once initiated, could be significant. This conflicting data set paints a picture of consolidation, where the market is waiting for a clear catalyst to break the current stalemate.
Diving deeper into the technicals, the 1-hour Stochastic oscillator is flashing a bearish signal with %K at 40.86 and %D at 59.22, suggesting a potential pullback from current levels. This aligns with the MACD, which is showing negative momentum with the MACD line below its signal line. The Bollinger Bands on the 1-hour chart are also hinting at caution, with the price trading below the middle band, often a precursor to further downside if not immediately reclaimed. This short-term outlook suggests that while the overall trend might be building, immediate pressure could be to the downside, testing the $0.70662 support level.
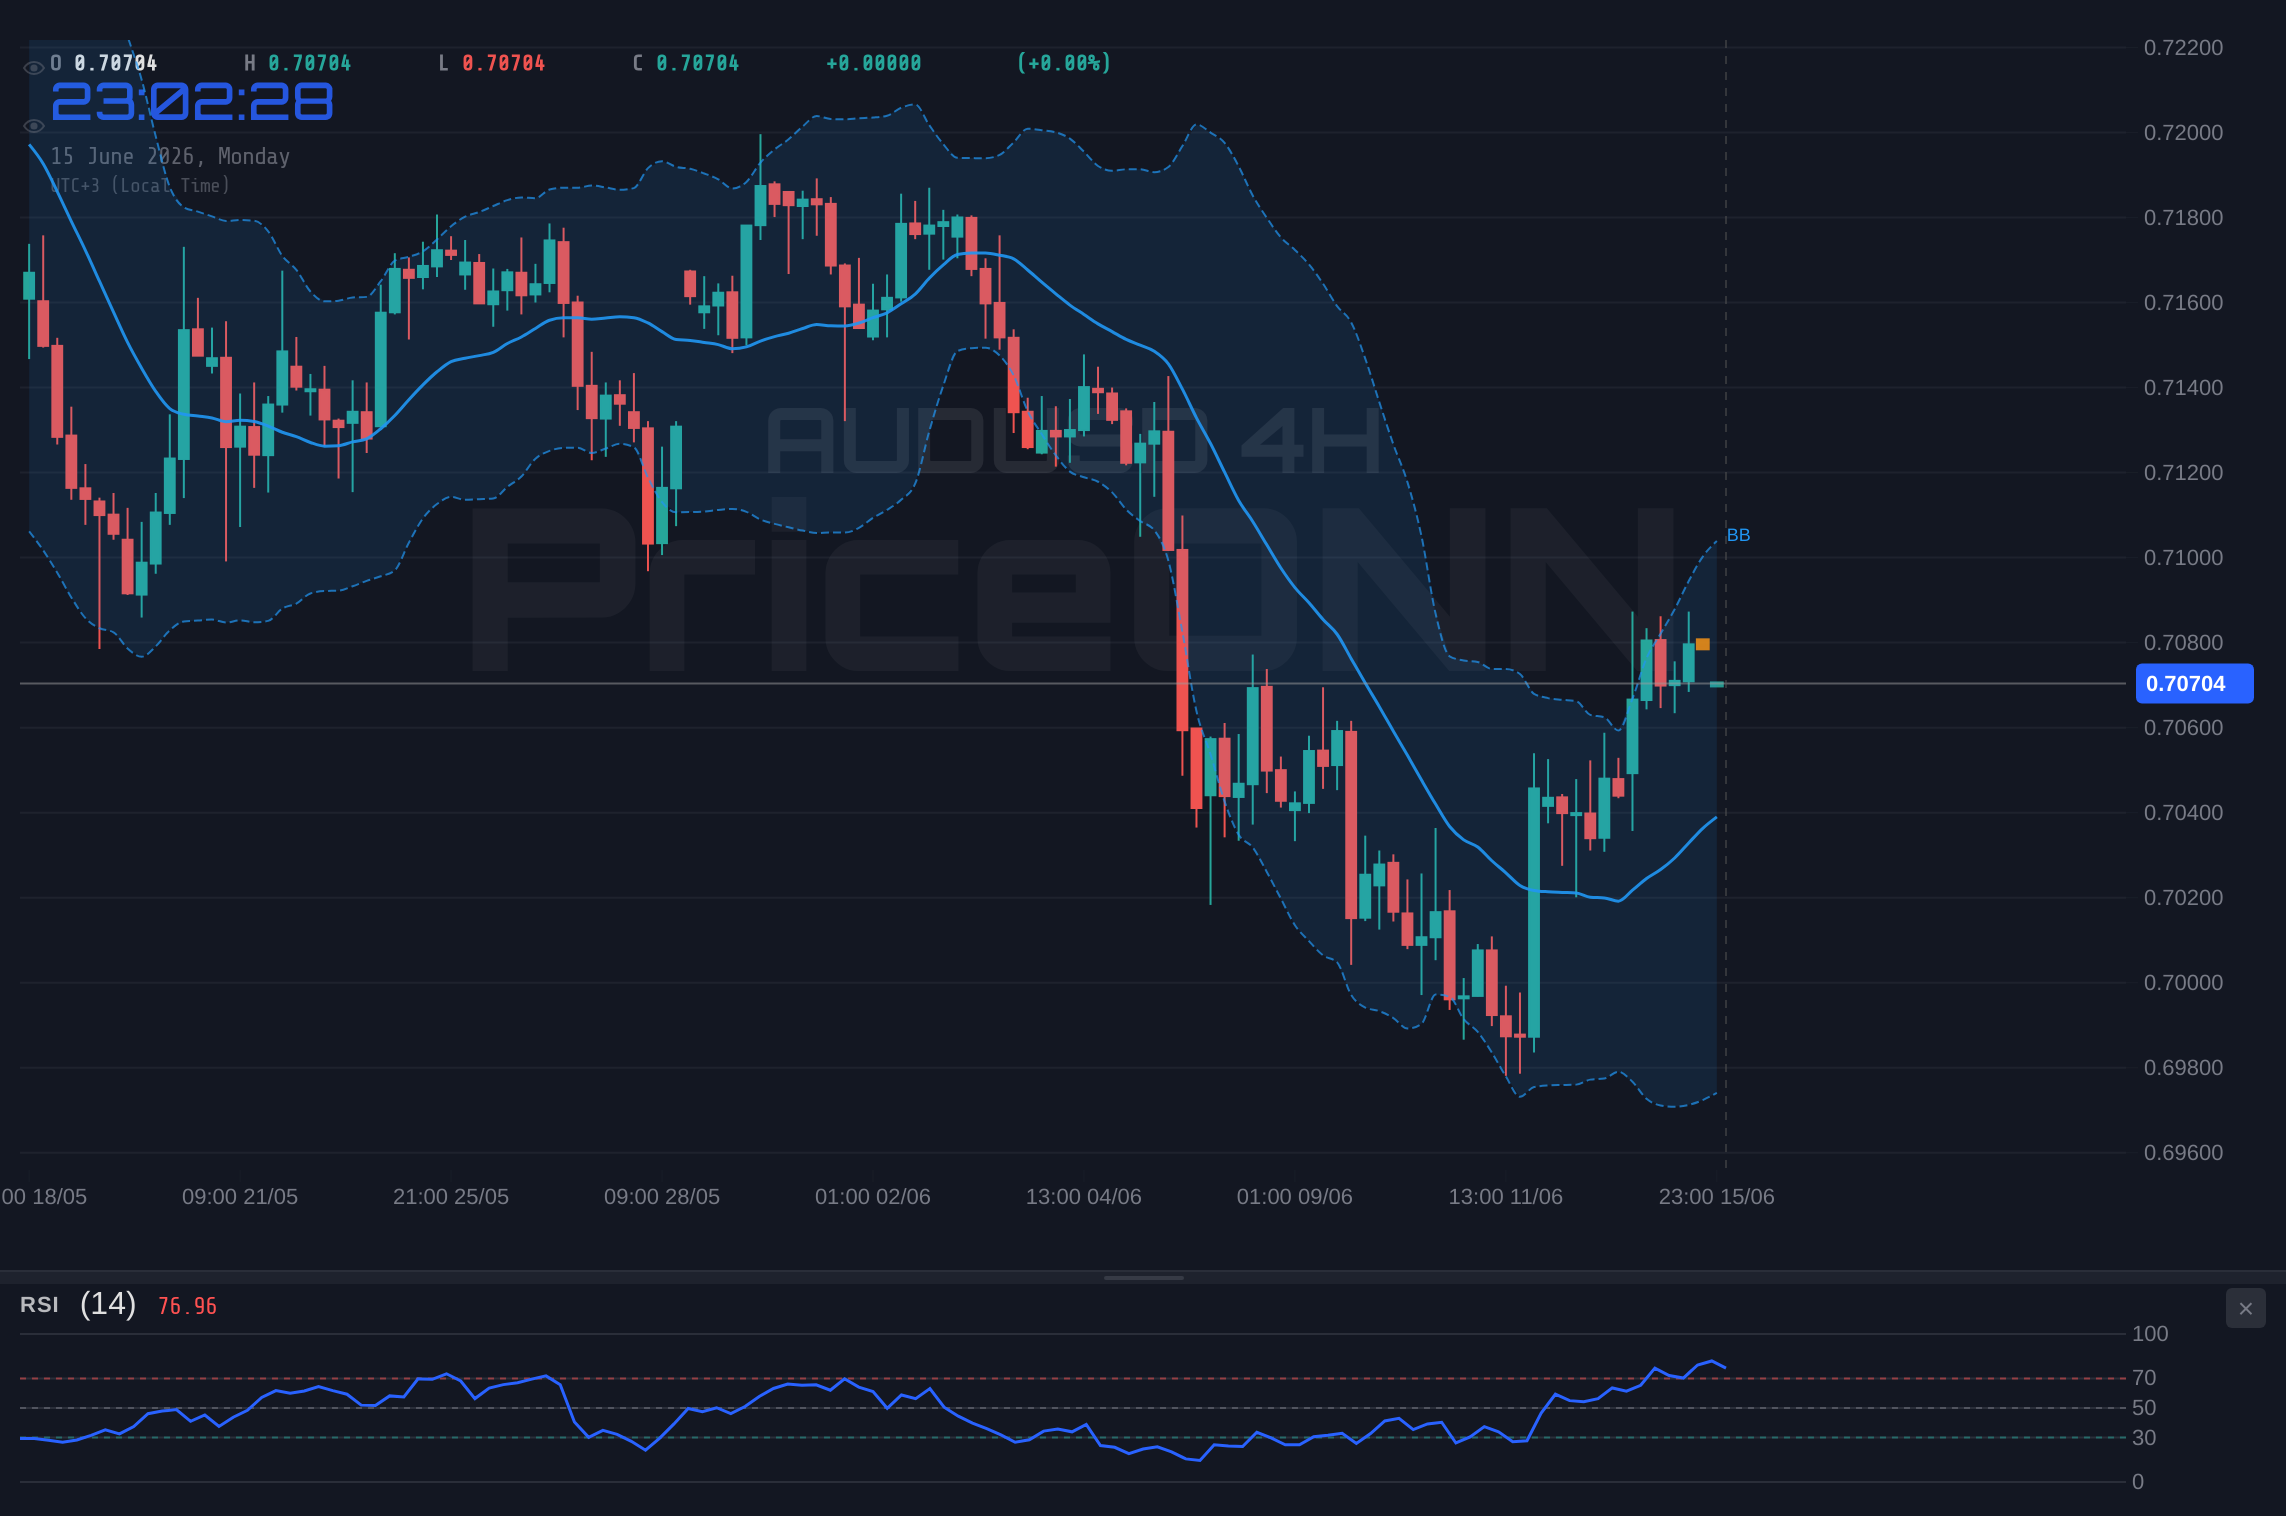
However, the 4-hour timeframe presents a more optimistic, albeit still cautious, view for AUD/USD. The RSI here is comfortably at 61.07, indicating a healthy bullish bias without being excessively overbought. The MACD is showing positive momentum, with the MACD line above its signal line, and the price is currently trading above the middle Bollinger Band, signalling a bullish inclination. The ADX at 25.4 reinforces the idea of a strengthening trend. The Stochastic oscillator, while showing %K at 79.46 and %D at 82.08, is nearing overbought territory but still presents room for upward movement. This timeframe suggests that the bulls are indeed in play, aiming to push past the $0.70766 resistance.
The daily chart for AUD/USD offers a more complex narrative. The overall trend is marked as 'Düşüş' (Downtrend) with 99% power, yet the RSI at 41.22 is in the neutral zone, showing a slight downward inclination but far from oversold conditions. The MACD is in negative territory, but the Stochastic oscillator is showing a bullish signal with %K (21.59) above %D (15.47), suggesting a potential upward reversal from current lows. The ADX, however, at 28.59, indicates a strong trend, which on this timeframe, is still predominantly downwards. This daily perspective highlights the pair's struggle against a prevailing downtrend, making any upward moves potentially corrective rather than a full trend reversal.
The interplay between the US Dollar Index (DXY) and AUD/USD is crucial here. With the DXY currently at 99.75 and showing a daily uptrend, it typically exerts downward pressure on AUD/USD, given their historical inverse correlation. A stronger dollar often makes Australian dollar-denominated assets less attractive to foreign investors. The fact that AUD/USD is showing any signs of life against a strengthening dollar is a testament to the Aussie's own underlying strength or specific market drivers. Traders must closely monitor the DXY's trajectory; a sustained move above 100.36 would undoubtedly add significant headwinds for AUD/USD.
Furthermore, the broader market sentiment, influenced by global risk appetite, plays a pivotal role. The Nasdaq 100, currently showing a strong daily uptrend at 30552.02, and the S&P 500 at 6572.87, suggest a generally positive risk environment. This risk-on sentiment typically benefits risk-sensitive currencies like the Australian dollar. Recent news reports mentioning a 'Risk-On “Taco” Redux' and a potential US-Iran interim agreement that triggered a rally in risk assets like the Nasdaq 100, support the notion that global sentiment could be a tailwind for AUD/USD, provided it doesn't face overwhelming dollar strength.
However, the looming economic calendar is perhaps the most significant factor for AUD/USD in the immediate future. The lack of specific high-impact economic data releases for the Euro and Pound today might shift focus. The absence of direct Australian economic data in the provided snippet means that global macro trends and US data will likely dictate AUD/USD's immediate path. Any surprises in US inflation data, which are typically high-impact events, could trigger substantial volatility. A hotter-than-expected inflation reading could bolster the Federal Reserve's hawkish stance, strengthening the USD and pressuring AUD/USD. Conversely, cooler inflation might lead to expectations of earlier rate cuts, potentially weakening the USD and providing a lift to AUD/USD.
The Bull's Roadmap: Breaking the $0.70705 Ceiling
For the bulls to gain firm control, AUD/USD must decisively break and hold above the immediate resistance at $0.70766. This level, closely watched on the 4-hour chart, represents the immediate ceiling. A sustained move above this point, ideally accompanied by increasing volume and positive momentum across multiple timeframes, would signal a potential continuation towards the next resistance at $0.70822. The overall bullish scenario hinges on maintaining strength above the $0.70644 support level, preventing a bearish invalidation. If AUD/USD can clear $0.70766, the path towards $0.70888 could open up, especially if global risk sentiment remains elevated and the DXY falters.
Where Bears Take Control: Testing the $0.70644 Support
Conversely, a bearish outlook would be confirmed if AUD/USD fails to sustain its position above the $0.70644 support level on the 4-hour chart. A break below this crucial floor, particularly on significant volume, would likely trigger stop-loss orders and accelerate downward momentum. The 1-hour chart's bearish signals, including the RSI's downward trend and the Stochastic's bearish crossover, would then be validated. If the bears manage to reclaim control, the next logical downside target would be the $0.70578 support. A decisive close below $0.70522 would further solidify the bearish case, potentially signaling a return to lower levels seen earlier in the daily downtrend.
The Waiting Game: Consolidation Around $0.70705
Given the conflicting signals across different timeframes and the anticipation of key economic data, a period of consolidation around the $0.70705 level is a plausible scenario. In this range-bound environment, AUD/USD might oscillate between the $0.70644 support and the $0.70766 resistance. This indecisive trading could persist until a clear catalyst emerges from inflation reports or significant shifts in global risk sentiment. During such consolidation, traders might look for scalping opportunities within the range or await a decisive breakout before committing to larger positions. The neutral ADX on the 1-hour chart supports this view of range-bound trading.
Bullish Scenario: Breaking Resistance
65% ProbabilityBearish Scenario: Support Breakdown
25% ProbabilityNeutral Scenario: Range-Bound Action
10% Probability| Indicator | Value | Signal | Interpretation |
|---|---|---|---|
| RSI (14) | 61.07 | Bullish | Healthy bullish momentum, but not overbought yet. |
| MACD Histogram | 0.0025 | Positive | Momentum favors bulls on the 4H chart. |
| Stochastic | K:79.46 D:82.08 | Bearish Crossover | Nearing overbought, possible pullback ahead. |
| ADX | 25.4 | Strong Trend | Trend strength is supportive of directional moves. |
| Bollinger Bands | Middle Band | Above | Price above middle band suggests upward pressure. |
The path forward for AUD/USD is heavily influenced by its ability to overcome the immediate resistance at $0.70705 and the broader macroeconomic narrative. While the technical indicators on the 4-hour chart paint a cautiously optimistic picture, the daily trend remains a significant headwind. The critical support at $0.70644 must hold to keep the bullish scenario alive. A break below this level could signal a deeper correction, especially if the DXY continues its ascent and US inflation data comes in hotter than expected.
What I'm watching closely this week are two key levels: the $0.70766 resistance and the $0.70644 support. A decisive move above the former, confirmed by strong volume and positive momentum across timeframes, would open the door for a test of $0.70822 and potentially $0.70888. Conversely, a failure to hold $0.70644 could see AUD/USD revisit $0.70578, with $0.70522 as a secondary target. The upcoming inflation data will be the ultimate catalyst, potentially breaking the current stalemate and dictating the direction for the rest of the week. Traders should remain vigilant, manage risk tightly, and wait for clear confirmation before entering positions.
Frequently Asked Questions: AUDUSD Analysis
What happens if AUD/USD breaks above the $0.70766 resistance level?
A sustained break above $0.70766 on the 4-hour chart, supported by increased volume, would invalidate the bearish scenario and target $0.70822, with a secondary objective at $0.70888. This would signal continued bullish momentum driven by risk appetite.
Should I consider buying AUD/USD at current levels around $0.70705 given the neutral signals?
Buying at current levels carries risk due to the strong resistance at $0.70705 and conflicting signals. A more prudent approach would be to wait for a confirmed break above $0.70766 or a dip to test support near $0.70644, with clear confirmation signals.
Is the RSI at 61.07 a strong buy signal for AUD/USD right now?
An RSI of 61.07 on the 4-hour chart indicates bullish momentum but is not yet in overbought territory (typically above 70). While positive, it needs confirmation from other indicators and price action to be considered a strong buy signal, especially with resistance nearby.
How will upcoming US inflation data impact AUD/USD trading this week?
Higher-than-expected inflation could strengthen the USD, pushing AUD/USD towards $0.70644 support. Conversely, cooler inflation might weaken the USD, potentially aiding a move above $0.70766 resistance. Traders should monitor these releases closely for significant volatility.
Track markets in real-time
AI-powered analysis, technical indicators and real-time price data.
Join Our Telegram Channel
Breaking market news, AI analysis and trading signals instantly.
Join Channel