The relentless upward march of gold has brought it face-to-face with a significant resistance level at $4,330.32. This critical juncture arrives amid a broader risk-on sentiment gripping global markets, evidenced by the Nasdaq 100's impressive 2.94% surge and the Dow Jones Industrial Average's 1.04% climb. While equities are roaring, the question on every trader's mind is whether gold can sustain its momentum, break through this formidable barrier, or if a correction is imminent. This analysis delves into the intricate technical signals and market correlations shaping gold's immediate future.
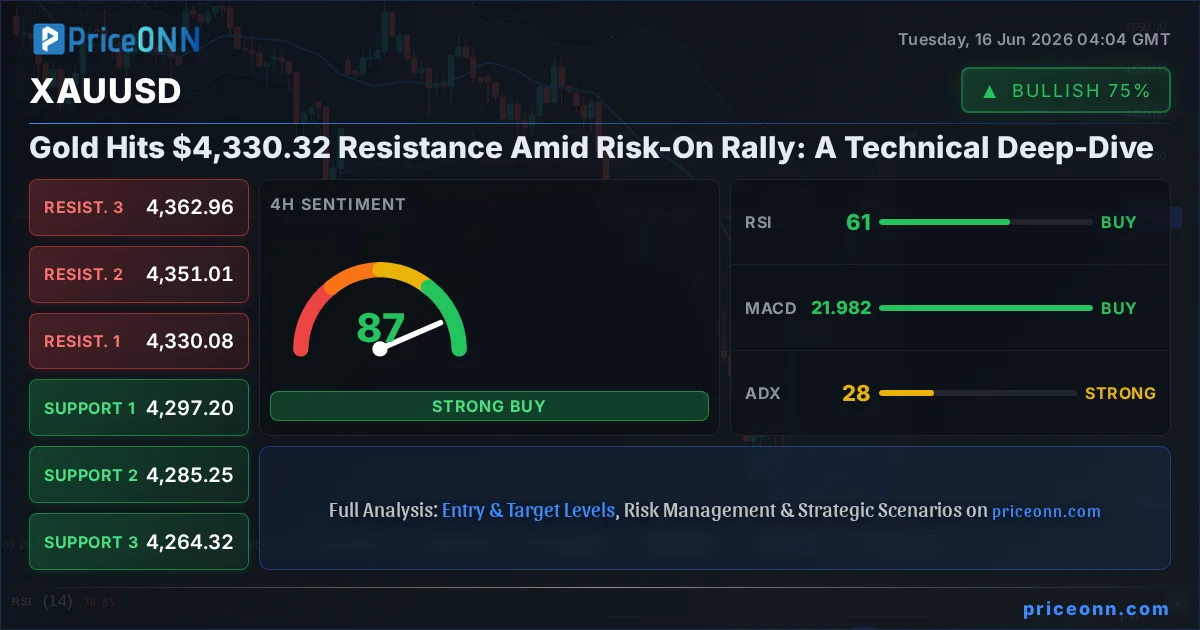
- XAUUSD is currently trading at $4,330.32, testing a significant resistance level.
- The 1-hour RSI at 60.01 shows a bullish trend in momentum, while the 1-day RSI at 43.87 suggests underlying weakness.
- Key support for XAUUSD is identified at $4,310.38, with resistance looming at $4,336.86 on the 1-hour chart.
- The DXY's slight dip to 99.75 provides some breathing room for gold, but its overall trend remains a factor.
- A strong risk-on sentiment is evident in equities like the Nasdaq 100, potentially drawing capital away from safe-haven assets like gold.
Navigating the $4,330.32 Confluence Zone
Gold's ascent to $4,330.32 is not occurring in a vacuum. The broader market sentiment is currently leaning towards risk appetite, a condition often at odds with gold's traditional role as a safe-haven asset. Major indices like the Nasdaq 100 have seen substantial gains, with the index trading at 30,513.83, up 2.94% on the day. Similarly, the Dow Jones Industrial Average is pushing higher, trading at 51,714.50. This risk-on environment, fueled in part by a potential interim US-Iran agreement according to recent reports, typically sees capital flow away from traditional safe havens. However, gold's price action indicates that other factors are at play, possibly including inflation expectations or specific geopolitical undercurrents not fully captured by the broad market sentiment. The divergence between gold's strength and the equity rally is a key point of tension.
The immediate technical picture on the 1-hour chart for XAUUSD shows a neutral trend with a momentum strength of 50%. The RSI(14) stands at 60.01, indicating a bullish inclination within the neutral zone, suggesting that buyers are still present but not overwhelmingly dominant. This is further supported by the Stochastic oscillator, where the %K line at 47.69 is crossing above the %D line at 20.8, signaling a potential upward move. However, the MACD is showing negative momentum, with the MACD line below its signal line, and the Bollinger Bands are indicating a bearish tendency as price trades below the middle band. The ADX at 24.71 suggests a moderately strong trend is in play, but the conflicting signals from RSI and MACD warrant caution. The general signal across the 1-hour timeframe leans towards 'AL' (Buy), with 6 Buy signals versus 2 Sell signals, but the nuances are critical.
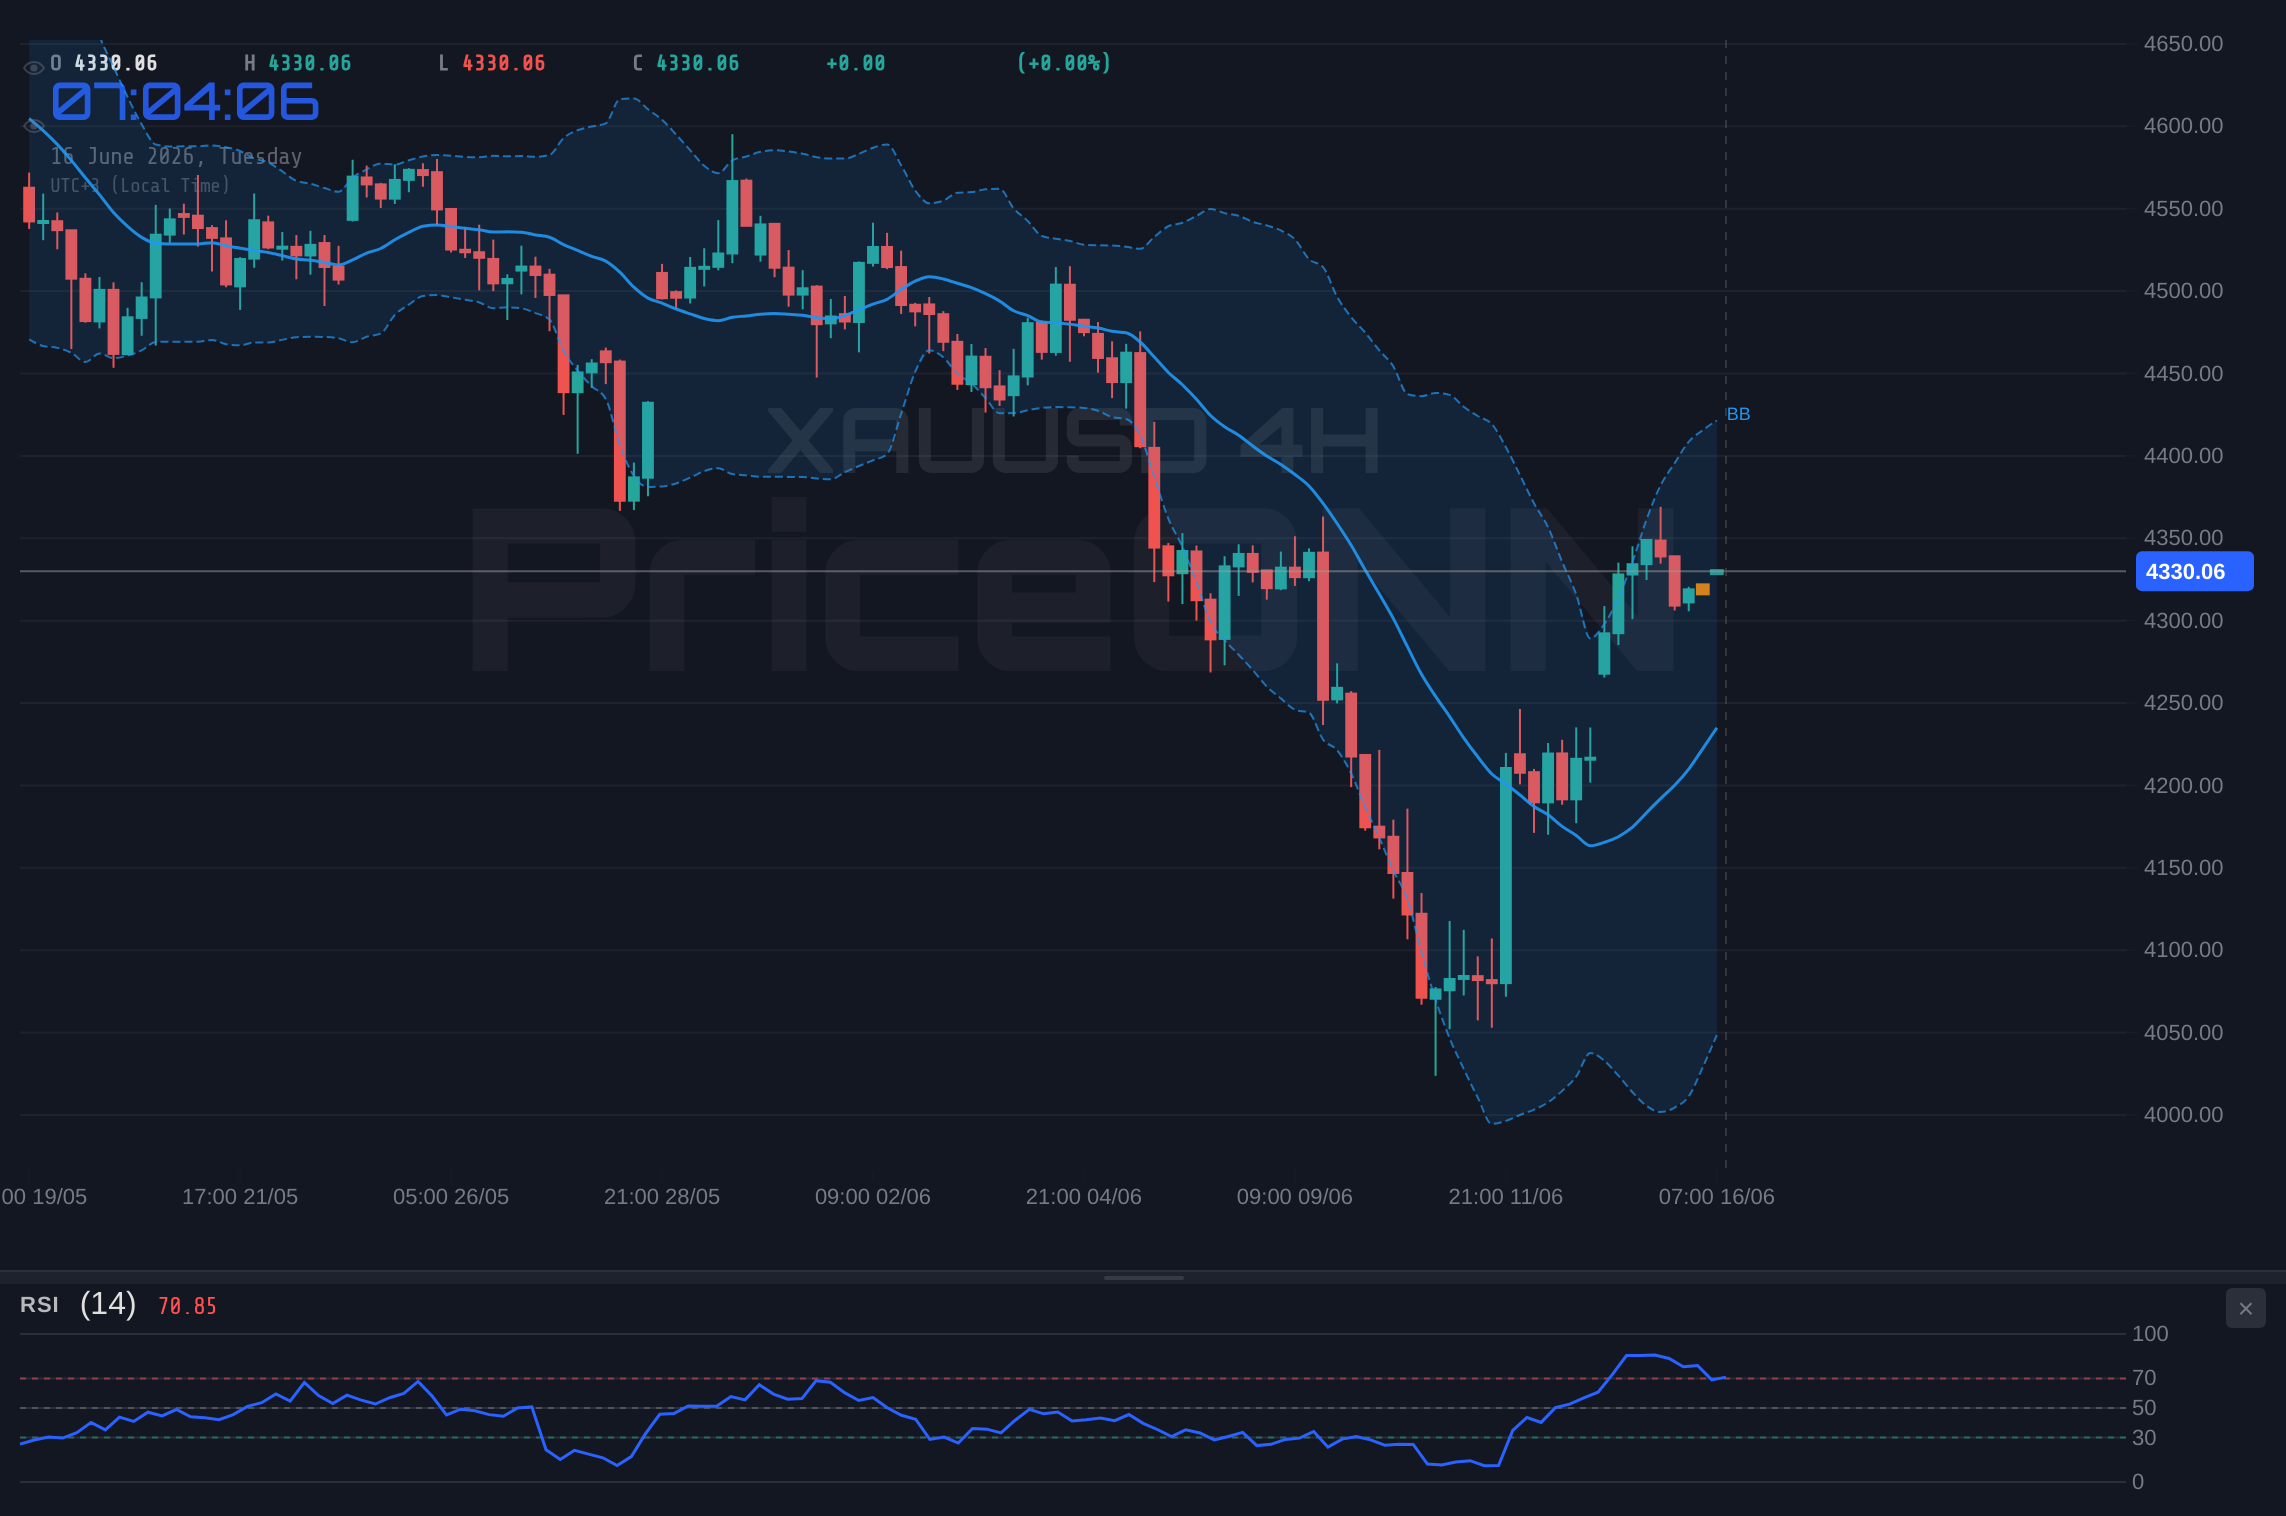
Looking at the 4-hour timeframe, the trend remains neutral with a 50% strength, but the indicators paint a slightly more bullish picture than the 1-hour chart. The RSI(14) is at 60.76, still in the neutral zone but with a firmer upward lean. The MACD shows positive momentum, with the MACD line above its signal line, and the Bollinger Bands are trading above the middle band, supporting a bullish outlook. The Stochastic oscillator, however, presents a divergence: %K at 77.81 is above %D at 89.54, but the %K line is below the %D line, which typically signals a bearish move, especially in overbought territory. Yet, the ADX reading of 27.52 indicates a strong uptrend, reinforcing the bullish bias. The overall signal on the 4-hour chart is also 'AL' (Buy), with 6 Buy signals against 2 Sell signals, suggesting that the intermediate-term trend is leaning positive, despite some conflicting signals.
The daily timeframe, however, presents a starkly different narrative. Here, the trend is decisively bearish with 100% strength. The RSI(14) sits at 43.87, firmly in the neutral zone but with a downward trajectory, indicating selling pressure is building. The MACD is also exhibiting negative momentum, with the MACD line below its signal line, and the Bollinger Bands are trading below the middle band, reinforcing the bearish outlook. The Stochastic oscillator, while showing a bullish signal with %K (45.16) above %D (21.13), is in a less definitive position. The ADX at 35.41 unequivocally points to a strong downtrend. The overall signal on the daily chart is a strong 'SAT' (Sell), with 6 Sell signals and only 2 Buy signals. This significant divergence between the short-term (1H, 4H) bullish leanings and the long-term (1D) bearish trend is the core tension in the current XAUUSD market.
The Dollar's Dance and Gold's Dilemma
The US Dollar Index (DXY) is currently hovering around 99.75, showing a slight daily decline of -0.03%. On the 1-hour chart, the DXY exhibits a neutral trend, with RSI at 59.88 and MACD showing positive momentum. The Stochastic oscillator is in the overbought territory (%K: 88.86, %D: 86.62), suggesting a potential pullback for the dollar. The 4-hour chart also shows a neutral trend, with RSI at 53.67 and a slight bearish MACD momentum. The daily chart, however, maintains a neutral trend, with RSI at 61.15 and positive MACD momentum, but Stochastic showing a bearish signal (%K
The correlation between gold and the dollar is a long-standing principle in financial markets. Historically, a strengthening dollar often leads to a weakening gold price, as both are considered safe-haven assets, and dollar strength makes gold more expensive for holders of other currencies. The current DXY level around 99.75 is not exceptionally high, but its stability amid equity gains is noteworthy. If the dollar begins to weaken significantly, it could provide the necessary tailwind for gold to break above its current resistance. Conversely, any resurgence in dollar strength, perhaps driven by renewed inflation concerns or hawkish signals from the Federal Reserve, could cap gold's upside and even trigger a sell-off.
Recent news flow adds another layer of complexity. Reports of a potential US-Iran interim agreement have injected a strong risk-on sentiment into the markets, as highlighted by the surge in Nasdaq 100 and Dow Jones. This development, if it leads to de-escalation in geopolitical tensions, could reduce demand for gold as a safe haven. Furthermore, falling oil prices, as indicated by Brent Crude's 5.3% drop to $83.84 and WTI's 4.57% fall to $80.89, could ease inflation concerns. JP Morgan's analysis suggests falling oil prices can be a tailwind for global stock markets, further reinforcing the risk-on narrative. This macro backdrop creates a challenging environment for gold, despite its recent upward price action.
Decoding Gold's Technical Signals at $4,330.32
Let's zoom in on the critical technical levels surrounding the $4,330.32 price point for XAUUSD. On the 1-hour chart, the immediate support lies at $4,310.38, followed by $4,302.26 and $4,297.14. Resistance is stacked at $4,323.62, $4,328.74, and crucially, $4,336.86. A break above $4,336.86 would be a significant bullish signal, potentially opening the door for further gains. Conversely, a failure to hold support at $4,310.38 could see prices retrace towards the $4,300 psychological level.
The 4-hour chart provides slightly higher support levels at $4,297.2, $4,285.25, and $4,264.32, with resistance at $4,330.08, $4,351.01, and $4,362.96. The current price is hovering just above the first resistance level on this timeframe, indicating a battleground. The ADX at 27.52 on the 4-hour chart confirms a strong uptrend, which is encouraging for gold bulls. However, the Stochastic showing a bearish signal in overbought territory warrants caution. A close above $4,330.08 on this timeframe would be a strong indicator of continued bullishness.
The daily chart's perspective is undeniably bearish, with support found much lower at $4,175.81, $4,134.79, and $4,099.49. Resistance is seen at $4,252.13, $4,287.43, and $4,328.45. The current price is trading above the daily resistance at $4,328.45, but the overall trend strength (100%) and the ADX (35.41) point towards a strong downtrend. This suggests that the short-term rallies might be opportunities for sellers to enter the market, especially if the broader risk-on sentiment persists and the dollar strengthens. The RSI at 43.87 on the daily chart also indicates room for further downside.
Bearish Scenario: Resistance Holds Firm
65% ProbabilityNeutral Scenario: Consolidation Around $4,330
25% ProbabilityBullish Scenario: Resistance Breakout
10% ProbabilityThe Path Forward: What to Watch
The confluence of technical signals and macroeconomic factors presents a complex picture for XAUUSD. The short-term charts (1H and 4H) show bullish momentum, driven by RSI and ADX readings suggesting upward pressure. However, the persistent bearish trend on the daily chart, coupled with the broader risk-on environment and a relatively stable dollar, introduces significant headwinds. The $4,330.32 level is a critical pivot point. A failure to decisively break through this resistance, especially if accompanied by a strengthening dollar or waning equity market enthusiasm, could lead to a sharp pullback towards the $4,310.38 support. Conversely, a breakout above $4,336.86, while currently less probable according to our scenario analysis, would signal a potential shift in short-term sentiment.
Traders should pay close attention to the interplay between gold, the DXY, and major equity indices. Any signs of dollar weakness or a cooling in the risk-on rally could bolster gold's safe-haven appeal. Furthermore, upcoming economic data releases, particularly those related to inflation and central bank policy, will be crucial. While specific Fed announcements are not in the immediate calendar, market expectations surrounding future rate moves remain a constant influence. The energy markets also bear watching; a sustained drop in oil prices could further dampen inflation fears, potentially reducing gold's appeal. For now, the $4,330.32 resistance acts as a critical line in the sand, and price action around this level will dictate the short-term direction.
The technical indicators present a mixed bag, with short-term bullish signals battling against long-term bearish trends. The RSI at 60.01 on the 1-hour chart suggests upward momentum is present, but the daily RSI at 43.87 indicates that the larger trend is not yet supportive of sustained gains. The ADX readings provide clarity on trend strength: 24.71 on the 1H, 27.52 on the 4H, and a strong 35.41 on the daily. This indicates that while short-term trends are present, the dominant daily trend is bearish and strong. Therefore, any upside move should be treated with caution, and confirmation of a sustained break above key resistance levels will be paramount for bullish conviction.
| Indicator | Value | Signal | Interpretation |
|---|---|---|---|
| RSI (14) | 60.01 | Neutral | Bullish lean in neutral zone on 1H, bearish lean on 1D. |
| MACD | -15.20 | Bearish | Negative momentum on 1H and 1D charts. |
| Stochastic | K=47.69, D=20.8 | Bullish | Bullish crossover on 1H, but conflicting signals across timeframes. |
| ADX | 24.71 | Bullish Trend | Moderate to strong trend strength across timeframes, dominant on 1D (35.41). |
| Bollinger Bands | Middle Band Test | Watch | Price testing middle band on 1H and 4H, below on 1D. |
Frequently Asked Questions: XAUUSD Analysis
What happens if XAUUSD breaks above $4,336.86 resistance, given the daily bearish trend?
A sustained break above $4,336.86, confirmed by increasing volume and holding above $4,351.01 on the 4-hour chart, would invalidate the immediate bearish outlook. This could signal a short-term bullish reversal, targeting higher resistance levels, but would still face the stronger daily downtrend.
Is RSI at 60.01 a buy signal for XAUUSD at $4,330.32, considering the conflicting daily indicators?
An RSI of 60.01 on the 1-hour chart indicates bullish momentum but is not an extreme buy signal. Given the conflicting daily RSI of 43.87 and strong daily ADX of 35.41, a buy signal solely based on this RSI reading would be premature. Confirmation from price action breaking key resistance is crucial.
How will the risk-on rally in Nasdaq 100 (30513.83) affect XAUUSD's price action around $4,330.32?
A strong risk-on rally in the Nasdaq 100 typically reduces demand for safe-haven assets like gold. This could put downward pressure on XAUUSD, making it harder to break the $4,330.32 resistance. If the rally continues unabated, it might signal a rotation away from gold.
Should traders consider shorting XAUUSD at $4,330.32 given the strong daily downtrend and ADX of 35.41?
Shorting at current levels carries risk due to short-term bullish signals. However, the strong daily downtrend and ADX suggest that rallies might be opportunities for sellers. A confirmed rejection at $4,336.86 resistance, with a break below $4,310.38 support, would strengthen the case for a short position.
Track markets in real-time
AI-powered analysis, technical indicators and real-time price data.
Join Our Telegram Channel
Breaking market news, AI analysis and trading signals instantly.
Join Channel