The global financial stage is currently a complex interplay of shifting economic indicators and geopolitical undercurrents, and nowhere is this more evident than in the gold market. As traders eye the yellow metal around the $4,335.26 mark, a critical juncture has been reached. While recent price action shows a degree of resilience, holding above the pivotal $4,330.98 level on the 1-hour chart, the broader macroeconomic landscape presents a mixed bag of signals that demand careful navigation. The recent 'risk-on' rally, partly fueled by tentative geopolitical agreements and the subsequent sharp decline in oil prices, has momentarily shifted focus away from traditional safe-haven assets. However, the persistent concerns surrounding inflation, coupled with the looming shadow of central bank policy decisions, mean that gold's safe-haven status remains firmly in play. This analysis delves into the confluence of technical indicators and fundamental drivers shaping XAUUSD's immediate future, exploring whether the current price consolidation is a prelude to further gains or a temporary pause before a more significant correction.
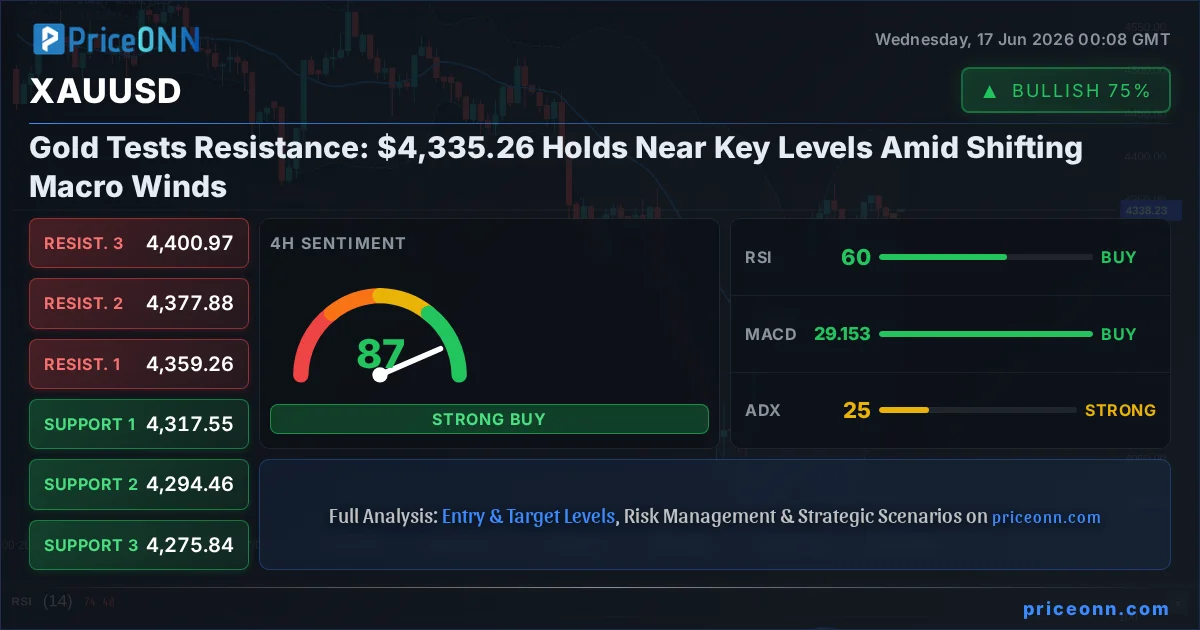
- XAUUSD is currently trading at $4,335.26, testing resistance near key levels.
- Critical support sits at $4,330.98, holding firm in the short term.
- The 1-hour RSI at 53.27 indicates a neutral stance with a slight upward bias, while the 1-day RSI at 44.29 suggests a bearish trend.
- The dollar index (DXY) at 99.58 is showing a bearish trend on 1-hour and 4-hour charts, which could support gold prices.
- Falling oil prices, with Brent crude at $79.82, may ease inflation fears but also signal a potential shift in risk appetite.
The recent sharp downturn in oil prices, with Brent crude shedding significant value and WTI following suit, presents an interesting dichotomy for gold. On one hand, falling energy costs can alleviate inflationary pressures, potentially reducing the urgency for aggressive central bank tightening. This could, in theory, make non-yielding assets like gold more attractive. However, the simultaneous 'risk-on' sentiment that often accompanies such a narrative can draw capital away from safe havens and into riskier assets, creating a headwind for XAUUSD. The news of a tentative US-Iran agreement and the subsequent clearing of the Strait of Hormuz by the first LNG tanker suggests a de-escalation in a key geopolitical hotspot. This development, as reported by various outlets, has undoubtedly contributed to the shift in market sentiment, pushing equities higher and dampening demand for traditional safe havens. Yet, the underlying economic data remains a critical factor. With the Federal Reserve's next policy decision on the horizon, market participants are meticulously dissecting every piece of economic information for clues about the future path of interest rates. This uncertainty ensures that gold's price remains sensitive to shifts in monetary policy expectations.
Navigating the Technical Crosscurrents for Gold
Looking at the 1-hour XAUUSD chart, the picture is one of cautious optimism, at least in the immediate term. The current price of $4,335.26 hovers just below the 1-hour resistance level of $4,337.85. The RSI(14) stands at 53.27, firmly in neutral territory but showing a slight upward tendency, suggesting that buyers have a marginal edge without entering overbought conditions. The ADX at 14.66, however, points to a weak trend, indicating that the current price action might be more range-bound than indicative of a strong directional move. The MACD, while showing negative momentum on this timeframe, is hovering near the signal line, adding to the indecisive technical picture. Stochastic oscillators, with %K at 54.16 and %D at 56.59, are also leaning towards a bearish signal, reinforcing the idea that upward momentum is not yet robust. The Bollinger Bands are trading below the middle band, implying a slight bearish bias in the very short term. Yet, the fact that price is holding above the 1-hour support at $4,330.98 is crucial for the bulls.
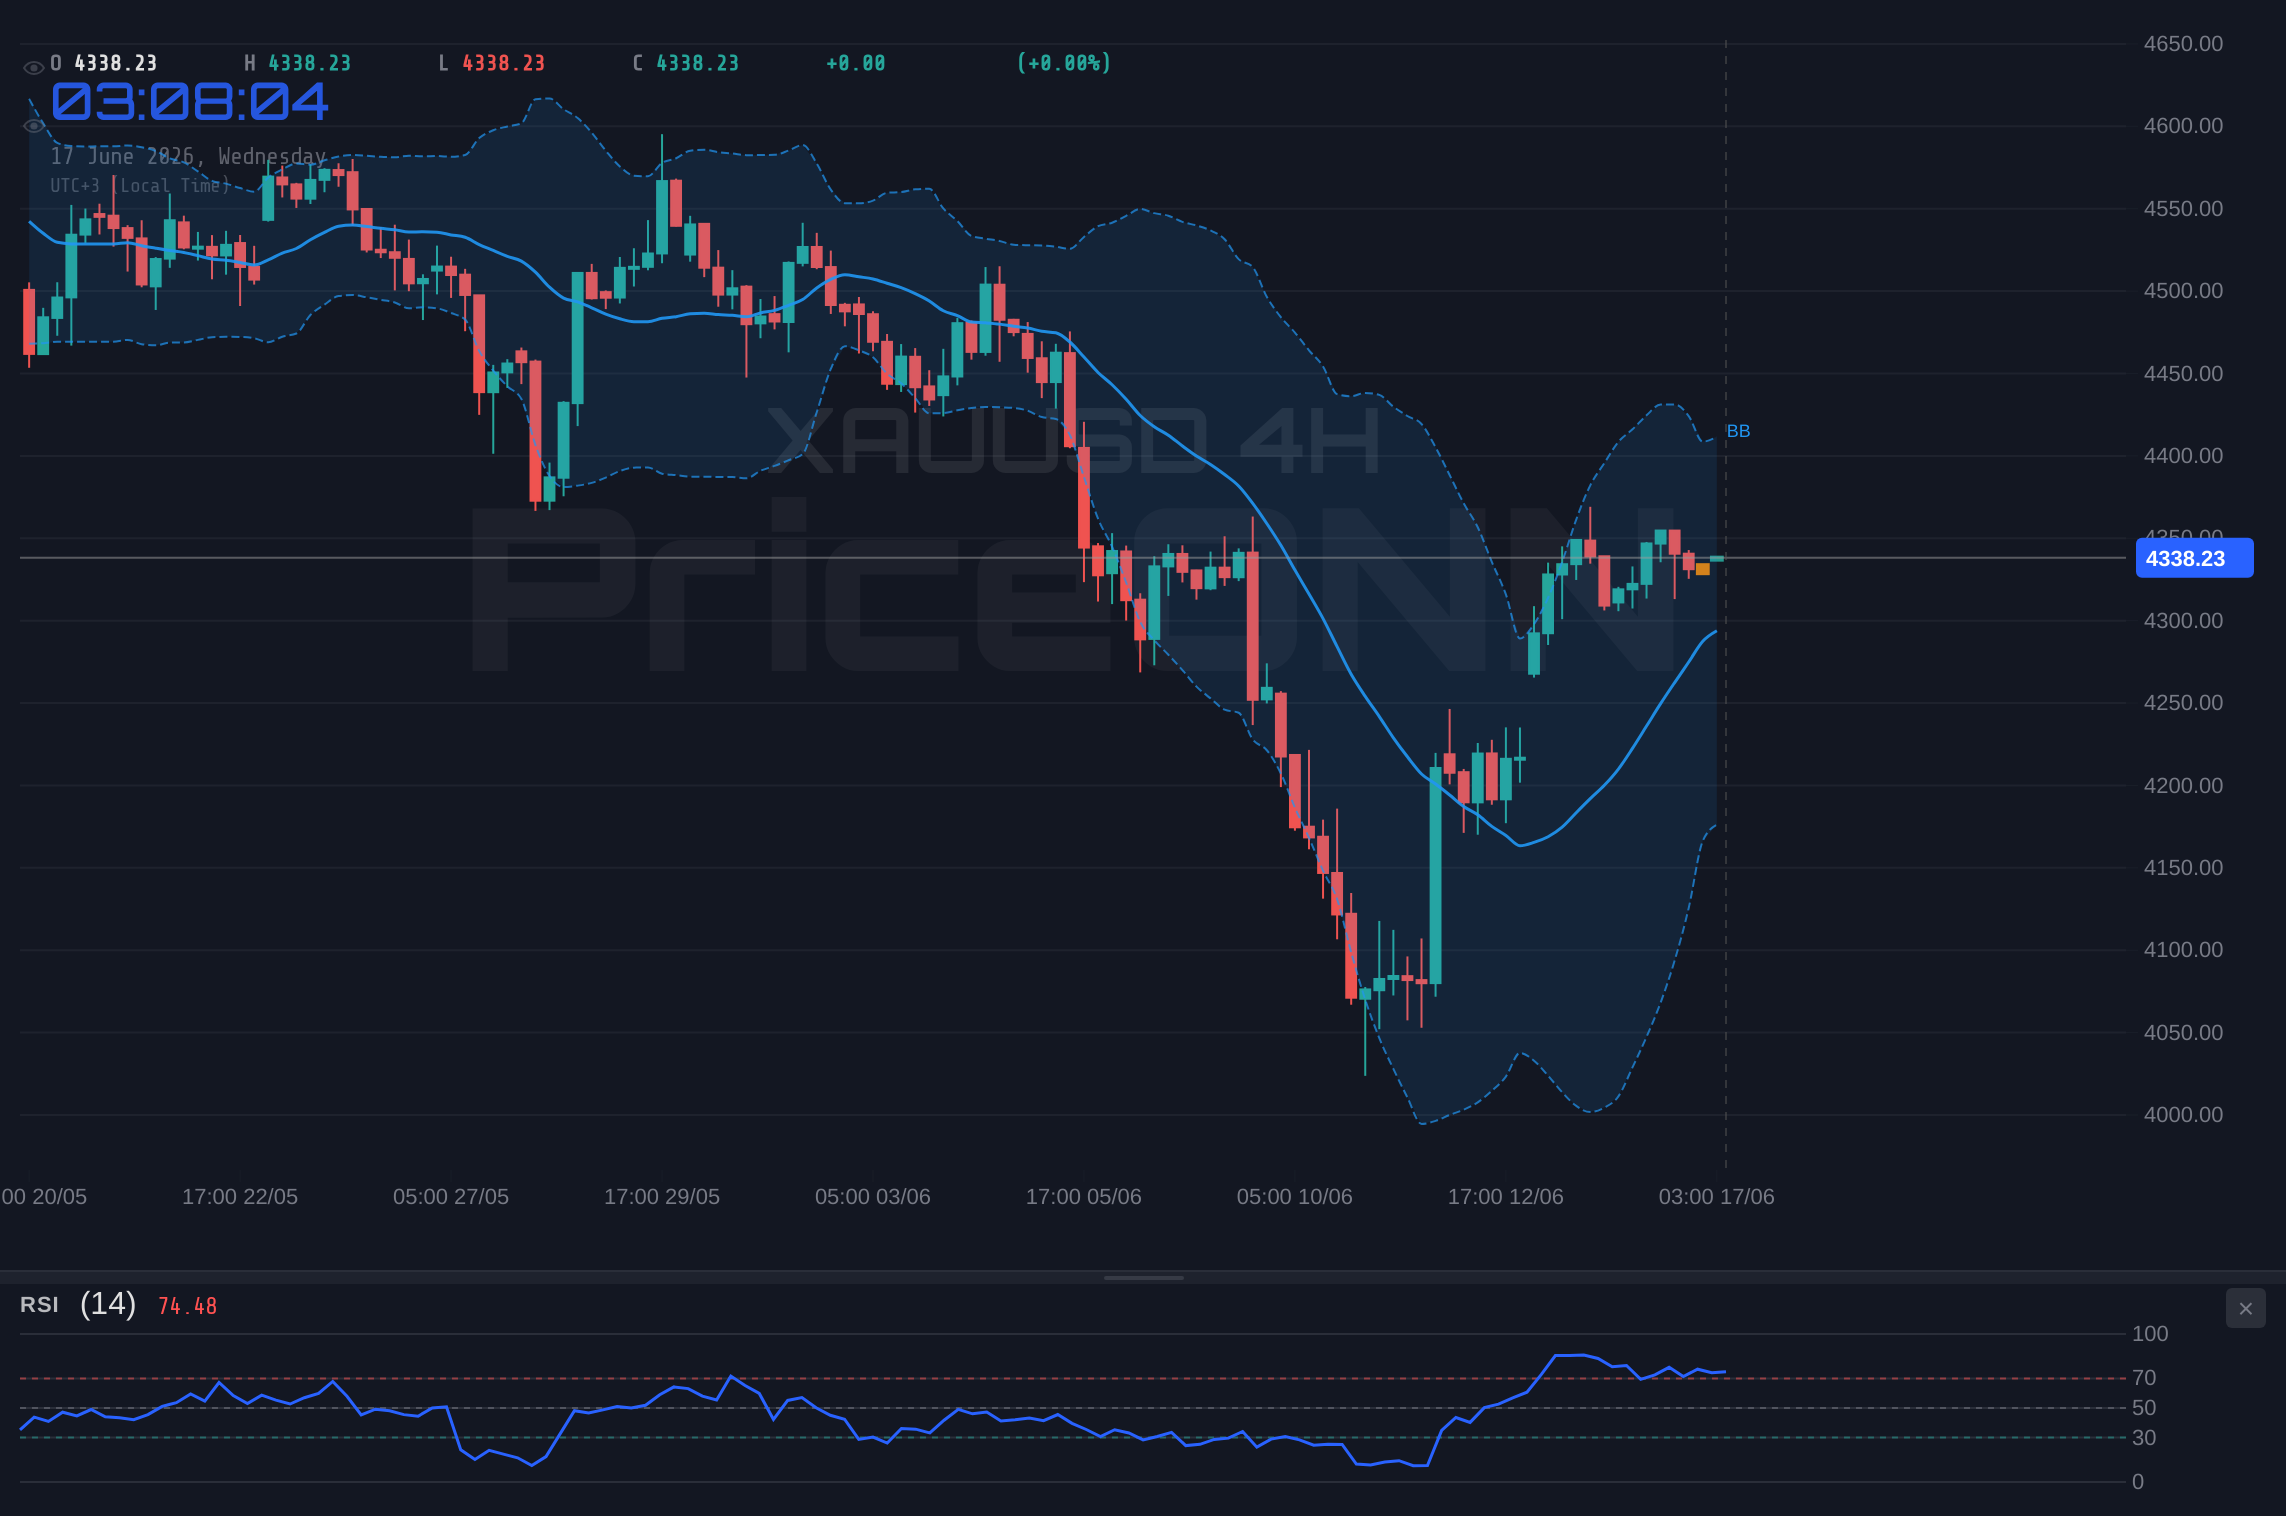
The 4-hour timeframe offers a slightly more constructive outlook for gold, despite some conflicting signals. The trend is categorized as neutral, with a 50% power rating, reflecting the choppy nature of recent price action. The RSI(14) at 59.7 is comfortably in neutral territory, showing a rising trend, which is a positive sign for potential upside. The MACD is exhibiting positive momentum with the MACD line above the signal line, a technical bullish indication. Bollinger Bands are trading above the middle band, suggesting an upward bias. However, the Stochastic indicators present a divergence: %K at 62.55 and %D at 72.63 show a bearish signal as %K has crossed below %D. This conflict is important. The ADX at 25.27 indicates a moderately strong uptrend, which seems to contradict the weakening stochastic signal. The overall signal for the 4-hour timeframe is 'BUY' (6 buys, 2 sells), driven by the confluence of RSI, MACD, and ADX strength, despite the stochastic warning. This suggests that while short-term fluctuations might occur, the underlying trend on this timeframe is leaning positive.
On the 4-hour chart, traders are watching $4,317.55 as the first key support level. A decisive break below this point could signal a shift in momentum, potentially invalidating the current bullish leanings and opening the door for further declines towards $4,294.46 and $4,275.84.
The daily chart, however, paints a starkly different picture, highlighting the significant headwinds XAUUSD faces from a longer-term perspective. The trend is decisively bearish, with a power rating of 98%. The current price of $4,335.26 is well below the daily resistance level of $4,363.68. The RSI(14) at 44.29 is firmly in neutral territory but trending downwards, reinforcing the bearish sentiment. The MACD continues to show negative momentum, with the MACD line below the signal line, a classic bearish signal. Bollinger Bands are also trading below the middle band, indicating a downward bias. The Stochastic indicators offer a glimmer of hope for the bulls, with %K at 52.92 and %D at 25.73, presenting a bullish crossover signal. However, this lone bullish signal is heavily outweighed by the ADX reading of 35.16, which denotes a strong bearish trend. The overall signal on the daily timeframe is 'SELL' (2 buys, 6 sells), underscoring the dominant downtrend. This daily perspective is crucial; it suggests that any short-term rallies are occurring within a larger bearish structure.
Macroeconomic Drivers: The Fed, Inflation, and the Dollar's Shadow
The narrative surrounding gold is inextricably linked to the Federal Reserve's monetary policy stance. As inflation data continues to be scrutinized, the market is constantly repricing the likelihood of future interest rate hikes or pauses. While recent drops in oil prices might suggest easing inflation, other economic indicators need to be considered. The strength of the US dollar, as measured by the DXY index, remains a key barometer. Currently, the DXY is at 99.58, showing a bearish trend on the 1-hour and 4-hour charts, which generally provides a tailwind for gold. A weaker dollar makes gold cheaper for holders of other currencies, potentially increasing demand. However, the daily DXY chart shows a bullish signal, indicating that the dollar's weakness might be short-lived, or that the longer-term trend is still intact. This conflicting signal between short-term dollar weakness and potential long-term strength adds another layer of complexity for gold traders.
The Federal Reserve's communication strategy is paramount. Any hints of a hawkish stance – suggesting continued vigilance against inflation and a readiness to raise rates further if necessary – could strengthen the dollar and put downward pressure on gold. Conversely, any signs of dovishness, perhaps due to moderating inflation data or concerns about economic growth, could weaken the dollar and boost gold prices. Market participants are keenly awaiting the Fed's upcoming policy statements and economic projections. The CME FedWatch tool, if available and updated with current probabilities, would be instrumental in gauging market expectations for future rate moves. Without specific probabilities, we must infer from broader economic data. For instance, if recent employment figures like Non-Farm Payrolls (NFP) have shown signs of cooling, it might support the case for a Fed pause, which would be bullish for gold. Conversely, persistently strong labor markets could embolden the Fed to maintain a tighter policy, acting as a drag on the yellow metal.
The correlation between gold and equities also warrants attention. The SP500 is currently trading at 6572.87, showing a strong upward trend on the 1-hour chart but a bearish trend on the daily. Nasdaq100, at 30038.5, is also showing mixed signals across timeframes. This divergence in equity markets adds to the overall uncertainty. Typically, a strong 'risk-on' environment, where major indices surge, can lead to outflows from safe-haven assets like gold. Conversely, a 'risk-off' sentiment, marked by falling stock prices, usually drives investors towards gold. The recent rally in equities, despite the bearish signal on the daily SP500 chart, suggests that market participants might be prioritizing the immediate impact of falling oil prices and tentative geopolitical de-escalation over longer-term economic concerns. This creates a complex environment where gold's traditional safe-haven appeal might be temporarily overshadowed by other market dynamics.
The current technical setup for XAUUSD presents a classic dilemma: short-term bullish signals on the 1-hour and 4-hour charts are battling against a dominant bearish trend on the daily timeframe. This suggests that while opportunities for short-term trades might exist, a significant move higher would require a clear break above daily resistance levels and sustained positive macro-economic catalysts. Conversely, failure to hold key support levels could accelerate the decline, aligning with the longer-term bearish outlook.
Geopolitical Ripples and Inflationary Echoes
The geopolitical landscape continues to be a significant, albeit often unpredictable, driver for gold. While the recent news regarding a tentative US-Iran agreement has provided some relief, the broader geopolitical risks remain elevated. The ongoing conflict in Eastern Europe, tensions in the Middle East beyond Iran, and the complex US-China relationship all contribute to an undercurrent of uncertainty that can spur safe-haven demand for gold. According to sources like Reuters, geopolitical tensions have historically been a major catalyst for gold price appreciation, as investors seek refuge from potential market disruptions. Even if immediate de-escalation occurs in one region, the potential for flare-ups elsewhere means that gold often retains a baseline level of demand as an insurance asset against global instability.
Furthermore, the persistent global inflation narrative, even with the recent dip in oil prices, cannot be ignored. Central banks worldwide are walking a tightrope, attempting to curb inflation without triggering a deep recession. If inflation proves more stubborn than anticipated, or if it re-accelerates due to supply chain issues or other unforeseen events, central banks might be forced to maintain a hawkish stance for longer than the market currently prices in. This scenario would typically be bearish for gold, as higher interest rates increase the opportunity cost of holding a non-yielding asset. However, in an environment where inflation remains elevated, gold can also act as a hedge against the erosion of purchasing power, providing a floor for its price. The interplay between inflation expectations, central bank responses, and geopolitical stability creates a dynamic environment where gold's role as a safe haven and an inflation hedge is constantly being tested.
The recent analyst recommendations, such as Gold Fields Ltd. being ranked as a top metals pick by some brokerages, indicate a degree of underlying optimism within the analyst community regarding the precious metals sector. While this is not a direct market signal, it suggests that some professionals see value in gold and related assets, potentially anticipating a future price appreciation. This sentiment, however, must be weighed against the prevailing technical indicators and macroeconomic data. The fact that XAUUSD is currently testing resistance levels near $4,335.26, while holding above critical support at $4,330.98, indicates a market in balance, awaiting a clearer catalyst to break the current stalemate. The coming days, particularly with any further central bank commentary or significant economic data releases, will be crucial in determining the next directional move.
The current market sentiment for XAUUSD is mixed. Short-term indicators suggest a neutral to slightly bullish bias, supported by a weaker dollar on hourly and 4-hour charts. However, the dominant bearish trend on the daily chart and the overarching concerns about future central bank policy remain significant headwinds. The key will be whether XAUUSD can decisively break above daily resistance levels or if it succumbs to the longer-term bearish pressure.
The Path Forward: Levels to Watch and Potential Scenarios
As we navigate this complex market environment, the focus for gold traders sharpens on specific price levels and potential scenarios. The immediate battleground lies around the current price of $4,335.26. On the upside, clearing the 1-hour resistance cluster at $4,337.85, $4,340.30, and $4,344.72 would be the first step towards challenging higher levels. A sustained move above these points, ideally confirmed by increasing volume and positive macroeconomic news, could pave the way for testing the 4-hour resistance zone starting at $4,359.26. This would signal a potential shift in momentum, aligning the shorter-term charts with a more bullish outlook.
Conversely, the downside risk remains significant, primarily driven by the daily bearish trend. Failure to hold the $4,330.98 support on the 1-hour chart is the immediate alert. A decisive break below this level, followed by a close below the 4-hour support at $4,317.55, would likely trigger further selling pressure. This could lead to a rapid descent towards the more significant daily support levels, starting with $4,260.03, and potentially extending towards $4,210.91. Such a move would confirm the dominance of the longer-term bearish trend and suggest that the recent consolidation was merely a pause before a deeper correction.
Bearish Scenario: Testing the Depths
45% ProbabilityConsolidation Scenario: Range-Bound Action
35% ProbabilityBullish Scenario: Breaking Higher
20% ProbabilityFrequently Asked Questions: XAUUSD Analysis
What happens if XAUUSD breaks below the $4,330.98 support level?
A break below $4,330.98 on the 1-hour chart would invalidate the immediate bullish bias. This could trigger a move towards the next key support at $4,317.55, aligning with the longer-term daily bearish trend.
Should I buy XAUUSD at current levels around $4,335.26 given the mixed signals?
Buying at current levels carries risk due to the conflicting signals between short-term bullish indicators and the dominant daily bearish trend. A confirmed breakout above $4,344.72 or a test of lower support levels with strong momentum would provide clearer trading setups.
Is the RSI at 44.29 on the daily chart a sell signal for XAUUSD?
An RSI of 44.29 on the daily chart indicates a bearish trend, but not necessarily an immediate sell signal on its own. It suggests that selling momentum is present, and combined with other bearish indicators like MACD and Bollinger Bands below the middle band, it reinforces the overall downward bias.
How will the upcoming Fed decision affect XAUUSD this week, given the current price action?
The Fed's policy decision is critical. A hawkish stance might strengthen the dollar and pressure gold towards lower support levels. Conversely, a dovish pivot could weaken the dollar, potentially supporting a move above $4,359.26 resistance. Market expectations, as inferred from economic data, will dictate the immediate impact.
Track markets in real-time
AI-powered analysis, technical indicators and real-time price data.
Join Our Telegram Channel
Breaking market news, AI analysis and trading signals instantly.
Join Channel