The S&P 500 is currently dancing around the $6,572.87 mark, finding itself at a critical resistance level that has traders worldwide holding their breath. This isn't just another day on Wall Street; it's a pivotal moment where multiple market forces are converging, creating a complex tapestry of signals that demand careful interpretation. Having tracked the S&P 500 through the volatile shifts of 2024, the current environment presents a fascinating interplay between persistent inflation concerns, evolving central bank policy expectations, and the ever-present geopolitical undercurrents. The question on everyone's mind is whether this resistance will hold, leading to a period of consolidation or a deeper pullback, or if the bulls possess the strength to shatter it and propel the index into uncharted territory. This analysis dives deep into the technical and fundamental drivers shaping the SP500's immediate future, offering a clear perspective for navigating these choppy waters.
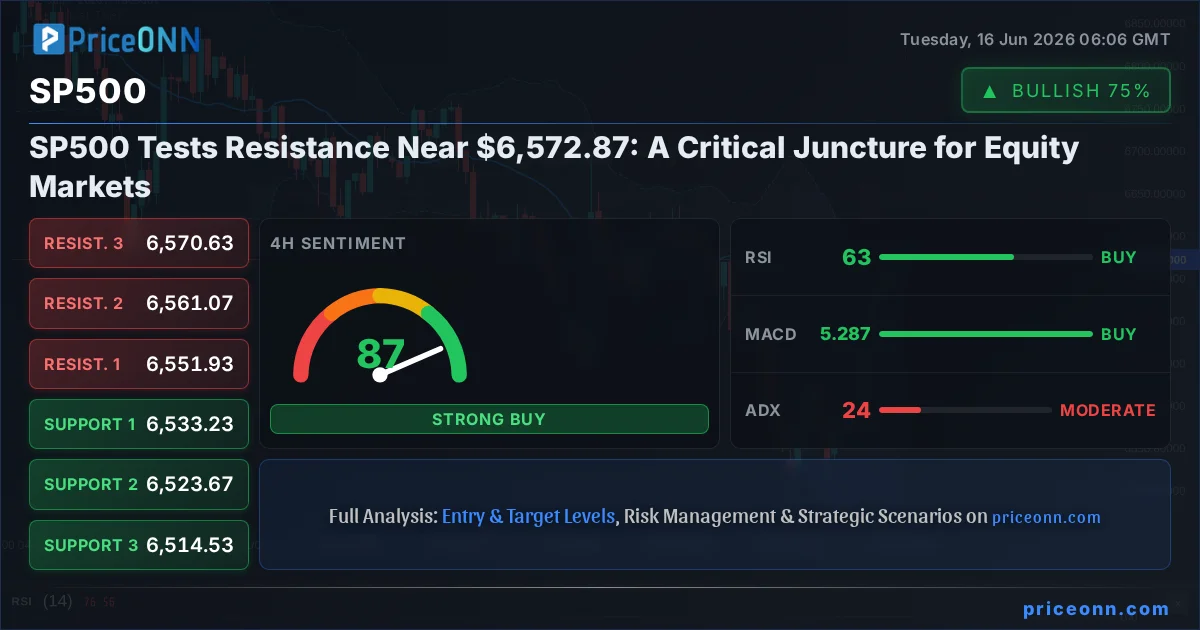
- The SP500 is currently trading at $6,572.87, facing significant resistance.
- RSI at 70.95 on the 1H chart signals overbought conditions, suggesting potential for a pullback.
- Critical support sits at $6,526.53, tested multiple times this week, forming a key floor.
- DXY strength at 99.82 is putting pressure on risk assets, influencing SP500's correlation.
- Mixed signals from MACD and ADX indicate a potential transition from a strong uptrend to a more uncertain phase.
Navigating the $6,572.87 Resistance Zone
The Bulls' Current Challenge
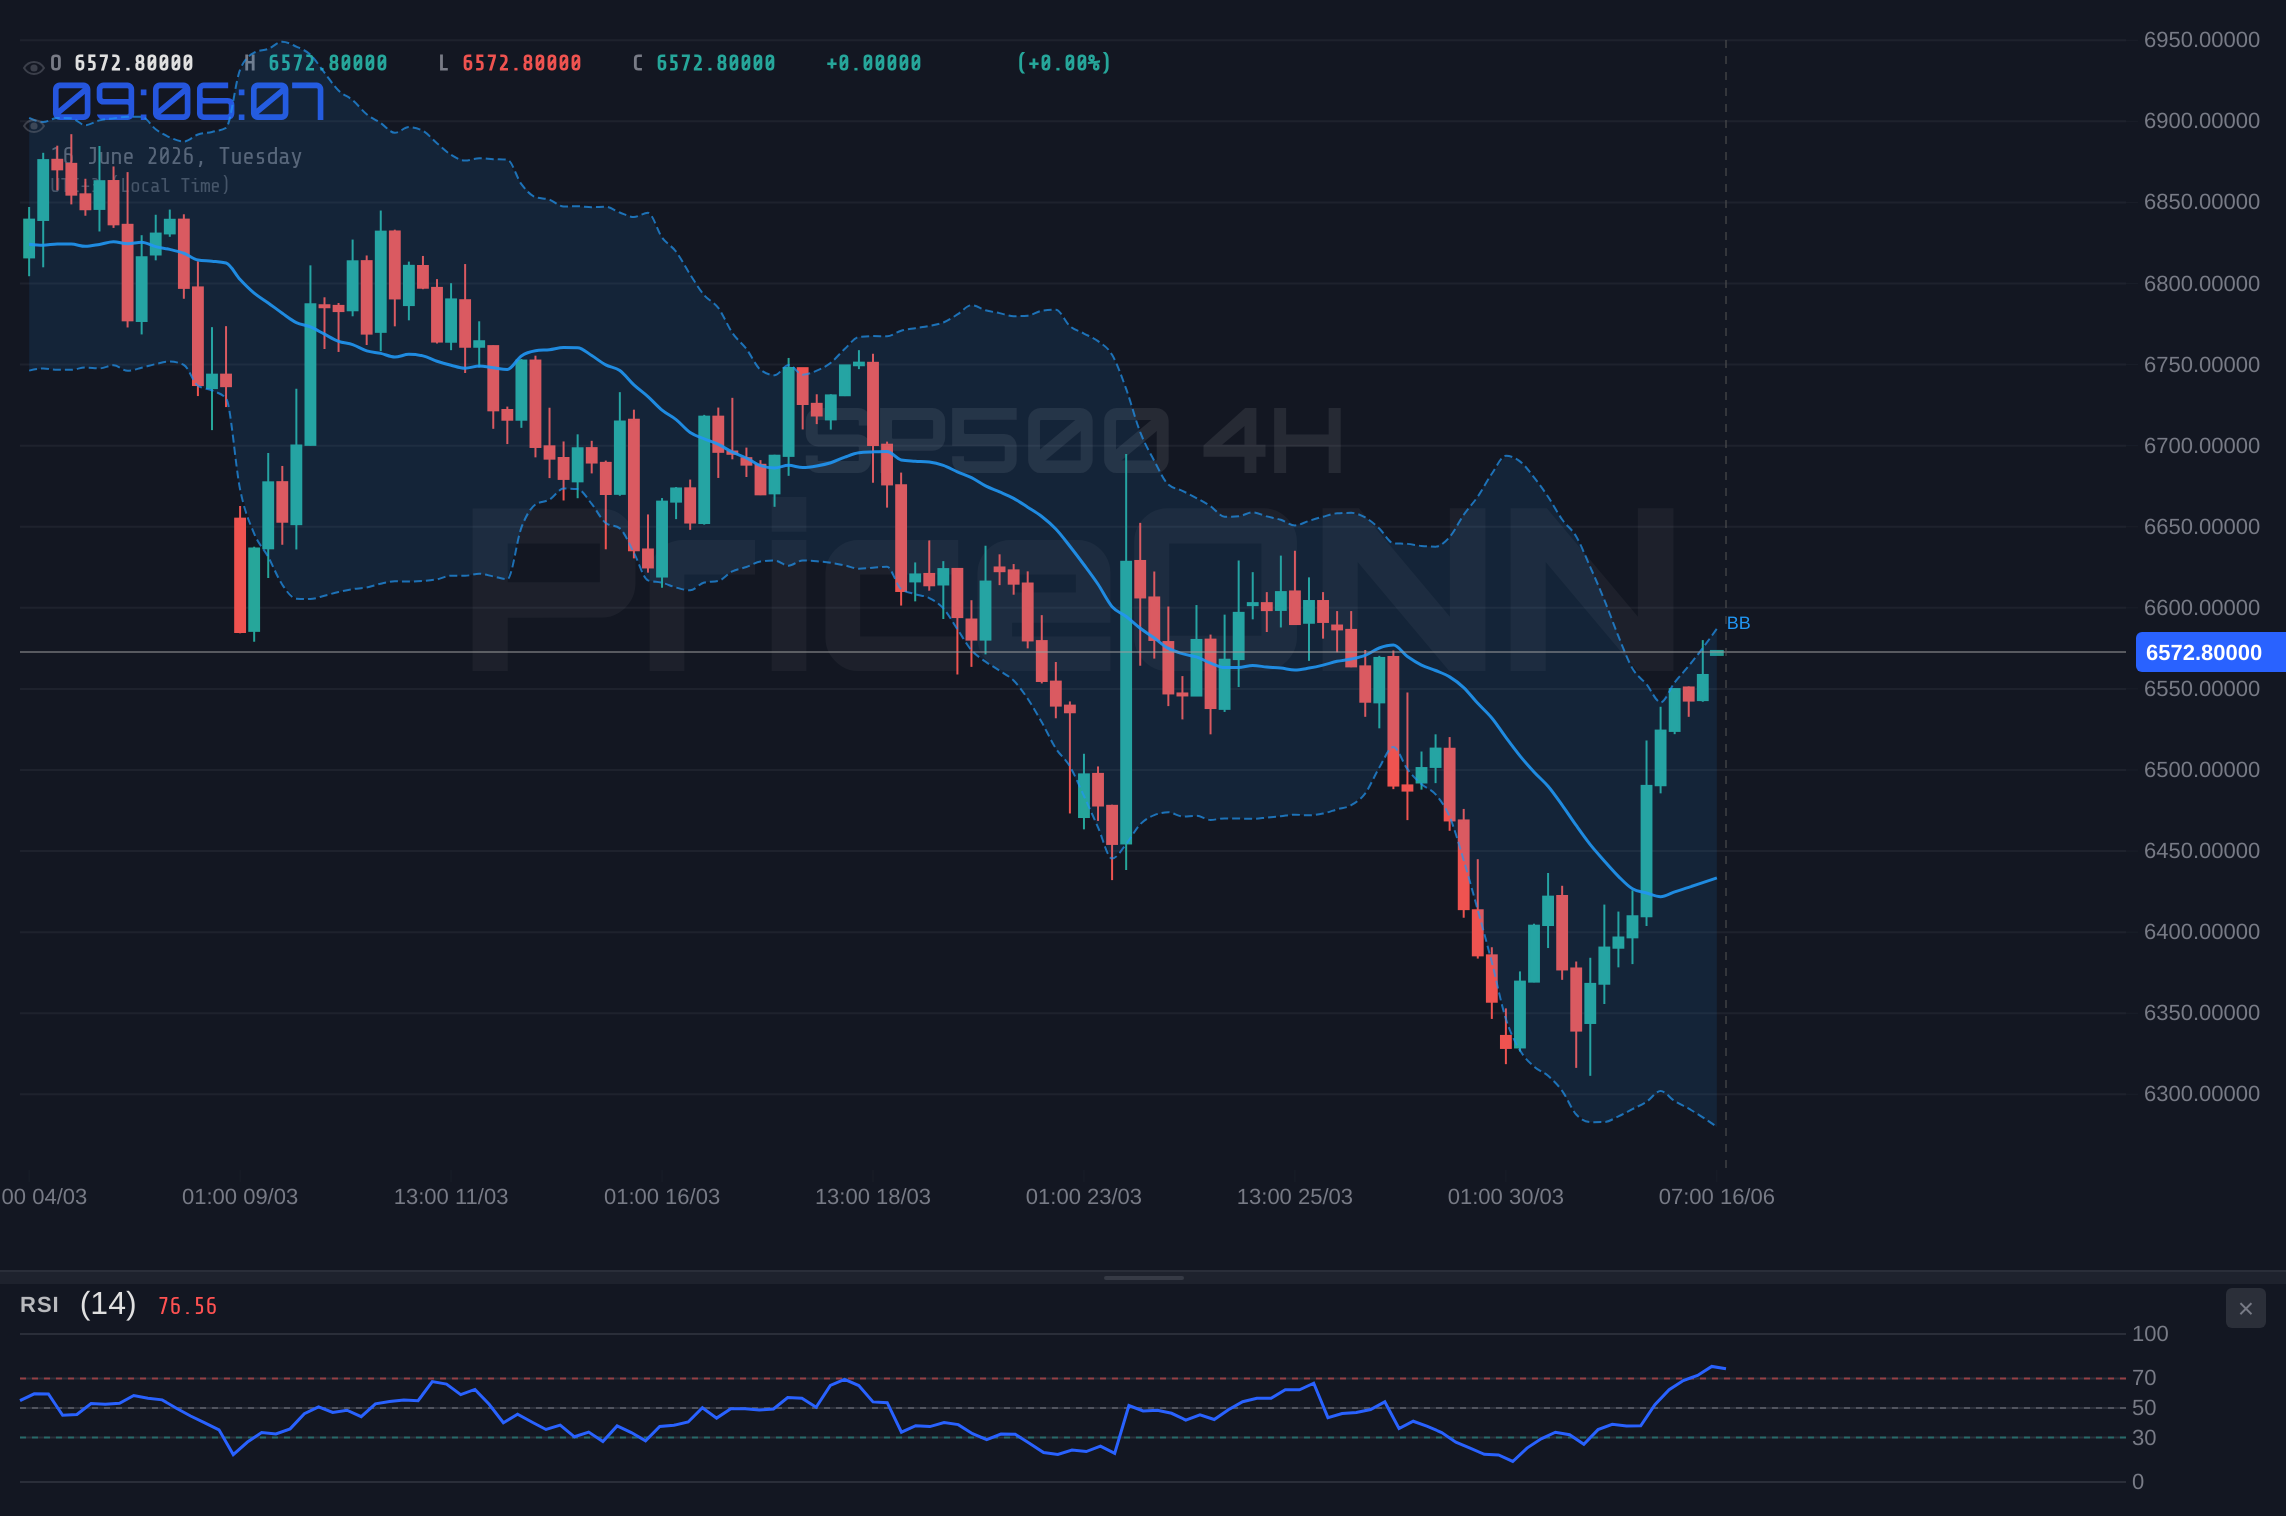
The S&P 500's ascent has brought it squarely to the doorstep of a significant resistance zone, currently hovering near the $6,572.87 level. This area has proven to be a formidable barrier, and the price action over the past few sessions indicates a struggle for bulls to decisively break through. On the 1-hour timeframe, the Relative Strength Index (RSI) is sitting at 70.95, a reading that typically signals an overbought condition. While this doesn't automatically mean a reversal is imminent, it does suggest that the buying momentum is waning and that a period of consolidation or a pullback is becoming more probable. The MACD indicator on this timeframe is also showing negative momentum, with the MACD line below the signal line, further underscoring the immediate selling pressure building up. This technical picture suggests that while the broader trend might still be upward, short-term traders should exercise caution as the index tests these higher levels.
The strength of the Dollar Index (DXY), currently at 99.82 and showing signs of upward momentum, adds another layer of complexity. A stronger dollar often correlates with pressure on global equity markets, as it makes dollar-denominated assets more expensive for foreign investors and can signal a flight to safety. This inverse correlation is particularly relevant for commodities like gold, but it also impacts the attractiveness of US equities. The fact that the SP500 is attempting to push higher despite a strengthening dollar highlights the underlying demand for risk assets, yet it also points to the inherent tension in the market. The ADX on the 1-hour chart stands at a robust 49.72, indicating a strong trend is in play, but the conflicting signals from RSI and MACD suggest this trend might be facing internal headwinds as it approaches key resistance.
Support Levels to Watch
While the focus is on the resistance at $6,572.87, understanding the support structure is equally crucial for assessing the SP500's outlook. The market data clearly outlines key support levels that could cushion any potential downside movement. The nearest significant support is identified at $6,526.53. This level has been tested multiple times recently, and its ability to hold will be a critical determinant of whether the current upward momentum can be sustained or if a deeper correction is on the cards. Below this, traders are watching $6,547.63 and $6,535.07 as intermediate support zones that could offer temporary respite.
The 4-hour chart provides a slightly different perspective, showing support levels at $6,533.23, $6,523.67, and $6,514.53. The confluence of these levels around the $6,500 psychological mark suggests a strong demand zone that could attract buyers on any significant dip. The ADX on the 4-hour chart is at 24.23, indicating a moderate uptrend, which, combined with the RSI at 62.83, suggests that while the market is in an uptrend, it's not excessively overbought on this timeframe. However, the Stochastic oscillator on the 4-hour chart is flashing an overbought signal (K=97.85, D=86.96), which could foreshadow a short-term reversal or at least a pause in the rally. This divergence between the longer and shorter timeframes underscores the need for a nuanced approach.
The Macroeconomic Crosscurrents Shaping SP500
Interest Rate Expectations and Fed Policy
The narrative surrounding Federal Reserve policy remains a dominant force in shaping market sentiment, and by extension, the trajectory of the SP500. While recent inflation data has shown some encouraging signs of cooling, the central bank has maintained a cautious stance, emphasizing the need for sustained progress before considering any significant shifts in monetary policy. The CME FedWatch Tool, which reflects market expectations for interest rate changes, indicates a persistent uncertainty about the timing and magnitude of potential rate cuts. This ambiguity creates a volatile environment for equities, as any hint of hawkishness from Fed officials can quickly dampen risk appetite, while signs of easing could fuel further rallies.
The market's interpretation of Fed commentary and economic data is crucial. For instance, a slightly hotter-than-expected inflation report (CPI) or a surprisingly strong Non-Farm Payrolls (NFP) number could lead traders to push back their expectations for rate cuts, putting downward pressure on the SP500. Conversely, softer inflation figures or weaker employment data might reinforce expectations of a Fed pivot, potentially driving the index higher. The correlation between SP500 movements and interest rate expectations is undeniable; as Treasury yields rise on the prospect of higher-for-longer rates, the cost of capital increases, which can negatively impact corporate earnings and stock valuations. The current SP500 price of $6,572.87 is being priced in an environment where the market is constantly reassessing the Fed's next move, making forward-looking statements from Fed officials a key focus for traders.
Inflation, Growth, and Global Correlations
The persistent challenge of inflation continues to cast a long shadow over the global economy and financial markets. While headline inflation may be showing signs of moderation, core inflation, which excludes volatile food and energy prices, remains stubbornly high in many developed economies. This has led to a delicate balancing act for central banks, who are keen to bring inflation back to their targets without triggering a severe economic downturn. The SP500's performance is intrinsically linked to these macroeconomic trends. Stronger-than-expected GDP growth figures, for example, could be a double-edged sword: positive for corporate earnings but potentially negative if it fuels inflation fears and prompts further hawkishness from central banks.
The recent sharp decline in oil prices, as reported by JP Morgan, presents an interesting dynamic. Tumbling oil prices can act as a significant tailwind for global stock markets by reducing input costs for businesses and increasing consumer purchasing power. This could potentially offset some of the inflationary pressures and allow central banks more flexibility. However, a rapid and sustained drop in oil prices can also signal weakening global demand, which would be a negative for corporate revenues and overall economic growth. The interplay between energy prices, inflation, and growth is complex, and the SP500's reaction to these factors will be closely watched. The current price of $6,572.87 reflects a market trying to digest these competing forces, with the potential for significant volatility as new data emerges.
Furthermore, the correlation between major indices and currency pairs, particularly EUR/USD and USD/JPY, cannot be ignored. The Eurozone recently recorded a trade deficit, a deterioration from previous months, amidst strong import growth. While this might seem distant from the SP500's performance, it reflects broader global economic health and trade dynamics. A weakening Euro could indirectly impact US exports and corporate earnings, while a strong dollar, driven by factors like the DXY's current level of 99.82, can put pressure on multinational corporations listed on the SP500. The market is a global ecosystem, and these interconnections are vital for a comprehensive analysis.
Trading Scenarios and Forward-Looking Insights
The Bullish Case: Breaking the Ceiling
For the bulls to maintain control and push the SP500 higher, a decisive break above the current resistance near $6,572.87 is paramount. The trigger for such a move would likely be a combination of positive macroeconomic news – perhaps softer inflation data or a more dovish tone from the Federal Reserve – coupled with strong technical confirmation. If the index can convincingly close above the $6,572.87 resistance, the next psychological target would be the $6,605.07 level, followed by $6,685.83. Such a breakout would likely be accompanied by increasing volume and a bullish shift in momentum indicators, potentially invalidating the overbought signals seen on the shorter timeframes. Historically, when the SP500 has managed to overcome such significant resistance levels with conviction, it has often paved the way for a sustained rally. The ADX on the daily chart at 47.51, despite being in a downtrend, indicates that if a new trend were to emerge, it could be strong. This scenario hinges on the market receiving a clear signal that the Fed is prepared to ease policy sooner rather than later, or that inflation is definitively under control.
The Bearish Scenario: Retreat and Consolidation
Conversely, if the resistance at $6,572.87 holds firm, as suggested by the current RSI reading of 70.95 and the negative MACD momentum on the 1-hour chart, a pullback becomes the more probable scenario. The immediate invalidation for this bearish outlook would be a sustained close above $6,572.87, particularly on the 4-hour or daily charts. However, if the price fails to break higher and instead retreats, the first key support level to watch would be $6,526.53. A break below this level could open the door for further downside, targeting $6,535.07 and then $6,547.63. The ADX at 49.72 on the 1-hour chart indicates a strong trend, which, if it reverses, could lead to a sharp move lower. This bearish thesis is supported by the ongoing strength of the DXY at 99.82, which continues to exert pressure on risk assets. Traders anticipating this scenario would be looking for confirmation through increasing selling volume and a bearish cross on the MACD. The market sentiment could shift rapidly if upcoming economic data disappoints or if geopolitical tensions escalate, leading to a flight to safety.
The Neutral Scenario: Range-Bound Uncertainty
Given the conflicting signals across different timeframes and the current macroeconomic ambiguity, a neutral, range-bound scenario is also a distinct possibility. This would involve the SP500 consolidating between the key support at $6,526.53 and the resistance at $6,572.87. In this environment, traders might look for opportunities to trade within the range, buying near support and selling near resistance, while awaiting a clearer directional signal. The weak trend strength indicated by the ADX on the 1-hour chart (16.02) and the DXY's sideways movement around 99.82 could support this view. Such a period of consolidation allows the market to digest recent moves and for indicators like the RSI to reset from overbought or oversold levels. The key for this scenario is the absence of a strong catalyst to break the established range. Traders might see this as a period to exercise patience, manage risk tightly, and wait for a confirmed breakout in either direction before committing to larger positions. The market is currently a complex puzzle, and this neutral phase could persist until a significant economic event or policy shift provides the necessary clarity.
Conclusion: Patience and Precision in a Volatile Market
The SP500's current position near $6,572.87 presents a classic technical and fundamental dilemma. Resistance is holding, yet the underlying demand for risk assets remains resilient, creating a tense standoff. The interplay between Fed policy expectations, inflation data, and geopolitical risks means that volatility is likely to remain a key feature of the market landscape. As traders, our primary objective must be to navigate this uncertainty with discipline and precision. The data suggests that while the bulls have shown tenacity, the overbought conditions on shorter timeframes and the persistent strength of the dollar present significant headwinds. Conversely, the support levels below $6,572.87 appear robust enough to warrant caution against aggressive short-selling without clear confirmation.
The path forward will likely be dictated by upcoming economic releases and central bank commentary. A shift in the Federal Reserve's stance, particularly regarding interest rate policy, could be the catalyst needed to break the current stalemate. Until then, maintaining a balanced perspective, respecting key price levels, and managing risk diligently will be paramount. The market always provides opportunities, but they often come disguised as challenges. By staying informed, adhering to a well-defined strategy, and exercising patience, traders can position themselves to benefit from the eventual resolution of this critical market juncture.
Frequently Asked Questions: SP500 Analysis
What happens if the SP500 breaks decisively above the $6,572.87 resistance level?
A strong close above $6,572.87 would likely trigger further buying, targeting the $6,605.07 resistance level. This scenario would be reinforced by positive macroeconomic news, such as softer inflation data, and confirmation from momentum indicators shifting bullishly on longer timeframes.
Should I consider buying the SP500 at current levels around $6,572.87, given the RSI is at 70.95?
Buying at current levels with an RSI of 70.95 is risky due to potential overbought conditions on the 1-hour chart. A more prudent approach would be to wait for a pullback towards support near $6,526.53 or confirmation of a breakout above $6,572.87 with increased volume.
Is the MACD negative momentum on the 1-hour chart a strong sell signal for the SP500?
The negative MACD momentum on the 1-hour chart suggests short-term selling pressure, but it's not a definitive sell signal on its own, especially given the broader uptrend. Confirmation from a break below key support levels like $6,526.53 would be needed for a stronger bearish conviction.
How will the DXY's current level of 99.82 affect the SP500's outlook this week?
The DXY at 99.82 indicates a relatively strong dollar, which generally exerts downward pressure on risk assets like the SP500. Traders should monitor this correlation closely; if the DXY continues to climb, it could hinder further upside for the SP500, especially if it coincides with negative economic data.
Track markets in real-time
AI-powered analysis, technical indicators and real-time price data.
Join Our Telegram Channel
Breaking market news, AI analysis and trading signals instantly.
Join Channel