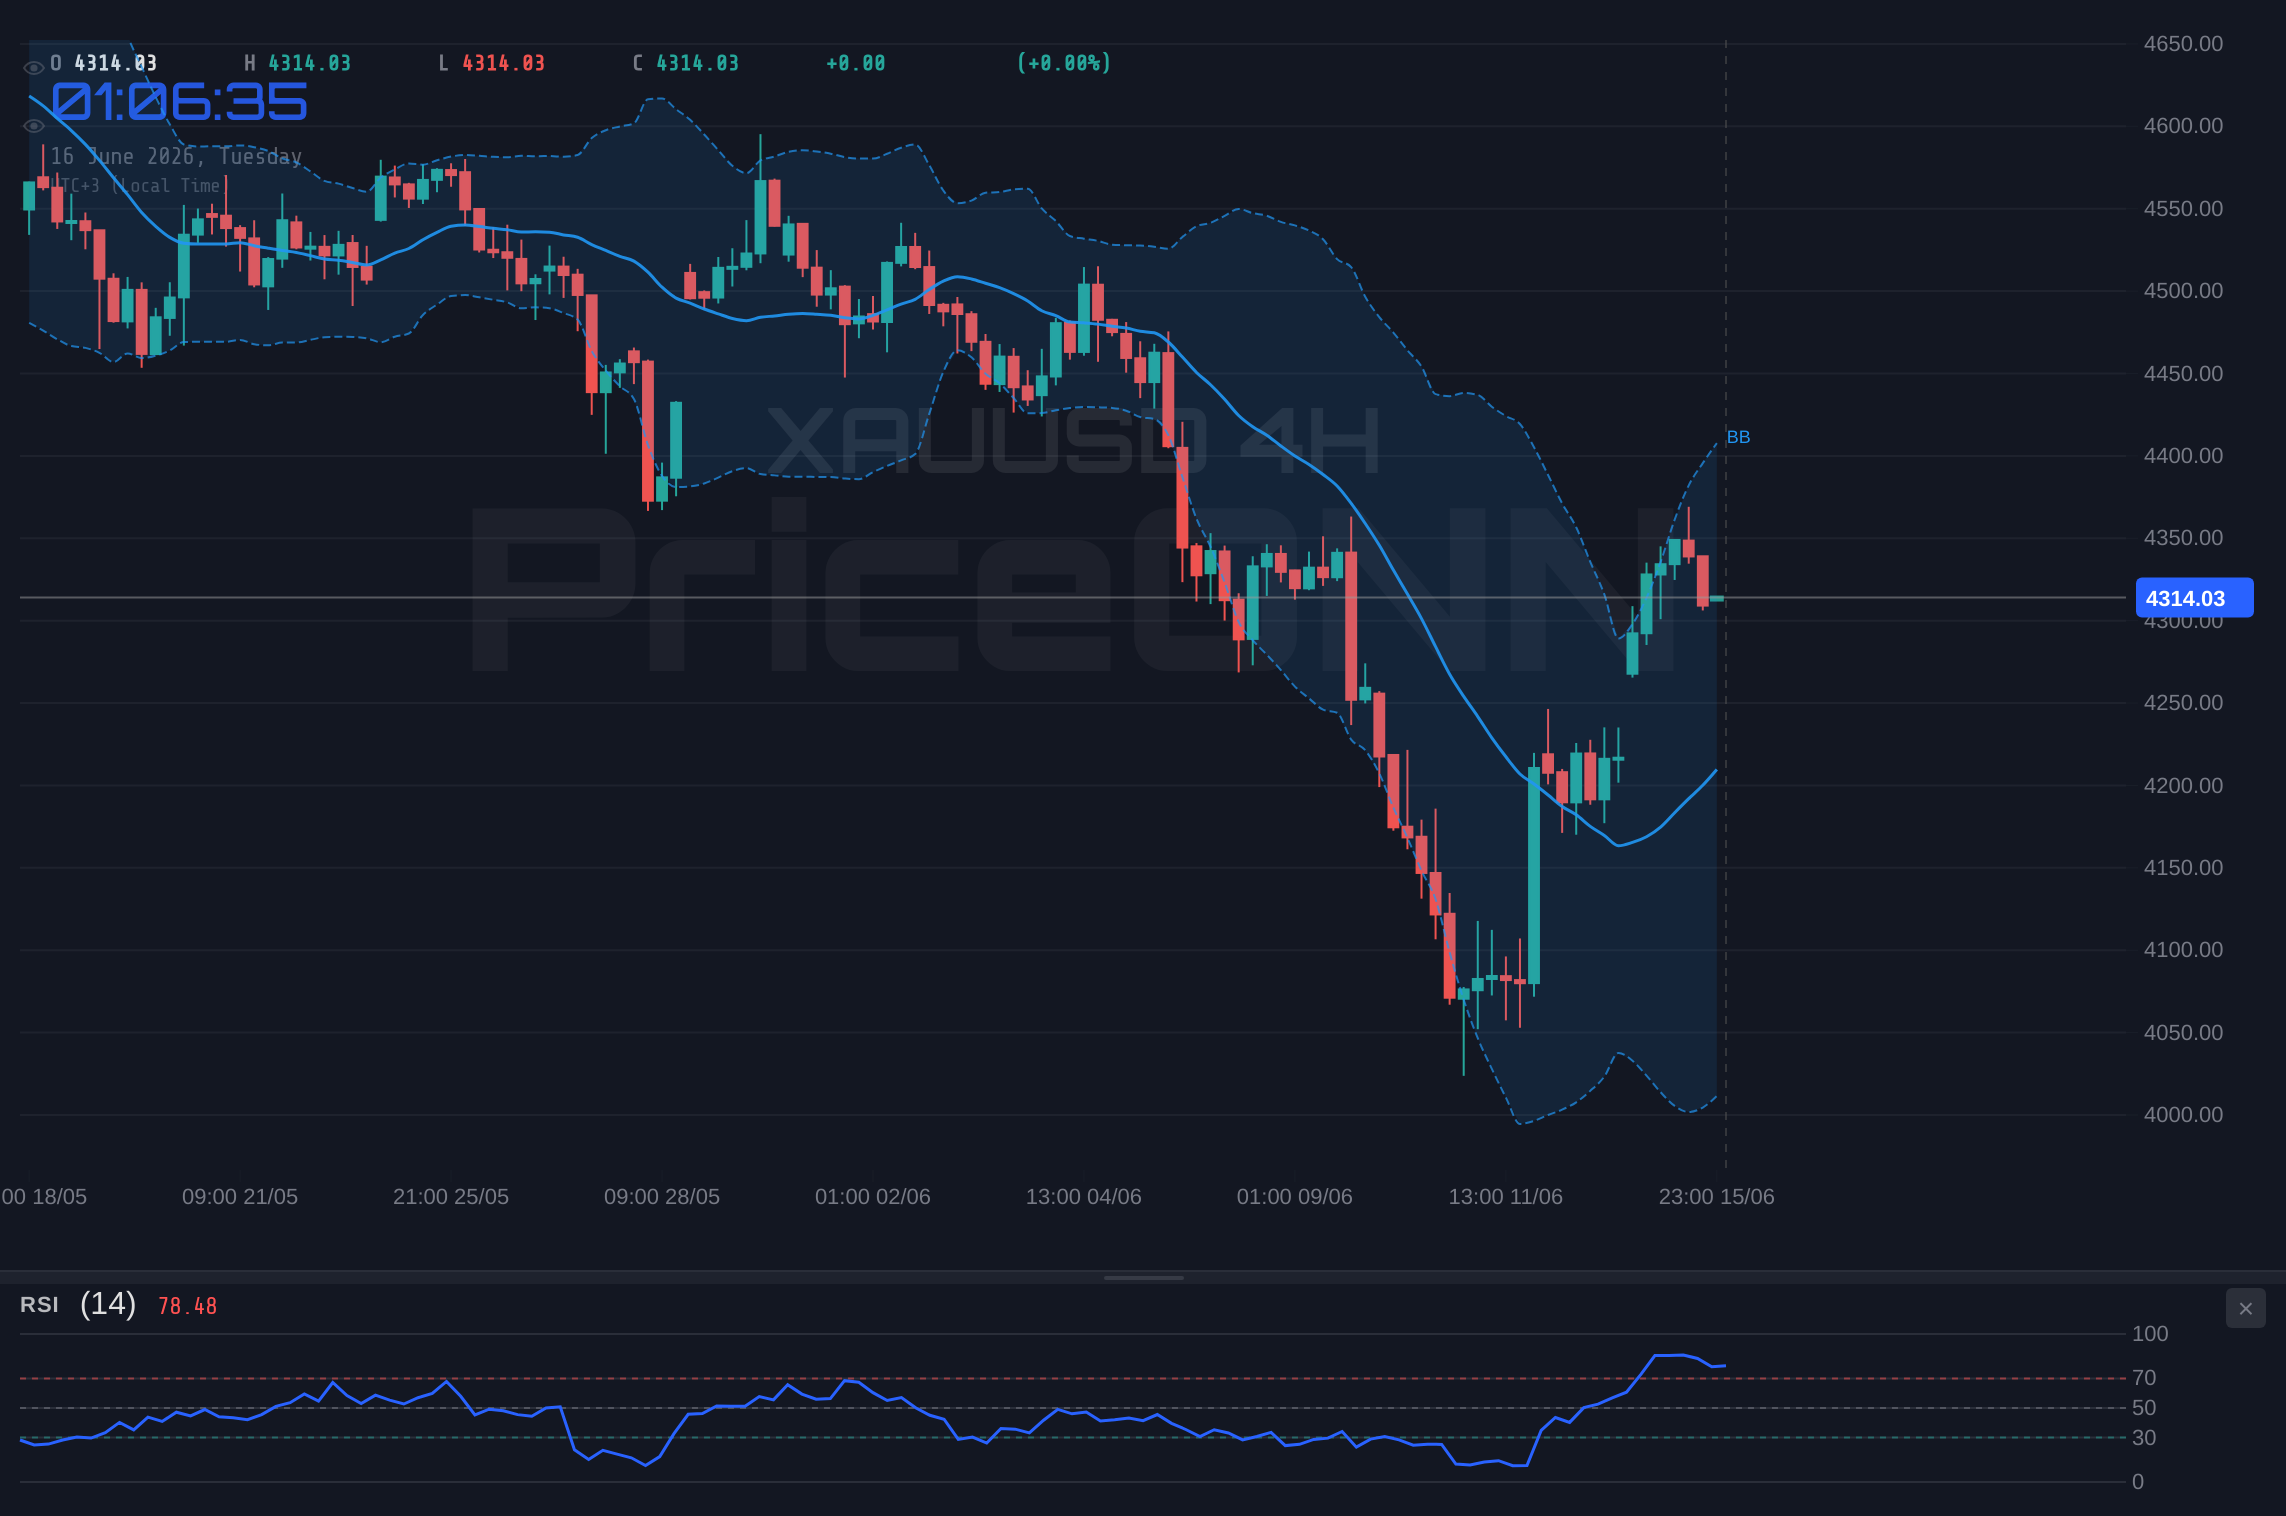
This is precisely where the battle lines are drawn for gold traders. With XAUUSD currently hovering around the $4,313.37 mark, the market is at a critical juncture, testing the $4,326.12 resistance level. This isn't just another price point; it's a battleground where bulls and bears are fiercely contesting control, and the outcome could dictate the short-to-medium term trajectory for the precious metal. The 1-hour chart shows a neutral trend with a slight bullish lean, while the 4-hour timeframe signals a stronger bullish inclination. However, the daily chart paints a starkly different picture, indicating a dominant bearish trend. This divergence across timeframes is exactly what creates the tension we're seeing, and understanding how these conflicting signals interact is key to navigating the current market sentiment.
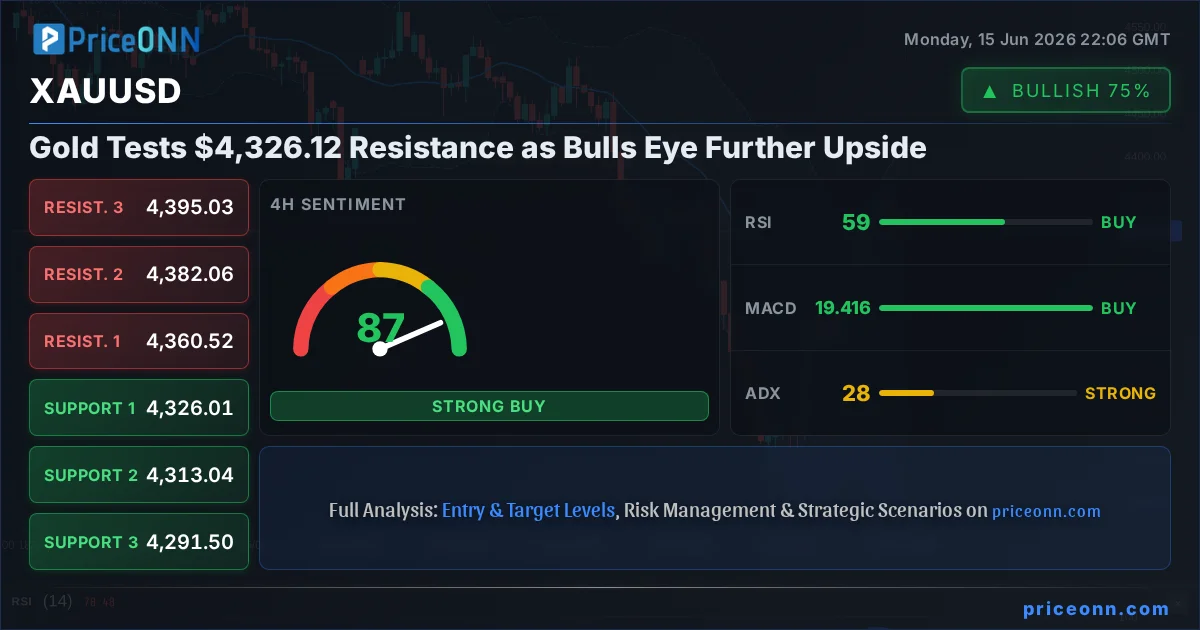
- RSI at 53.7 on the 1H chart signals neutral momentum, but a bullish lean on the 4H (58.89) suggests underlying buying interest.
- Critical resistance sits at $4,326.12, a level XAUUSD is currently testing. A sustained break above this could trigger further upside.
- The daily chart shows a strong bearish trend (ADX: 35.41) with RSI at 42.82, indicating that while short-term sentiment is mixed, the longer-term picture remains cautious.
- Correlation with DXY at 99.71 and SP500 at 6572.87 shows mixed risk appetite, impacting gold's safe-haven appeal.
The Bullish Case: Is Gold Poised for a Breakout?
The bulls have a compelling argument, particularly when looking at the immediate intraday and 4-hour technicals. On the 1-hour chart, while the RSI at 53.7 is neutral, it does show a subtle upward trend, suggesting that buyers are not entirely absent. More importantly, the 4-hour RSI stands at a more robust 58.89, firmly within the neutral zone but leaning towards bullish territory. This indicates a growing positive momentum that could push prices higher. The MACD on the 4-hour timeframe is also positive, with the MACD line sitting above its signal line, a classic sign of strengthening upward pressure. The Stochastic Oscillator on the 4-hour chart is in the overbought region (K=85.21, D=91.54), which often precedes a pullback, but in a strong uptrend, it can remain elevated for extended periods, signaling sustained buying interest. The ADX on the 4-hour chart is 28.37, confirming a strong uptrend, which adds weight to the bullish argument for the shorter timeframes.
Furthermore, the overall market sentiment, as indicated by the SP500 trading at 6572.87 and showing a daily gain of 0.74%, suggests a risk-on environment. This typically dampens demand for safe-haven assets like gold, but the fact that gold is showing resilience and even testing resistance implies underlying strength that might be driven by factors beyond simple risk appetite. The recent news regarding a potential US-Iran interim agreement, as reported by forex news outlets, could also be interpreted in various ways. While it might reduce geopolitical tensions, thus lessening gold's safe-haven appeal, it also facilitated a broader risk-on rally, which paradoxically can sometimes lift gold as traders anticipate inflation or seek assets that perform well in a growth environment. The significant 2.29% daily gain for XAUUSD, moving from a low of 4265.45 to a high of 4369.1, demonstrates substantial buying power that cannot be ignored. The price itself is currently $4,313.37, and the ability of bulls to defend levels like $4,311.24 and push towards the $4,326.12 resistance is a testament to their immediate control.
The immediate price action on the 1-hour chart shows support at $4,316.08 and $4,311.24, which have held firm during the intraday trading. The resistance levels to watch are $4,326.12 and $4,331.32. A decisive breach above $4,326.12, especially with increasing volume, would be a strong signal for the bulls, suggesting a continuation of the upward momentum seen in the 4-hour timeframe. This breakout scenario would likely be fueled by a further softening of the US dollar index (DXY), which is currently at 99.71, or a continued rally in equity markets. The narrative for the bulls is that the current upward push is the beginning of a sustained rally, potentially targeting higher resistance levels on the daily chart, such as $4,328.45, and eventually aiming for even more significant psychological levels. This perspective hinges on the belief that the underlying bullish technicals on the 4-hour chart will eventually override the bearish signals on the daily timeframe.
A sustained close above the 1-hour resistance at $4,326.12, ideally accompanied by increasing trading volume and a weakening DXY.
The Bearish Counter-Argument: Daily Trend and Overbought Stochastics
Despite the intraday bullish signals, the bears have a formidable case, primarily anchored by the daily chart's technical setup and the broader economic context. The daily timeframe paints a clear picture of a dominant bearish trend, with an ADX reading of 35.41 indicating strong downward momentum. The RSI at 42.82 is below the 50 level and shows a downward tendency, suggesting that sellers are still in command over the longer term. The MACD on the daily chart is negative, with the MACD line well below its signal line, reinforcing the bearish outlook. Furthermore, the Bollinger Bands on the daily chart are below the middle band, indicating a bearish bias and suggesting that prices could continue to fall. The Stochastic Oscillator on the daily chart, while currently showing a bullish signal (K=44.01, D=20.94, with %K > %D), is coming from oversold territory and needs to overcome significant resistance to signal a true reversal. Its current position doesn't negate the prevailing downtrend.
The current price of $4,313.37 is still trading below the daily middle Bollinger Band, which acts as a crucial pivot point. The support levels on the daily chart are significantly lower: $4,175.81, $4,134.79, and $4,099.49. A failure to hold the immediate intraday supports could see a rapid decline towards these levels, especially if broader market sentiment shifts. The SP500, currently at 6572.87, has seen a substantial 0.74% gain today, but this could be a temporary relief rally in a longer-term bearish trend for equities, which would then increase demand for safe havens like gold, but only if the selling pressure isn't too extreme. However, if the narrative shifts back to inflation concerns or geopolitical risks that haven't fully dissipated, gold could indeed fall as liquidity is pulled from riskier assets. The news about oil prices plunging by as much as 7.29% for Brent crude, influenced by the US-Iran deal, suggests a potential easing of inflationary pressures, which could reduce gold's appeal as an inflation hedge.
Moreover, the 4-hour Stochastic Oscillator is deeply in overbought territory (K=85.21, D=91.54). While this can persist in strong uptrends, it also signals a heightened risk of a sharp correction or pullback. If gold fails to break decisively above the $4,326.12 resistance and instead retreats, this overbought condition could exacerbate the downward move. The general signal across all timeframes shows a mixed picture, but the daily chart's bearish dominance (1 Sat: 7 Al) is a significant concern. The bears' strategy would be to capitalize on any weakness near the current resistance, push the price back below the 1-hour support at $4,316.08, and then target the lower daily support levels. The narrative here is that the recent rally is merely a retracement within a larger downtrend, and the daily technicals are the most reliable indicators of the true market direction.
A failure to decisively break above $4,326.12, followed by a close below the 1-hour support at $4,316.08, especially if accompanied by a strengthening DXY or falling equity markets.
The Crucial Battleground: Bridging the Timeframes
The divergence between the short-term bullish signals and the long-term bearish trend is the central theme for XAUUSD right now. On the 1-hour chart, the ADX at 33.93 indicates a strong trend, but the MACD shows negative momentum, which is contradictory. Similarly, the 4-hour chart exhibits a strong uptrend (ADX: 28.37) with a generally bullish signal aggregation, yet the daily chart's ADX of 35.41 points to a strong downtrend. This conflict means that any move is likely to be volatile, with sharp reversals possible. Traders are essentially caught between the immediate buying pressure and the overarching bearish structure. The current price of $4,313.37 sits precariously between the 1-hour support at $4,316.08 and the resistance at $4,326.12. A move through either of these levels will be crucial in determining the next immediate direction.
The DXY's movement is also a key factor. Currently at 99.71 and showing a bullish signal on the 1-hour chart, it adds pressure to gold. However, its 4-hour and daily signals are mixed, suggesting uncertainty in the dollar's direction. If the DXY breaks higher, it would typically weigh on XAUUSD. Conversely, if the DXY falters, it could provide the catalyst for gold to break through its immediate resistance. The SP500's rally to 6572.87 is another piece of the puzzle. A continued risk-on sentiment would usually be bearish for gold, but the metal's resilience suggests other factors, like inflation expectations or geopolitical undercurrents, might be at play. The recent news about oil prices plunging could be interpreted as a sign of easing inflation, which would typically be negative for gold. However, if this oil price drop is due to specific supply dynamics rather than a global demand slowdown, gold might remain supported by other factors.
The Stochastic Oscillator provides another layer of complexity. On the 4-hour chart, it's in overbought territory, suggesting a potential pullback. On the 1-hour chart, it's showing a bearish signal (K=11.52, D=38.52), reinforcing the idea of near-term weakness. However, on the daily chart, it's showing a bullish signal (K=44.01, D=20.94). This conflicting information highlights the need for caution. A trader looking to go long might wait for confirmation of a breakout above $4,326.12, perhaps seeing the RSI move above 60 and the MACD turn more bullish on the daily chart. Conversely, a short-seller might look for a rejection at resistance and a break of the immediate 1-hour supports, confirming the bearish bias seen on the daily chart. The market is essentially waiting for a clearer signal, a confluence of indicators and price action that can definitively break this deadlock.
The key is the interplay between the $4,326.12 resistance and the daily bearish trend. A confirmed break above this level is needed to challenge the longer-term bearish narrative.
Trade Scenarios: Navigating the Gold Market
Bearish Scenario: Retreat from Resistance
55% ProbabilityBullish Scenario: Breakout Above Resistance
35% ProbabilityNeutral Scenario: Consolidation and Range Play
10% ProbabilityThe Verdict: Caution Amidst Conflicting Signals
As a seasoned trader, the current XAUUSD setup at $4,313.37 screams caution. While the intraday charts offer tantalizing glimpses of a potential breakout, the dominant bearish trend on the daily timeframe cannot be ignored. The ADX readings across different timeframes present a confusing picture: strong trends on both the 1-hour (33.93) and 4-hour (28.37) charts, yet also a strong downtrend on the daily (35.41). This suggests that while short-term momentum might favor the bulls, the larger market structure is still tilted towards the downside. The RSI values are also conflicting, with 4-hour leaning bullish (58.89) while the daily is bearish (42.82). The Stochastic Oscillator's overbought condition on the 4-hour chart adds to the risk of a pullback. Therefore, the most prudent approach is to wait for clearer confirmation.
For bulls, the confirmation would be a decisive break above $4,326.12, ideally with increasing volume and a weakening DXY. This would suggest that the daily bearish trend is faltering and the short-term strength is translating into a broader trend change. Until then, any long positions should be managed tightly with strict stop-losses, perhaps below the $4,311.24 support level. For bears, confirmation comes from a rejection at the $4,326.12 resistance and a subsequent break below the $4,316.08 and $4,311.24 supports. This would align with the daily bearish trend and open the door for a move lower, potentially towards the $4,287.43 level. The recent news of a US-Iran deal potentially easing geopolitical tensions and contributing to falling oil prices could reduce gold's safe-haven appeal, adding another layer of pressure on the bulls.
Ultimately, the market is presenting a classic bull vs. bear debate at a critical resistance level. While the allure of a breakout above $4,326.12 is strong, the prevailing daily bearish trend and conflicting indicator signals warrant a patient and risk-aware approach. The market is providing ample opportunities, but the key is to wait for the setup that aligns with a higher probability outcome, rather than chasing the immediate momentum. Managing risk effectively will be paramount in navigating this indecisive period for gold. The next few trading sessions will likely be decisive in determining whether gold can overcome its daily bearish structure or if this resistance level will hold firm, leading to a deeper correction.
Frequently Asked Questions: XAUUSD Analysis
What happens if XAUUSD breaks above the $4,326.12 resistance level?
A sustained break above $4,326.12, especially with strong volume, could invalidate the current daily bearish trend and signal further upside. Bulls would likely target the next resistance at $4,336.16, potentially extending towards $4,360.52 on the 4-hour chart, contingent on continued positive market sentiment and a weakening DXY.
Should I buy XAUUSD at current levels near $4,313.37 given the RSI at 53.7 and a daily bearish trend?
Buying at current levels carries significant risk due to the conflicting signals and the dominant daily bearish trend. While the 4-hour chart shows some bullishness, the daily RSI at 42.82 and ADX at 35.41 suggest caution. A more prudent approach might be to wait for a confirmed breakout above $4,326.12 or a retest of lower support levels like $4,311.24, aligning with a clearer trend.
Is the Stochastic Oscillator's overbought signal on the 4-hour chart a reliable sell signal for XAUUSD?
The Stochastic Oscillator being in overbought territory (K=85.21, D=91.54) on the 4-hour chart suggests a potential pullback is due, but it is not a standalone sell signal, especially in a strong uptrend. It indicates heightened risk of correction. Bears would look for this to coincide with a rejection at resistance and a break of key intraday support levels to confirm a bearish move.
How will the recent US-Iran deal announcement and falling oil prices affect XAUUSD this week?
The news of a US-Iran deal potentially easing geopolitical tensions and the subsequent plunge in oil prices could reduce gold's safe-haven appeal and inflation hedge status. This might add pressure on gold prices, especially if the daily bearish trend reasserts itself. However, if risk appetite continues to surge, the impact might be muted, with gold's movement dictated more by technical factors.
Track markets in real-time
AI-powered analysis, technical indicators and real-time price data.
Join Our Telegram Channel
Breaking market news, AI analysis and trading signals instantly.
Join Channel