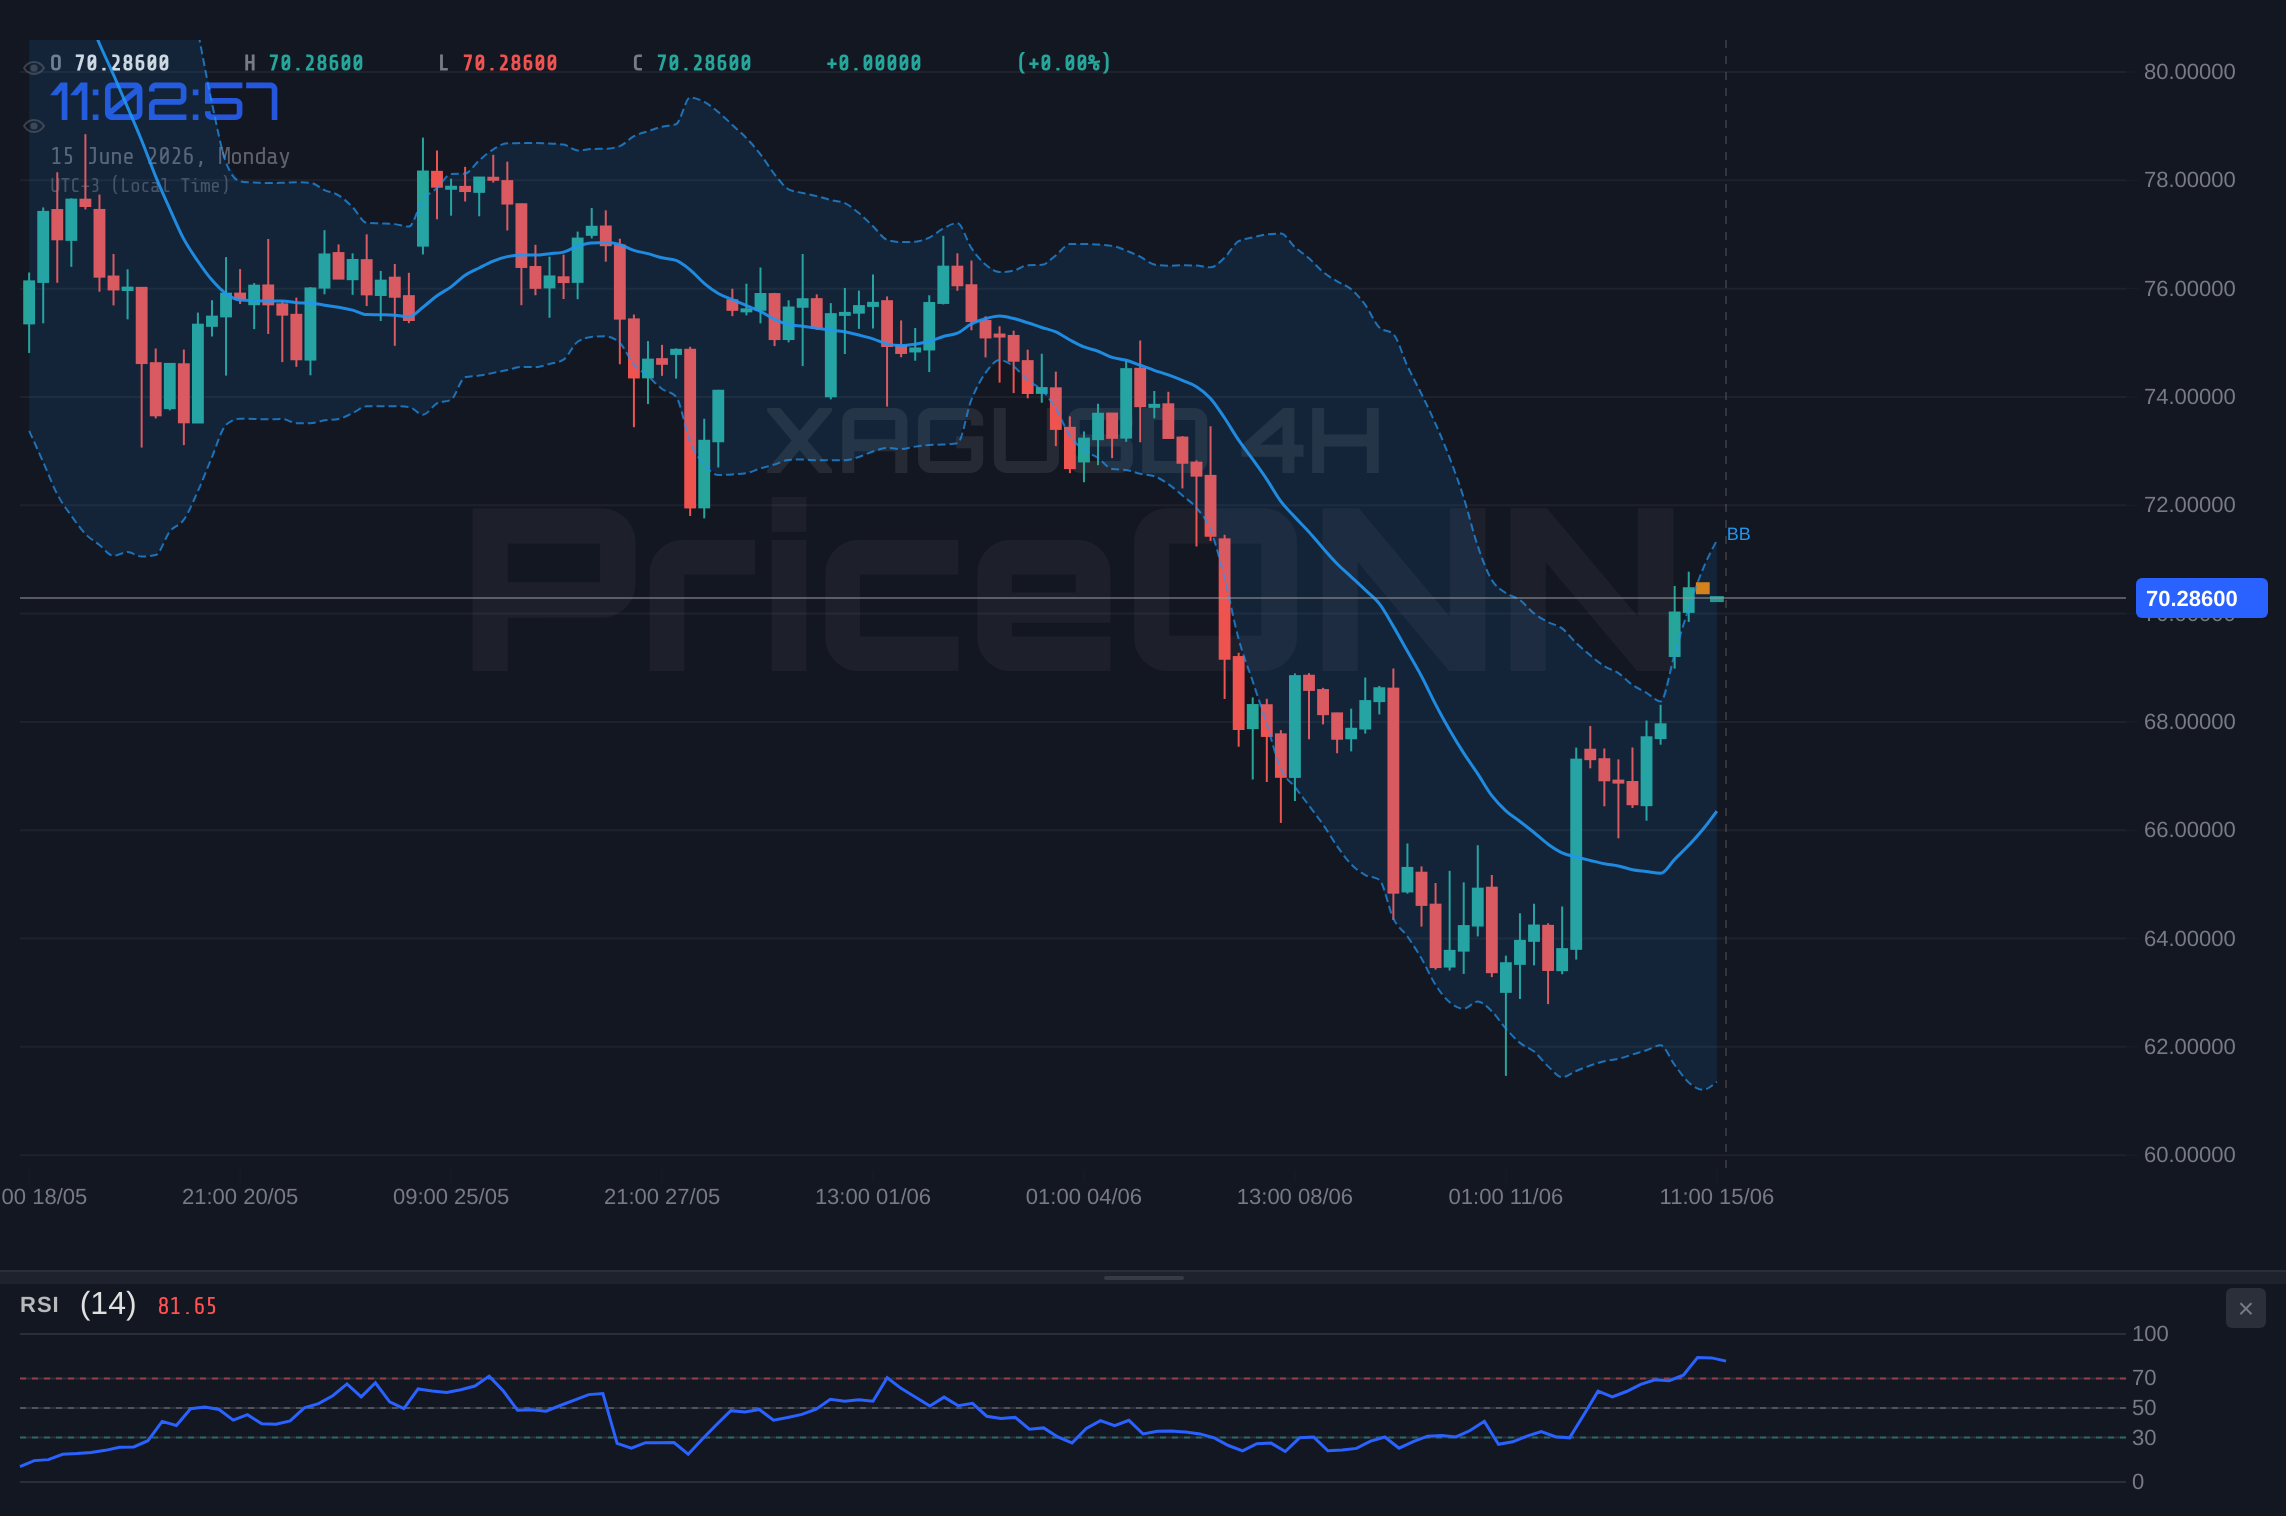
Silver has just staged a remarkable recovery, pushing towards the critical $70.26 mark. This isn't just another price fluctuation; it's a battleground where the short-term bullish momentum clashes with the dominant daily bearish trend. For traders watching XAGUSD today analysis, this juncture is where the real opportunities - and risks - lie. The question on everyone's mind is whether this surge is a sustainable breakout or merely a temporary pause before the next leg down.
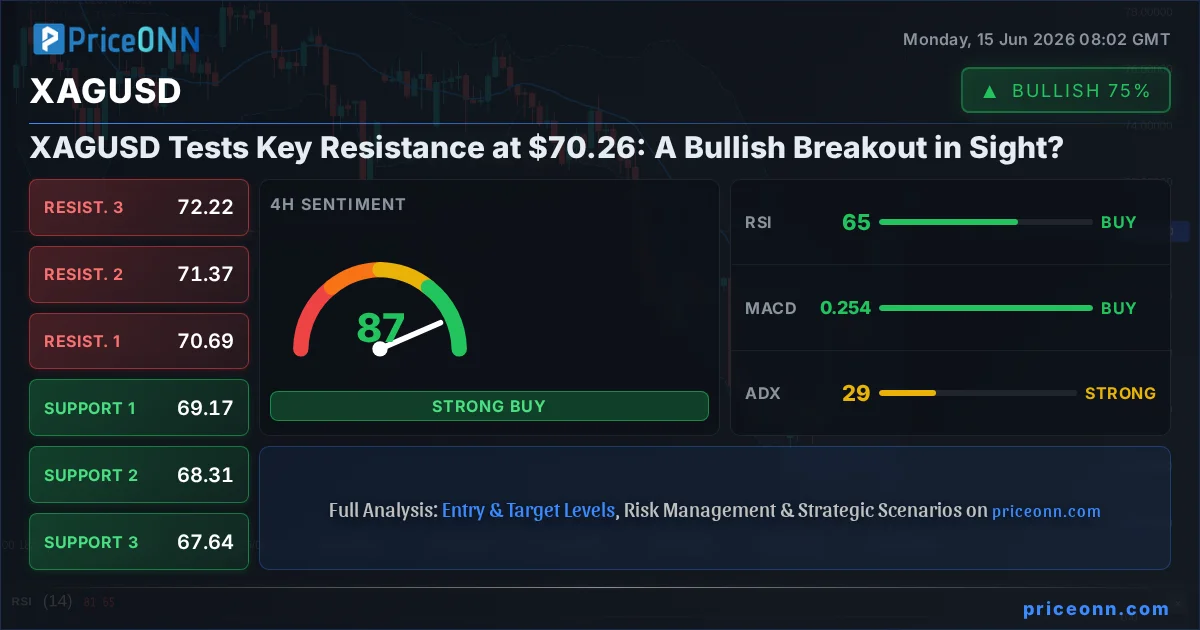
- RSI at 68.24 on the 1H chart signals strong bullish momentum, approaching overbought territory.
- The critical resistance level to watch is $70.57, with a confirmed break needed for sustained upside.
- ADX at 33.54 on the 1H timeframe indicates a strong uptrend, contrasting with the weaker trend on the daily chart.
- DXY is at 99.56, showing a slight bearish divergence with XAGUSD's upward move, suggesting potential for further silver strength if the dollar falters.
The market sentiment for silver is at a crossroads. On the 1-hour and 4-hour charts, the signals are overwhelmingly bullish. The ADX reading of 33.54 on the 1H chart signifies a robust uptrend, with bulls clearly in control in the short to medium term. This is further reinforced by the MACD, which shows positive momentum, and Bollinger Bands sitting above the middle band, indicating an upward bias. The RSI at 68.24, while nearing overbought conditions, still has room to climb, suggesting that the current upward push could have legs. Stochastic's divergence on the 1H chart (%K
However, looking at the broader daily timeframe paints a different, more cautious picture. The daily trend is firmly bearish, with an ADX of 34.57 indicating a strong downward trend is still in play. MACD is below its signal line, and Bollinger Bands are trading below the middle band, all confirming the bearish bias on a longer-term scale. This creates a significant conflict: short-term strength versus long-term weakness. The RSI at 42.95 on the daily chart, while not deeply oversold, suggests that sellers still have the upper hand in the bigger picture. This divergence between timeframes is crucial. It highlights that while short-term traders might find opportunities to the upside, the overarching trend suggests that any rallies could be met with significant selling pressure as the market approaches established resistance levels. The $70.26 price point is not just a number; it's a psychological and technical barrier.
The Dollar Index (DXY), currently at 99.56, adds another layer to this complex interplay. Historically, a rising DXY often correlates with pressure on gold and silver prices, as a stronger dollar makes these commodities more expensive for holders of other currencies. However, the current data shows a slight divergence. While the DXY is showing a neutral to slightly bearish signal on the 1H chart, XAGUSD is exhibiting strong upward momentum. This decoupling warrants attention. If the DXY were to experience a significant drop, perhaps due to upcoming economic data or central bank policy shifts, it could provide a powerful tailwind for silver, potentially accelerating its move towards higher resistance levels. Conversely, a resurgence in the DXY could quickly dampen the bulls' enthusiasm and send XAGUSD lower, testing its immediate support levels.
The energy markets, particularly Brent crude oil trading at $84.26 and WTI at $80.79, are also critical to consider in the broader market context. The sharp decline in oil prices over the last 24 hours, attributed to news of a US-Iran deal to reopen the Strait of Hormuz, has significant implications. Lower oil prices can reduce inflationary pressures, which might influence central bank policies. A less hawkish stance from central banks could, in theory, be positive for precious metals like silver, as it could lead to lower interest rates or a slower pace of rate hikes. However, the immediate effect of falling oil prices is often associated with reduced risk appetite, which could counterbalance any positive sentiment for safe-haven assets like silver, especially if the broader economic outlook darkens.
Navigating the $70.26 Juncture: What the Numbers Tell Us
Let's drill down into the specific price action around the $70.26 level. On the 1-hour chart, the immediate resistance is identified at $70.24, followed by $70.40 and $70.57. A sustained move above $70.57 would be a significant bullish signal, potentially opening the door for a test of higher levels. The daily resistance, however, lies much higher at $4278.98, a level that seems distant given the current short-term dynamics but serves as the ultimate target for any significant trend reversal. Conversely, immediate support on the 1-hour chart is found at $69.92, then $69.75, and $69.59. A break below $69.59 would signal a failure of the current bullish impulse and could lead to a swift move lower, testing the 4-hour support levels which begin at $69.17.
The daily chart's strength lies in its longer-term perspective, but its weakness is the current bearish trend. This is where the concept of multi-timeframe analysis becomes paramount. While the 1-hour and 4-hour charts scream 'buy' with ADX values above 30, indicating strong trending conditions, the daily chart's ADX of 34.57 in a downtrend cannot be ignored. This suggests that the current bullish move might be a retracement within a larger downtrend rather than the start of a new bull market. Traders often refer to this as a 'bear trap' scenario if the short-term strength fails to overcome the daily resistance. The key is to watch how price reacts at these immediate resistance levels. A rejection at $70.57, especially with increasing volume, would strongly favor the bearish thesis on the daily chart.
Considering the XAGUSD price action in the context of broader market sentiment is crucial. The S&P 500 (SP500) is trading at 6572.87, showing a significant 0.74% daily gain, suggesting a risk-on environment. This typically bodes well for riskier assets, including silver. However, the Nasdaq 100's even stronger surge to 30223.88 (+2.8%) indicates a pronounced appetite for growth and technology stocks. This 'risk-on' backdrop provides a supportive environment for silver's current rally. If this sentiment continues, it could embolden buyers to push XAGUSD through its immediate resistance. Conversely, any sudden shift towards risk aversion, perhaps triggered by unexpected geopolitical news or central bank commentary, could quickly reverse these gains and send silver prices tumbling.
The current trading signals across different timeframes present a mixed but predominantly bullish short-term outlook. The 1H chart shows a strong 'BUY' signal (7 buys, 1 sell), the 4H chart echoes this with a similar 7-1 ratio. However, the daily chart flips this entirely, leaning heavily towards 'SELL' (1 buy, 7 sells). This conflict is exactly what defines a critical trading zone. The higher timeframe (1D) bearish trend is a significant headwind for any sustained rally. For a true bullish reversal on XAGUSD, we would need to see a clear break and hold above the daily resistance at $4278.98. Until then, the dominant narrative remains bearish, and the current rally might be a strong retracement rather than a new trend. The price action around $70.26 will be the immediate determinant of which narrative prevails in the short term.
The upcoming week is packed with central bank meetings, including the Fed. Market volatility is expected to increase as traders digest these crucial policy decisions. Any hawkish surprises could strengthen the USD and pressure XAGUSD, while dovish signals might support a further rally. Traders should exercise caution and manage risk tightly.
Looking at the broader economic calendar, the lack of high-impact Eurozone data releases today means that market sentiment and geopolitical developments will likely drive currency and commodity prices. The news regarding the US-Iran deal and the potential reopening of the Strait of Hormuz has already sent shockwaves through the energy markets, leading to a sharp sell-off in oil. This event could have ripple effects, potentially easing inflation concerns and influencing central bank policy expectations. If inflation fears subside, the narrative around aggressive interest rate hikes might weaken, which could be a positive catalyst for precious metals. However, the immediate impact of falling oil prices on global growth expectations needs careful monitoring.
The Stochastic indicator on the 1H chart shows K=62.17 and D=81.85, indicating a potential pullback as %K is below %D. This aligns with the RSI approaching overbought territory and the daily bearish trend. However, on the 4H chart, Stochastic is K=93.13 and D=87.13, firmly in overbought territory and showing a bullish signal (%K > %D) which is currently being tested. This creates a short-term conflict: the 1H suggests caution, while the 4H shows strong bullish momentum, albeit in overbought conditions. The daily Stochastic, with K=31.66 and D=16.21, shows a bullish signal (%K > %D), suggesting a potential upward move from oversold levels is underway, which contradicts the overall daily trend. This complex interplay of indicators across different timeframes underscores the significance of the $70.26 price level as a pivot point.
The overall market structure for XAGUSD presents a compelling case for careful observation. The strong short-term bullish trend, supported by technical indicators on the 1H and 4H charts, is undeniable. However, the persistent daily bearish trend acts as a significant anchor, preventing a full-blown bullish reversal without a decisive break of key daily resistance. The current price action at $70.26 is testing this very conflict. A successful push above immediate resistance levels, particularly $70.57, could trigger a short-covering rally, attracting more buyers and potentially invalidating the short-term bearish outlook. Conversely, a failure to break higher and a subsequent move below the 1-hour support at $69.92 would likely reignite selling pressure, aligning with the dominant daily trend.
From a pure price action perspective, the $70.26 level represents a critical test. The daily resistance at $4278.98 is the long-term target for a trend reversal, but the immediate battle is at much lower levels. The resistance cluster around $70.24-$70.57 needs to be decisively breached. If XAGUSD can consolidate above $70.57, we might see a retest of the 4-hour resistance at $71.37 and potentially higher. On the flip side, a failure to break through could see price retreat towards the 4-hour support at $69.17, and if that gives way, the lower daily support levels around $4082.99 become relevant, though this seems unlikely in the immediate term given the current bullish momentum on shorter timeframes.
For traders, this presents a scenario demanding patience and precise execution. The conflicting signals across different timeframes mean that entering long positions requires confirmation of a sustained breakout above daily resistance, or at least above the immediate 1-hour and 4-hour resistance levels. Conversely, shorting at current levels carries the risk of being caught in a strong short-term rally. The most prudent approach might be to wait for a clearer signal: either a confirmed break above the $70.57 resistance, indicating a potential trend change, or a decisive failure at this level and a move back below the 1-hour support at $69.92, confirming the continuation of the daily bearish trend. This is where disciplined trading pays off.
The Path Forward: Scenarios for XAGUSD
Bearish Scenario: Trend Continuation
55% ProbabilityNeutral Scenario: Consolidation Range
25% ProbabilityBullish Scenario: Breakout Confirmation
20% ProbabilityThe market is at a critical juncture for XAGUSD. While the short-term charts favor buyers, the daily bearish trend remains a formidable obstacle. The interplay between the dollar, oil prices, and broader risk sentiment will be key. For those looking to trade this volatility, patience is paramount. Waiting for clear confirmation of a breakout above $70.57, or a decisive failure at this level and a return towards the lower support levels, will be crucial for navigating this indecisive market environment. The $70.26 level is more than just a price; it's a decision point.
Frequently Asked Questions: XAGUSD Analysis
What happens if XAGUSD breaks decisively above the $70.57 resistance?
A sustained break above $70.57 on the 1H and 4H charts, confirmed by strong volume, would invalidate the immediate bearish outlook. This could trigger a rally towards the 4H resistance levels at $71.37 and potentially $72.22, indicating a short-term bullish trend continuation.
Is RSI at 68.24 a sell signal for XAGUSD at current levels around $70.26?
An RSI reading of 68.24 on the 1H chart is approaching overbought territory but is not yet an automatic sell signal, especially given the strong bullish momentum indicated by ADX. However, it suggests that further upside might be limited without consolidation, and a pullback is possible before any significant move higher.
How will the US-Iran deal impacting oil prices affect XAGUSD this week?
The sharp drop in oil prices due to the US-Iran deal could ease inflation concerns, potentially leading central banks to adopt a less hawkish stance. This could support precious metals like silver. However, falling oil prices can also signal weakening global demand, which might counterbalance this effect. Traders should monitor the correlation closely.
Should I consider buying XAGUSD if it fails to break $70.57 and falls below $69.59 support?
If XAGUSD fails to overcome the $70.57 resistance and subsequently breaks below the 1-hour support at $69.59, it would strongly suggest a continuation of the daily bearish trend. In this scenario, traders might look for shorting opportunities targeting the 4-hour support levels at $69.17 and $68.31.
Track markets in real-time
AI-powered analysis, technical indicators and real-time price data.
Join Our Telegram Channel
Breaking market news, AI analysis and trading signals instantly.
Join Channel